Spatiotemporal Evolution of Forest Road Rutting and Flow Pathways Examined Using Unoccupied Aerial Vehicles (UAVs)
Funding: This research was made possible by public funding through the Cooperative Monitoring, Evaluation, and Research (CMER) Committee within the Washington State Department of Natural Resources Adaptive Management Program.
ABSTRACT
Flow pathways on unpaved forest roads are critical determinants of surface runoff and sediment transport. These flow pathways can be largely altered through road deformation caused by heavy traffic, with one of the most common types of deformation being ruts. Historically, rut development has been studied using cross-sectional analyses. More recently, remote sensing techniques, such as structure-from-motion (SfM) or terrestrial LiDAR scanning (TLS), have demonstrated their utility in mapping ruts on forest roads. However, applications of these data are limited, especially with respect to flow pathways on the road surface. Here we used SfM, with validation from TLS, to examine the spatially comprehensive development of ruts and their effects on forest road flow pathways and relative sediment transport potential. We carried out a small-scale experiment at two field sites in western Washington using unoccupied aerial vehicles (UAVs) to obtain digital elevation models (DEMs) of mainline logging road surfaces over 3 seasons. These UAV-derived DEMs were used in an elevation change analysis and a simple flow routing model to examine the evolution of ruts and the impacts thereof. We found that: (1) the relationship between measures of rut incision and time since grading was nonlinear at both sites for all seasons with sufficient data; (2) as ruts developed, the flow pathways on the road surface were altered; (3) the relative transport potential of the road surfaces increased overall as ruts developed; and (4) drainage system metrics reveal a threshold rut incision depth for increased transport potential and flow network change. Our results demonstrate that a great deal of useful information can be extracted by using SfM DEMs for the analysis of rut evolution. Additionally, our results allow us to examine how rutting may affect the utilisation of erosion control treatments in roadside ditch lines and the sediment yield of the road surface.
1 Introduction
Understanding flow pathways on unpaved forest road surfaces is critical for determining erosion from the road surface, how common treatments can be used to mitigate the erosion, and how much risk of downslope erosion and gullying exists. Heavy truck traffic can substantially reroute surface runoff on roads through entrenchment of ruts (Cambi et al. 2015; Fannin and Sigurdsson 1996), deepening the flow of water on the road surface and concentrating flow from largely impermeable road areas onto steep fillslopes. Because of their potential impacts, ruts have been noted as a concern and examined thoroughly in terms of their spatial development, mostly through cross-section analyses. However, the temporal evolution of the emergent flow network down the road surface and its consequences for flow concentration and erosion have not been examined.
Forest roads are some of the largest sources of anthropogenic sediment in nearby streams (Cissel et al. 2014; Croke et al. 2005; Croke and Hairsine 2006; Megahan and Kidd 1972; Ramos-Scharrón and LaFevor 2018; Reid and Dunne 1984; Sheridan and Noske 2007), and the development of ruts is a factor that can worsen erosion and delivery of sediment from road surfaces (Kastridis 2020). For example, roads with ruts can produce 2 to 5 times more sediment than roads without ruts (Foltz and Burroughs 1990). Ruts can also bypass or defeat the engineered design of the road drainage system, sometimes building up considerable flow depths along the road surface and discharging the water in unintended ways (Black et al. 2012; Cook Jr. and Hewlett 1979; Wemple and Jones 2003).
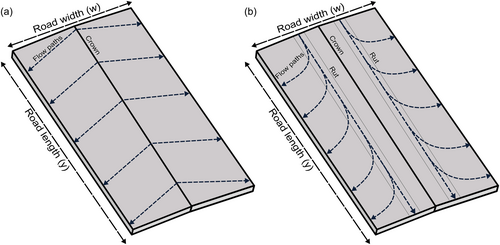
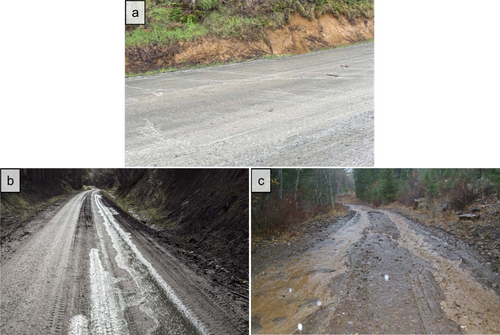
In the Pacific Northwest, USA, forest roads are commonly crowned to allow water to drain as sheetflow to either side of the road (Figure 1a; Figure 2a). Forest roads may alternatively be insloped or outsloped to allow water to drain toward an inboard ditch or over the fill slope. However, when ruts develop due to traffic, water on the road surface is instead diverted down the road surface longitudinally (Figure 1b), which has multiple implications regarding forest road erosion. One problem is that because ruts cause a greater proportion of surface runoff to flow down the road, erosion control treatments in the roadside ditch lines become less functional in removing fine sediments (e.g., Sheridan et al. 2006; Figure 2b). Additionally, ruts cause channelized flow and thus have more capacity to carry sediment due to the increased depth of flow (Foltz and Truebe 1995; Ziegler et al. 2001; Figure 2c). Further, the development of ruts can effectively increase the contributing area of surface runoff compared to the initial ditch relief design, which has impacts on sediment delivery from roads to nearby streams and the risk of the formation of gullies on fill slopes (Croke and Mockler 2001; Montgomery 1994).
The development and impact of rutting on forest roads has been the topic of study for decades. In the 1980s, ruts were denoted as a source of increased fine sediment on forest roads (e.g., Burroughs and King 1989; Reid and Dunne 1984) through their effect of increasing flow concentration and local shear stress on the road surface, with later studies looking at techniques to mitigate rutting, such as lowering tire pressure on logging trucks or more frequent road maintenance (e.g., Bradley 1994; Fannin and Sigurdsson 1996; Foltz and Elliot 1997; Sugden and Woods 2007). In more recent years, studies have shifted to focus on the development of rutting, specifically looking at how quickly or to what depth ruts form (e.g., Akgul et al. 2017; Nevalainen et al. 2017). In just the last few years, studies have begun to use remote sensing techniques, such as terrestrial LiDAR scanning (TLS) or photogrammetry techniques (e.g., Cao et al. 2021; Yurtseven et al. 2019), rather than more traditional physical measurements (e.g., Fannin and Sigurdsson 1996; Foltz 1994).
Most studies evaluating ruts are either carried out on recently built roads or roads with soft soils where ruts develop deep and fast (e.g., Fannin and Sigurdsson 1996; Toman and Skaugset 2011) or on non-mainline roads such as skid trails or forest soils for logging operations (e.g., Cambi et al. 2015; Machuga et al. 2023; Uusitalo et al. 2020; Venanzi et al. 2023), with a focus on trafficability. Other studies have been carried out on more established mainline forest roads, and their focus is typically on the advancement of data collection methods (e.g., Aydin et al. 2019; Dobson et al. 2014; El Issaoui et al. 2021; Hrůza et al. 2018; Türk et al. 2022). Additionally, earlier studies use cross-sectional analyses to examine the magnitude (i.e., depth) of ruts (e.g., Fannin and Sigurdsson 1996; Foltz 1994), but such techniques offer no information regarding flow pathways on the road surface.
Although rut formation is a critical process that directly relates to increased forest road erosion (Foltz and Burroughs 1990), our understanding of rates and mechanisms of rut formation is mainly conceptual. This limitation largely stems from a lack of detailed spatiotemporal data that can be used to study the dynamic evolution of road surfaces and rut formation in relation to traffic and rainfall factors as well as runoff erosiontraffic feedbacks. Further information regarding rut formation and the alteration of flow pathways is important to plan for unpaved forest road maintenance to reduce fine sediment yields and assess the effectiveness of roadside ditch lines in trapping sediment.
- What are the temporal trends of rut formation on mainline logging roads?
- How does rut evolution affect road surface flow pathways?
- How do ruts affect the transport potential of the road surface?
We first discuss the field study area and data acquisition methods, followed by the creation of DEMs, and analyses of the elevation change, drainage system, and transport potential. The analyses of the drainage system and transport potential yield drainage metrics, —a centre of mass drainage metric—and —a relative rut drainage metric, and a relative transport potential metric, , respectively. We present our results and finish with a discussion of the implications of this work.
2 Methods and Data
2.1 Field Study Area
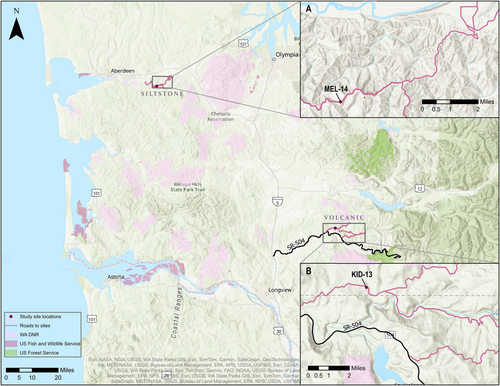
We carried out UAV and TLS surveys in two regions of southwest Washington state: (1) a volcanic lithology near Mount Saint Helens and (2) a siltstone lithology near Aberdeen, WA (Figure 3). Each region contains multiple field sites located on mainline logging roads as part of a broad study conducted by the Cooperative Monitoring Evaluation and Research Committee within the Washington Department of Natural Resources Adaptive Management Program. One field site in each of the aforementioned regions was chosen for the UAV SfM and TLS surveys (KID-13 in the volcanic lithology and MEL-14 in the siltstone lithology). The field sites are relatively straight 80-m segments of road delineated by 4.572-m water bars placed at the top and bottom thereof to help drain the road surface to the roadside ditch line. KID-13 has an average gradient of 6% and is located approximately 278 m above sea level. MEL-14 has an average gradient of 10% and is located approximately 185 m above sea level. From our broader study, we obtained preliminary traffic count data for October 2021 to April 2022 at MEL-14 and November 2021 to June 2022 at KID-13. Over their respective durations, MEL-14 received heavy traffic (on average, 7 trucks per day), where heavy traffic is defined as five or more logging truck passes per day (Reid 1981), and KID-13 received light traffic, where light traffic is defined as no logging trucks but some light vehicles (Reid 1981). On average, KID-13 receives 1560 mm of annual precipitation, and MEL-14 receives 2400 mm of annual precipitation (PRISM Climate Group 2023), with most of the precipitation occurring between October and April.
2.2 Data Acquisition
UAV and TLS surveys were conducted over three subsequent seasons (wet, dry, wet) between November 2020 and June 2022 (Table 1). At the beginning of the first wet season (wet season year 1, Wet1), each site had a layer of aggregate added to the surface and was graded. The aggregate added to each of the road surfaces was deemed good quality (more resistant to crushing) by local land managers. However, further testing of the road aggregates demonstrated that the quality of the aggregate applied at MEL-14 was much lower than that applied at KID-13, with dimensionless degradation resistance scores (Minor 1960) of 5 and 66 out of 100, respectively. Note that nine nearby rock pits (sources of road aggregate for these areas) had aggregates with degradation resistance scores ranging from 2 to 84, with a median of 60 and a mean of 45.
| Site | Season | Date of survey | Type of survey | Time since baseline (months) |
|---|---|---|---|---|
| KID-13 | Wet season year 1 (Wet1) | 11/09/2020 | UAV; TLS | 0 |
| 02/08/2021 | UAV | 3 | ||
| 04/06/2021 | UAV | 5 | ||
| 05/13/2021 | UAV; TLS | 6 | ||
| Dry season year 1 (Dry1) | 06/04/2021 | UAV; TLS | 0 | |
| 08/19/2021 | UAV | 2.5 | ||
| 09/13/2021 | UAV; TLS | 3.5 | ||
| Wet season year 2 (Wet2) | 10/07/2021 | UAV; TLS | 0 | |
| 02/08/2022 | UAV | 4 | ||
| 05/03/2022 | UAV | 7 | ||
| 05/31/2022 | UAV; TLS | 8 | ||
| MEL-14 | Wet1 | 12/03/2020 | UAV; TLS | 0 |
| 02/24/2021 | UAV | 2.5 | ||
| 04/12/2021* | UAV* | 4.5* | ||
| Dry1 | 06/03/2021 | UAV; TLS | 0 | |
| 09/14/2021 | UAV; TLS | 3.5 | ||
| Wet2 | 03/09/2022 | UAV; TLS | 0 | |
| 03/16/2022 | UAV | 0.25 | ||
| 03/24/2022 | UAV | 0.5 | ||
| 04/11/2022 | UAV | 1 | ||
| 04/28/2022 | UAV | 1.75 | ||
| 06/01/2022 | UAV; TLS | 3 |
- * This survey was rendered unusable due to unforeseen interim roadwork.
Subsequent seasons (dry season year 1, Dry1; wet season year 2, Wet2) began once the road segments were regraded. At KID-13, all three seasons of surveys consisted of longer time periods between surveys (i.e., a range of 1–4 months between surveys) to look at the longer-term temporal trends and effects of rut development on a road segment. At MEL-14, the first two seasons consisted of longer time periods between surveys, whereas the final season consisted of more frequent surveys (i.e., a range of 1–5 weeks between surveys) to examine the shorter-term temporal trends of rut development on a road segment. MEL-14 was chosen for the more frequent surveys due to the higher amount of traffic the site received, as compared to KID-13.
For ground-truthing of the UAV surveys and to align and coregister surveys at different time slices, 24 ground control points (GCP) were installed at each site. These ground control points were 10-inch nails hammered in along the sides of the road segments—12 on each side—and spray painted for extra visibility. The spatial coverage of GCPs was limited to the sides of the road segment as we could not guarantee the safety of traffic nor the stability of the GCPs if they were placed in the road prism itself. Two additional ground-truthing points were installed off the road at each site for TLS survey use.
The locations of the GCPs were measured in an arbitrary coordinate system at the beginning and end of a season using a Trimble SX10 Scanning Total Station to ensure that the GCPs had not migrated. At KID-13, the variation in repeat survey GCP locations was small (on average, less than 1 mm) and was assumed to be random error. As such, the mean survey location for each GCP was used for data processing at KID-13. At MEL-14, multiple GCPs were ripped out between seasons during grading, so the GCPs had to be reset at the beginning of each season. As such, locations recorded at the beginning of each season were used for data processing at MEL-14.
To map rut formation on these road segments, UAV and TLS surveys were conducted in tandem. Multiple UAV surveys were conducted within each season, as mentioned above, whereas the TLS surveys were conducted only at the beginning and end of each season (Table 1). The main goal was to use UAV SfM for analysis, with the initial TLS survey for each season serving as a reference baseline dataset, due to TLS inherently providing validated data (e.g., Wilkinson et al. 2016). The TLS surveys used a Trimble SX10 Scanning Total Station and required three locations for scanning the full road surface. Each TLS survey yielded high-resolution point cloud data.
The UAV SfM surveys were carried out with a Phantom 4 Pro DJI drone with an RC controller, and all flights were done manually due to high tree cover and lack of good global navigation satellite system (GNSS) lock. Each UAV survey consisted of three flights: (1) lower flight elevation (~5 m above ground level) up and down the road segment with the camera nadir; (2) lower flight elevation (~5 m agl) around the road segment with the camera at an angle; and (3) higher flight elevation (~10–15 m agl) up the road segment with the camera nadir. The UAV SfM surveys collected high-overlap, high-resolution photographs to be processed using photogrammetric techniques.
2.3 TLS and UAV DEM Post-Processing
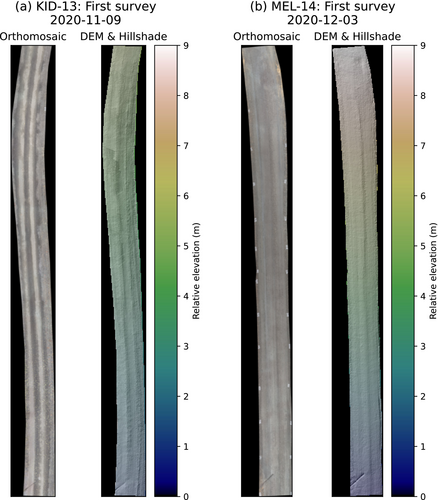
Post-processing of TLS and UAV data was done using CloudCompare and Pix4DMapper, respectively. The TLS data were processed such that the DEMs of the road surface had 1 cm resolution in an arbitrary coordinate system. To process the UAV data and ensure accurate representation of the road surface, we manually selected high-precision GCP locations collected at each site. The data products of the UAV data post-processing included high-resolution orthoimages and UAV-derived DEMs with 1 cm resolution in an arbitrary coordinate system (Figure 4).
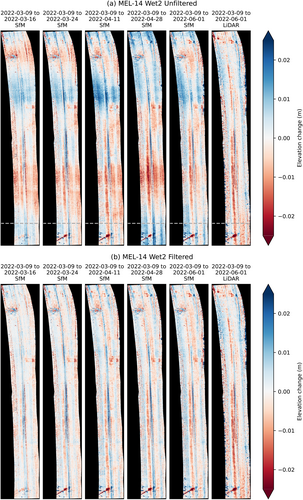
To analyse the development of wheel ruts over time, DEMs were reprojected on a common grid and subtracted from one another. The initial TLS-derived (LiDAR) DEM for each season was used as a reference dataset to coregister all UAV-derived (SfM) DEMs. Following co-registration, the SfM DEMs were subtracted from the baseline SfM survey of each season (Figure 5). The season-spanning LiDAR DEM difference maps were also examined for additional validation (Figure 5, far right panel). Initial difference maps of the SfM DEMs showed systematic error in the form of a longitudinal undulation pattern—the alternating darker blue and darker red swaths seen in Figure 5a. The longitudinal undulation artifacts seen in the SfM datasets are likely introduced during the initial alignment and camera model optimisation step of data processing and create errors that can propagate to subsequent analysis steps (Tarekegn and Sayama 2013). These artifacts likely arose from the SfM survey geometry (i.e., very low altitude flights due to canopy; e.g., Mueller et al. 2023). Here we utilised a high-pass Gaussian filter, which is a common signal-processing technique used to remove undulation artifacts through attenuating low-frequency waveforms such that only the high-frequency waveforms (i.e., the elevation change signals) remain (Figure 5b).
2.4 UAV DEM Elevation Change Analysis
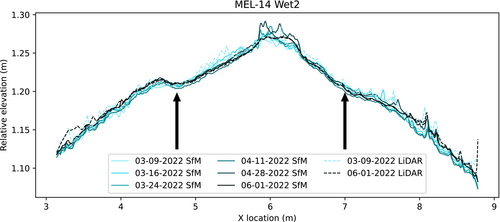
One potential method to examine the depth of wheel ruts is to look at cross-sectional profiles of the road surface at different longitudinal locations, such as in Fannin and Sigurdsson (1996). While the cross-sectional profiles do show the development of ruts (e.g., Figure 6), this method is insufficient and problematic for analysing the surveys for several reasons. The vertical scale of ruts developing on the survey segments is small and highly variable along the longitudinal axis of the road (i.e., different cross sections have different rut magnitudes and shapes). This variation precludes a succinct description of road surface behaviour with respect to rut development using cross sections alone. Additionally, the artificial longitudinal undulation pattern seen in Figure 5a is present in the cross-sectional profiles: while the profile of 03-09-2022 is expected to be the highest elevation, the profiles of 03-16-2022 and 04-28-2022 instead plot above 03-09-2022 (Figure 6). Lastly, cross-sectional analysis does not take advantage of the entire high-resolution data.
To examine how the entire road surface evolves over time, we used the filtered differenced DEMs to determine the empirical cumulative distribution functions (eCDFs) of elevation change across the full domain (Figure 7). For shorter survey time periods, the eCDF has a smaller variance, indicating minimal change to the road surface. Longer survey time periods, however, have a larger variance, indicating that the micro-topography of the road surface has become more heterogeneous.
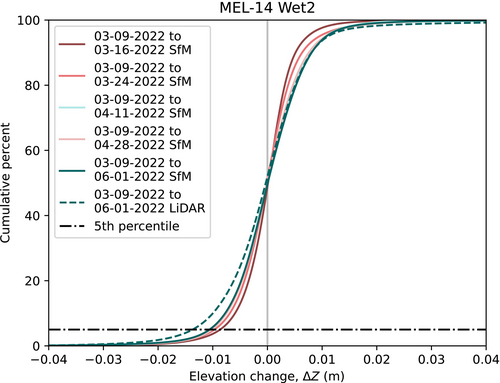
Though the longitudinal undulation pattern artifact was removed with the high-pass Gaussian filter, other artifacts and random errors (i.e., noise) are still present in the differenced SfM DEMs. To avoid these artifacts and errors—which exist on the extreme ends of the eCDFs of elevation change—we used the 5th percentile of the eCDF of elevation change as a measure for rut incision of a given time period since road grading in wet and dry seasons. The 5th percentile was chosen to represent rut incision as ruts tend to constitute the largest incisions in elevation change data and their depths are more uniform than rills caused by overland flow. As such, the cumulative rut incision depth over a given season is assumed to be the 5th percentile of elevation change for the final survey of the season.
2.5 Drainage System Analysis
To examine the impacts of rutting on road surface flow pathways, we routed flow on the SfM and LiDAR DEMs using Landlab, a Python toolkit for modelling earth surface processes (Barnhart et al. 2020; Hobley et al. 2017). The raw SfM and LiDAR DEMs were resampled from 0.01 to 0.25 m resolution to attenuate excess noise, to smooth other potential artifacts, and because the scale of rut width is similar in size. Using a D8 flow routing algorithm, we routed runoff to the nodes of the survey grids. Each model run resulted in maps of the drainage system on the road surface (Figure 8).
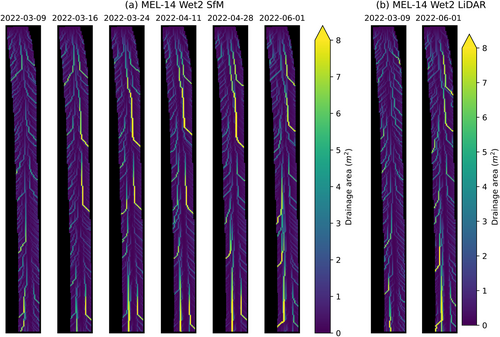
As discussed in Section 2.1, a water bar is located near the bottom of each site's road segment. Without the presence of these water bars, water heading down the road in a rut would continue down the road. Therefore, we consider the water bar flow as part of the lowest boundary drainage (y = 0), rather than side boundary drainage, for the following analyses. Note that these water bars were not always empty of sediment buildup during a given UAV survey and therefore did not always have water draining through them.
We used the derived drainage areas for each survey to analyse the geomorphic outcome of rut incision (i.e., how wheel ruts evolve the drainage pattern of the road surface). To do so, we calculated the centre of mass of the drainage areas at the edges of the road surface. This centre of mass for drainage areas is calculated by determining the average longitudinal location at which water leaves the road surface, weighted by drainage area at the edge of each longitudinal location. This centre of mass of drainage areas at the edges of the road surface allows us to quantify the down-road shift due to rutting (see Section 1).
To convert the centre of mass values from an arbitrary coordinate system, we normalised both and by the total length of road. These normalised values are dimensionless and on a scale of 0 to 1. was then compared to to give an approximation of the effect of ruts on the road flow pathways (i.e., downwards shift due to rutting; Figure 1b).
2.6 Transport Potential Analysis
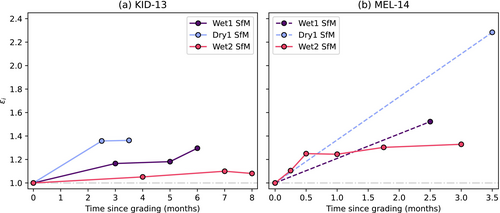
This normalised index allows us to document the relative effects of ruts on the transport potential of the road surface over time. A normalised index greater than 1 indicates an increase in sediment transport potential as compared to the initial time period, and a normalised index less than 1 indicates a decrease. Note that, due to the normalisation of this index, changes in surface flow and have negligible effects on the resulting value.
3 Results
3.1 Temporal Evolution of Rutting
To address the first question of temporal trends of rutting on these mainline logging roads, we looked at elevation change data from three seasons at both KID-13 and MEL-14. The 5th percentile from the eCDFs of elevation change shows how the measure of cumulative rut incision changes over time (Figure 9).
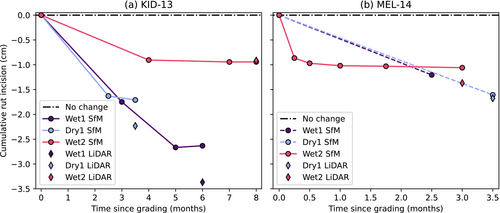
We plotted the 5th percentile of elevation change in centimetres (i.e., the cumulative rut incision) with respect to time since grading in months. The measures of cumulative rut incisions (i.e., final data points) are variable across seasons and sites, falling between approximately 1.0 and 2.5 cm for the SfM DEMs. At KID-13, the largest cumulative rut incision for SfM (2.5 cm) occurs during Wet1. With subsequent seasons, the cumulative incision of rutting decreases (i.e., a “shallowing” of rutting). At MEL-14, the largest cumulative rut incision for SfM occurs during Dry1 with a depth of 1.6 cm. Unlike at KID-13, however, MEL-14 shows no discernible pattern between subsequent seasons. The lack of a similar pattern is likely due to the fact that only two surveys were usable for Wet1. Interim road grading was carried out without our knowledge between 02/24/2021 and 04/12/2021, which led to 04/12/2021 being an unusable survey for our analyses. For most of the seasons, the measures of cumulative rut incisions for the LiDAR DEMs are deeper than those of the SfM DEMs (Figure 9, Table S1).
In terms of temporal trends, KID-13 demonstrates that cumulative rut incision has a nonlinear relationship with time since grading during all three seasons, with Wet2 showing the rut depth approximately approaching an asymptote of the deepest cumulative rut incision for that season. At MEL-14, a similar nonlinear relationship emerges between cumulative rut incision and time since grading for Wet2, which is the only season for which we have sufficient data at that site.
Note that the time since grading generally differs between field sites. The time between surveys at KID-13 was overall longer than that of MEL-14, which was intentional, specifically for Wet2 at MEL-14. Rut development tended to occur quickly on these roads, and we wanted to capture a finer temporal resolution at one of the field sites.
3.2 Metrics of the Drainage System
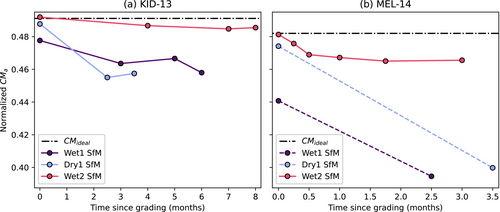
The temporal trends of rutting are important, but the implications are just as interesting: if ruts are present, what happens to the flow pathways on the road surface and how does that impact the drainage of the system? The capacity to measure this is a key advantage of aerial surveys over cross sections alone. To answer this question, we examined the results of the drainage area centre of mass analysis discussed in Section 2.5. Specifically, we looked at where the centre of mass of an idealised surface is located as compared to the rutted road surfaces and examined the fraction of the road surface area that is draining through the lowest boundary of the road segment.
For the idealised road surfaces at KID-13 and MEL-14, the normalised values of are located at 0.491 and 0.482, respectively. For all end-of-season surveys at both KID-13 and MEL-14, the normalised values of for SfM data fall below the normalised values of (Figure 10), indicating a down-road shift due to rutting. The magnitude of the downward shift at KID-13 is less than that of MEL-14. The LiDAR data demonstrated similar patterns, with all normalised values of trending down-road, indicating a shift due to the cumulative effects of rutting (Table S1).
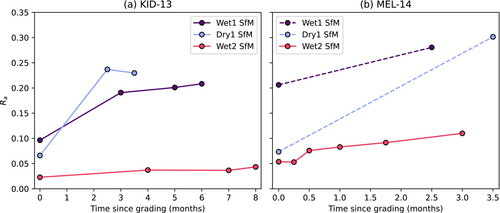
While the centre of mass analysis utilised the drainage areas along all edges of the road surface, we were also interested in determining how much of the road surface contributed to only the lowest boundary. To show that, we plotted the fraction of the total drainage area leaving the road through the bottom edge and included any drainage area exiting the plot through the lower water bar (see Section 2.5 for explanation). As ruts developed, the fraction of road surface draining through the lowest boundary of the road segment increased, with maximum fractions at KID-13 and MEL-14 for SfM data being around 0.25 and 0.30, respectively (Figure 11). The LiDAR data showed somewhat similar maximum fractions of around 0.20 for both KID-13 and MEL-14 (Table S1). For less pronounced rut incisions (i.e., Wet2 at both sites), this fraction is the smallest.
3.3 Transport Potential of the Road Surface
To address our final question, we wanted to examine how rutting and drainage areas relate to erosion, since erosion is a key concern for forest roads. The evaluation of the normalised index of potential transport, , yielded similar patterns of results at each site (Figure 12). KID-13 (Figure 12a) presented net increases in relative transport potential for all seasons with some variation. MEL-14 (Figure 12b) also demonstrated behaviour that is consistent with the expectation that rutting can cause an increase in transport and overall exhibited higher relative transport potentials for all seasons. At their maxima, KID-13 saw a 35% increase in transport potential and MEL-14 saw a 120% increase in transport potential for the SfM data, while the LiDAR data provided a maximum of approximately 70% increase in transport potential at KID-13 and 65% increase in transport potential at MEL-14 (Table S1). The LiDAR data showed overall increases in transport potential for all seasons (Table S1).
3.4 State Space Relationships
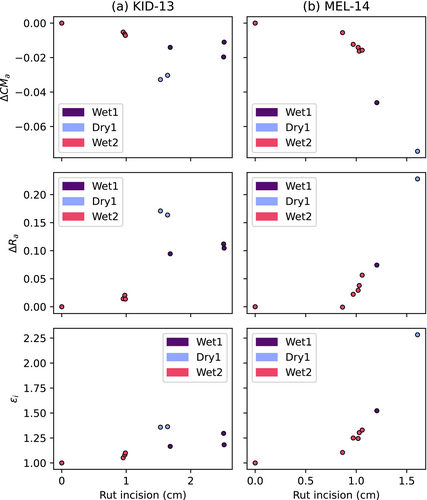
To further examine the relationship between rut incision, road surface flow pathways, and road surface transport potential, we removed the explicit time dependency and looked at the state space of these metrics. For each pair of metrics at each site, a threshold behaviour emerges where, after reaching a rut incision of greater than approximately 0.75 cm, the data begin to exhibit changing hydraulic outcomes (Figure 13). KID-13 (Figure 13a) demonstrates slightly more variable relationships than MEL-14 (Figure 13b).
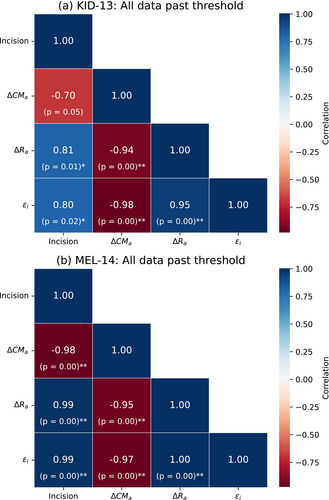
In addition to examining each of the metrics against rut incision, we also examined the metrics against one another using a correlation matrix where we dropped the initial value such that we only analysed the data past the 0.75 cm incision threshold (which emerged in Figure 13). Overall, the metrics are largely correlated to one another, with further confirmation that KID-13 (Figure 14a) has slightly more variable relationships than MEL-14 (Figure 14b). This examination demonstrates that, because these metrics are tightly correlated, any of these metrics (including incision) is a good index of the impacts on the system.
4 Discussion
The measure of cumulative rut incision depth for the SfM DEMs over the duration of a given survey season at both sites varied between approximately 1.0 and 2.5 cm (Figure 9). The magnitude of these depths is not as large when compared to other studies (e.g., Fannin and Sigurdsson 1996; Machuga et al. 2023; Marra et al. 2018), but those studies were carried out on roads built in softer soils (sometimes with the intention of evaluating methods to control rutting in soft soils) or on non-mainline roads. On well-established mainline logging roads like these study sites, however, rut development appears to be less severe, probably because the subgrade of the road has been well compacted by years of traffic.
At KID-13, all three seasons demonstrated a “slower” nonlinear relationship between cumulative rut incision and time since grading than that of Wet2 at MEL-14 (Figure 9). This slower rate of rutting at KID-13 could be attributed to several factors: (a) The difference of longitudinal slopes at each site: MEL-14 is steeper than KID-13. (b) Differences in traffic level at each of the sites: MEL-14 had, on average, more traffic than KID-13. (c) Variations in annual precipitation: MEL-14 receives more annual precipitation than KID-13. (d) Differences in aggregate quality: The aggregate used at MEL-14 had a lower degradation resistance score compared to that at KID-13. However, determining the causality of differences in rates of rutting at these sites is difficult with a sample size of n = 2 and a lack of controls required to investigate each of these individually. Further studies with a larger sample size are warranted.
The exponential decrease and subsequent asymptotic approach of the cumulative rut incision depth seen in a season is due to a feedback loop created by erosion processes and traffic. While traffic and rainfall/channelized flow both contribute to the development and persistence of ruts, the expected continuing incision is negated by traffic serving as a stochastic variable that “smooths” the ruts and the large amount of compaction occurring (Alvis et al. 2023). Additionally, at KID-13 (and, to an extent, MEL-14), we see a “shallowing” of rut incisions with subsequent survey seasons (Figure 9), which is likely due to the fact that, while the road was graded between seasons, no additional rock was added. The road hardened over time, likely due to the removal of excess fine sediments via “pumping” (Alvis et al. 2023) and rainfall, as well as additional compaction from traffic.
While the measures of rut depth magnitudes are relatively small, their impact is still noticeable. Both the centre of mass analysis and lowest boundary contribution analysis demonstrate the effects of ruts on road surface flow pathways. In an idealised situation, no ruts would exist, and flow would be directed off the road surface to either side as sheet flow (e.g., Figures 1a and 2a). With the development of ruts, the flow is directed longitudinally down the road before being directed off to the sides or is not directed off to the sides and instead continues out of the lowest boundary of the road segment (e.g., Figures 1b and 2b,c). Essentially, the net vector of flow direction shifts down slope. Almost all surveys for both KID-13 and MEL-14 demonstrate this downward shift, even the initial surveys for each season (Figure 10, Figure 11). The initial surveys were all carried out as soon as possible after grading the road surface. On average, the surveys occurred the day of or day after grading. The first survey at KID-13, however, was an exception, with the survey occurring 1 week after grading due to weather. Regardless, in most instances, rut development was in its beginning stages at the time of the first survey due to traffic running over the road surface and resulted in a down-road shift in the centre of mass.
The centre of mass metric, , not only tells us the shift of the average location at which water leaves the road surface, it also gives us an approximation of ditch line erosion control treatment effectiveness. Flow that is directed down the road instead of into the roadside ditch does not utilise erosion control treatments present therein. Erosion control treatments in roadside ditch lines have been shown to be largely effective (e.g., Aust et al. 2015; Burroughs et al. 1984; Luce and Black 1999; Megahan et al. 2001). However, if flow is not travelling in the ditch, erosion control treatments are unable to aid in sediment transport reduction. With the down-road shift of flow pathways due to rutting, erosion control treatments in the ditch have less effectiveness potential as less of the ditch is utilised, as demonstrated in the results in Section 3.2 (Figure 10, Figure 11).
While already indicative of the effects of rutting on flow pathways, the flow pathway analyses carried out here likely underestimate these effects because the road segment was necessarily bounded. Water that is exiting through the bottom of the road in a rut would likely continue travelling down the road, thus would not flow off the side of the road until farther downslope. This would lead to an even larger down-road shift if this analysis were carried out on an unbounded road.
Flow that is channelised on the road surface due to rutting has a larger capacity for transport than that of diffuse sheet flow (e.g., Burroughs and King 1989; Foltz and Burroughs 1990). Evidence of a net increase in transport potential as rut incision increases is seen in the results for both KID-13 and MEL-14 (Figure 12), with MEL-14 having much larger increases. Again, the causality of this larger increase is difficult to parse but could be due to the fact that the slope of MEL-14 is larger than that of KID-13. Another important piece to note is that the model of shear stress used for our calculations is formulated for shallow overland flow. This assumption does not necessarily hold for the ruts and rills on the road surface. In other words, we assumed that the sides of the ruts and rills on the road surface had no impact on the shear stress, when, in reality, an impact was likely present. If we included a more sophisticated rill hydraulics model, we would possibly have predicted more transport potential both overall and, more specifically, at KID-13.
The examination of the state space relationships demonstrated the explicit dependence of each of the metrics on rut incision (Figures 13 and 14), and the close relationship of the metrics to each other. On average, KID-13 had more variable relationships than MEL-14, which is potentially due to differences in road slopes, rainfall, aggregate quality, and traffic levels, but additional surveys at more locations would be required to determine specifics. Regardless, because of the overall threshold behaviour and high correlations between each of the metrics and rut incision, we can make inferences regarding the hydraulic outcomes on the forest road surface. Rut incisions greater than 0.75 cm cause distinguishable changes with respect to flow pathways, which have correlated implications for the utility of ditch line erosion control treatments and on the potential for increased transport, as discussed previously.
All told, the results of our analyses emphasise the importance of road maintenance on a regular basis. Ruts are quick to develop, especially if a new layer of aggregate is added to the road surface, but frequent grading can minimise the impacts of these ruts with respect to flow pathway alteration. However, road maintenance can also produce higher sediment yields shortly thereafter (Luce and Black 2001; Megahan 1974; Ramos-Scharrón et al. 2024; Ramos-Scharrón and Macdonald 2005). As such, further work could be conducted to determine the relative increase in sediment yields due to rutting as compared to the increase in sediment yields due to road maintenance.
5 Conclusion
- the relationship between rut incision and time since grading is nonlinear at both sites for all seasons with sufficient data, with MEL-14 having a generally quicker rate of rutting than that of KID-13;
- as ruts develop, the overall flow pathways shift down-road, causing more flow to exit the study plots through ruts rather than in ditches as ruts evolve and deepen. This has implications for how much of the erosion control treatments in the roadside ditch lines are utilised;
- the transport potential of the road surfaces tended to increase overall as ruts developed, with KID-13 seeing a maximum increase of 35% and MEL-14 seeing a maximum increase of 120%; and
- drainage system metrics reveal threshold rut incision depth for increased transport potential and flow network change.
Our findings will have practical and theoretical implications for future road surface sediment management and spatially distributed erosion modelling.
Acknowledgements
The authors thank Julie Dieu for coordination with landowners to ensure that the field sites remained undisturbed by maintenance activities and Teresa Miskovic and Alexander Prescott for providing other logistical support.
Conflicts of Interest
The authors declare no conflicts of interest.
Open Research
Data Availability Statement
The data presented in this manuscript are not currently publicly available due to an agreement with the Cooperative Monitoring, Evaluation, and Research (CMER) Committee within the Washington State Department of Natural Resources Adaptive Management Program but are available from the corresponding author upon reasonable request and approval from CMER. Additionally, the data will be made publicly available in the future upon completion of the overarching project and CMER's approval of the final report.


