Modelling of Total Phosphorus and Nitrate Using a Travel Time Approach in the Duck River Catchment, Australia
Funding: The authors received no specific funding for this work.
ABSTRACT
Total phosphorus (TP) and nitrate are important non-conservative contaminants of streams. They vary strongly in response to climatic, hydrologic, and other drivers and are affected by different flow paths. Water residence and travel time distributions carrying information about sources of streamflow can potentially provide a basis for modelling nitrate and TP dynamics. In this study, we use a travel time model coupled with age—concentration relationships to simulate nitrate and TP concentrations in the Duck River catchment, NW Tasmania, Australia. A modified version of the Tran-SAS model was used with time-varying beta storage selection functions, calibrated against high-frequency electrical conductivity (EC) observations. Concentrations of TP and nitrate were then modelled using the water TTDs coupled with age-concentration relationships for TP and nitrate. This approach separated biogeochemical effects from water travel time and ensured consistent TTDs underpinning the transport of different nutrients. Two years (2008 and 2009 water years) of high-frequency nutrient concentrations were used for model calibration and validation. It was initially hypothesised that the age-concentration relationships for nitrate and TP could be temporally fixed, with the seasonal variation in residence time distribution capturing any seasonality in nutrient behaviour. The models performed moderately under this hypothesis; however, residual analysis clearly demonstrated seasonal declines in the concentrations of TP and nitrate during events across the high flow season. Simulations of TP and nitrate were markedly improved by using different source concentrations: one for the early high flow season and the other for the remainder of the year. Both Nash-Sutcliffe Efficiency and the combined seasonal and event dynamics of nitrate and TP were markedly improved by using different source concentrations for these two different periods. This suggests that land management and biogeochemical processing are important influences on the temporal dynamics of nutrients in streams. The study informs future developments of TTD-based water quality modelling and demonstrates the need to include temporally dynamic nutrient source concentrations for young water.
1 Introduction
Agricultural land is known as a major source of phosphorus (Schindler et al. 2012; Watson et al. 2016; Van Meter et al. 2021) and nitrate (Alvarez- Cobelas et al. 2008; Dupas et al. 2017; Bahrami et al. 2020; Merchán et al. 2020) transported to water bodies, where they threaten stream ecosystems and human health. This influence on water quality, and on the costs imposed on water treatment (Sharpley et al. 2003; Smith and Schindler 2009; Watson et al. 2016) highlights the urgent need for catchment managers to address nutrient pollution. Water quality modelling is an important tool for such management (Chen et al. 2018; Dong et al. 2018; Lintern et al. 2018).
Solutes start their travel from either point or non-point sources, and their transport is controlled by land cover, land use, land management, catchment hydrology, geology, and soil type. Biogeochemical processes are also important in the case of reactive solutes like nitrogen and phosphorus, which are usually added to the soil as a fertiliser. The temporal dynamics of nitrogen and phosphorus and their transfer through catchments have been studied extensively in the literature (Lintern et al. 2018; Saadat et al. 2018; Guo et al. 2019; Kincaid et al. 2020; Casquin et al. 2021). Overall, their transport is influenced by their interrelation with the soil matrix and hydrological conditions (precipitation and temperature), which control the pathways and rates of release to the catchment outlet.
Hrachowitz et al. (2016) review the conceptual understanding of the links between hydrological processes and water quality processes. They note the differences between timescales involved in flow response (celerity) and transport (advection), which have been known for some time (Kirchner 2003), and emphasise the importance of integrating the hydrologic and transport timescales in predicting water quality responses over time. They also make the case that most existing water quality models either ignore or poorly capture these important differences between flow and transport responses. Motivated by these issues, hydrologic travel time modelling has been advancing in recent years and is seen as a means of achieving this integration. Catchment travel time modelling to date has tended to concentrate on water travel times and has used stable isotopes, chloride, or tritium as a tracer (Kirchner et al. 2010; Benettin et al. 2013; Benettin, Kirchner, et al. 2015; Harman 2015; Duvert et al. 2016), while a few studies have considered other solutes such as nitrate (Van Der Velde et al. 2010; Benettin et al. 2020; Yang et al. 2021).
Before further discussing the links between travel time and water quality, it is important to briefly define what we mean by travel time. This has been discussed in detail in various papers (McDonnell et al. 2010; Botter et al. 2011; Benettin, Rinaldo, et al. 2015; Rinaldo et al. 2015). The “travel time” (aka transit time) distribution has been defined relative to either a fixed injection time into a system (forward travel time distribution) or a fixed exit time from a system (backward travel time distribution). Forward travel time distributions characterise life expectancy and the breakthrough curve of water/tracer particles instantaneously injected into a system. The backward travel time distribution is the distribution of ages for water exiting from the system (Benettin, Rinaldo, et al. 2015; Harman 2015). Both the forwards and backwards travel time distributions change dynamically due to changing storage and flow conditions in the catchment. These two concepts can be applied to either discharge or evapotranspiration (Botter et al. 2010; Botter et al. 2011; Rinaldo et al. 2011; Botter 2012). In considering stream water quality, most often we are interested in the condition of water in the stream at a point (or points) in time (maybe when we've sampled the stream) and hence we are mainly concerned with backward travel time. In this paper, unless explicitly noted, we are referring to backward travel time.
Implicit in arguing that water travel time (advective transport time) is important in stream water quality responses is the idea that pathways with different travel times for water also have different concentrations of various water quality constituents. These differences relate to varied biogeochemical processes influencing each solute's behaviour. The notion of the double paradox (Kirchner 2003), which encompasses (1) the observed rapid mobilisation of “old” water during runoff events and (2) the observed rapid variability of the chemistry of (“old”) stream water over an event, highlights the significance of catchment functioning in retaining and releasing the solutes. The “old” water in the double paradox simply refers to water that was already present in the catchment prior to event-generating rainfall. In reality, the “old” water has a distribution of ages, and there is also a continuum of solute response times (Kirchner et al. 2000). Furthermore, the age distribution, particularly the younger water fractions, varies markedly over time as flow changes and is a strong control on solute behaviour (Kirchner et al. 2000; Jasechko et al. 2016; Kirchner 2016; Benettin, Bailey, et al. 2017; Von Freyberg et al. 2018).
Understanding water quality response is not simply a matter of understanding water travel time but also of understanding the differing concentrations of pathways with different travel times. While the ideal conservative water tracer travels with the water (is part of the water) and thus is controlled purely by the dynamics of the age distribution, this will not be the case for non-conservative constituents. For example, there are some important differences in the transport of nitrogen and phosphorus linked to flow paths. Phosphate is adsorbed by soil particles and tends to remain near the soil surface. It is mainly transported through surface flow paths (Holtan et al. 1988). Surface flow paths are generally expected to have short travel times. In comparison, nitrate has higher mobility in the vadose and saturated zones due to its higher solubility and limited interaction with soil particles (Arauzo et al. 2022). These deeper pathways have moderate to long travel times, and longer travel times are associated with more denitrification, at least in some circumstances (Benettin et al. 2020). Hence, while the travel time distribution at a sampling station at a point in time is the same for any constituent in the water sample (i.e., it is the same water), the concentration behaviour varies between different constituents because of the differing importance (in essence concentration) of each different pathway.
The above discussion implies inter-relationships between flow pathway, age (backwards travel time) and concentration. In conceptualising the approach we take in this paper, we implicitly assume that (i) the temporal variation in travel time for a given pathway is much smaller than the variation in travel time between the population of flow pathways contributing water to the stream; (ii) the temporal variation in solute concentration for a given pathway is much smaller than the variation in concentration between flow pathways; and (iii) variations in the proportional contribution of water from different pathways are sufficiently large to control the temporal dynamics of stream water age and concentration. This enables us to build a relatively simple conceptual model of water quality where the hydrologic nexus between pathway and age is captured by a water travel time model and the variation in solute concentrations between water of different ages (as a surrogate for pathways) is subsequently captured by a solute specific relationship between water age and concentration. The following argues the case for relatively simple integrated hydrologic and water quality models and overviews the body of literature related to transit time-based water quality models.
The complexity of microscopic processes that are active during nutrient transport, the variety of mechanisms involved in runoff generation and ubiquitous spatial heterogeneities argue for the applicability of simple approaches to transport modelling such as the travel time distribution-based approaches that focus on the dominant modes of catchment behaviour (Rinaldo and Marani 1987). While not the only possible approach, this is the approach explored here. Specifically we aim to extend an existing model of water transit time conditioned using electrical conductivity (Riazi et al. 2022) to simulated total phosphorus and nitrate dynamics in the Duck River, Tasmania, Australia. This involves connecting that transit time model to non-conservative concentration behaviour using hypothesised relationships linking water age and concentration.
The TTD approach is underpinned by a master equation (Botter et al. 2011) which incorporates the temporal variability of catchment forcing and outflows, in essence by using mass balances for each water age cohort. It has been further developed to account for dynamic catchment conditions and can represent the dynamics of TTDs at catchment scale and the associated transport of conservative tracers (Benettin et al. 2015; Benettin, Rinaldo, et al. 2015; Harman 2015; Rinaldo et al. 2015; Benettin, Kirchner, et al. 2015; Benettin and Bertuzzo 2018). Some studies have also considered non-conservative solutes such as nitrate (e.g., Van Der Velde et al. 2010).
Nitrate is the most common major non-conservative contaminant of streams (Spalding and Exner 1993; Scharf et al. 2005) and is typically related to intensive applications of inorganic fertilisers, livestock manure, and other anthropogenic nitrogen sources (McLay et al. 2001). Studies of the relationship between water TTDs and nitrate concentration have been demonstrated in some environments but are poorly understood in many others (Groffman et al. 2006; Oehler et al. 2009; Benettin et al. 2020).
Some studies, such as Van Meter and Basu (2017), have calculated lag times between inputs (long-term nitrogen input trajectories) and outputs (stream nitrate concentration) of nitrogen. Van Meter and Basu found considerable nonlinearity between nitrogen inputs and outputs, with seasonally variable lag times in a 6800 km2 catchment in Southern Ontario. The average lag time was 24.5 years. Nitrogen travel times potentially differ from water travel times for two reasons. First, a range of biogeochemical processes affects nitrogen storage, cycling, and mobility, particularly in the soil (Gruber and Galloway 2008). Second, the proportion of nitrate transport via various flow pathways is likely to be different from the proportion of water transported via those pathways because nitrate concentration will vary by pathway. Nevertheless, water flow is the transporting mechanism, and other studies have explicitly linked water travel time to nutrient travel times.
Extending the Van Meter and Basu (2017) analysis, Van Meter et al. (2017) developed the process-based Exploration of Long-tErM Nutrient Trajectories (ELEMeNT) model to simulate the storage and transport of nitrogen through subsurface flow paths at seasonal to annual timescales. This coupled the variation of nitrogen losses from the soil with a travel time-based approach for transport along subsurface pathways. Their modelling of historical (1800–2014) nitrate yields showed significant increases above baseline levels at the outlets of two major U.S. catchments largely because of the conversion of forest and grassland to row crop agriculture. The ELEMeNT model was extended to include phosphorus by Van Meter et al. (2021). They evaluated spatial accumulation of phosphorus and its contribution to streams using long-term mass balance data. The lag time for nitrogen mobilisation and transport is not necessarily the same as for water, and they did not link it explicitly to water travel times.
Links between variations in travel time and nitrate dynamics have also been demonstrated by various other authors who find very long transport times related to hydrologic delays for a fraction of the nitrogen input to catchments. Botter et al. (2008) simulated long-tail nitrate (diffuse agricultural sources) breakthrough curves at the hillslope scale using a mass response function solute transport model that incorporated stationary exponential travel time distributions. They related the behaviour of the breakthrough curve to the extent and persistence of the rainfall and background noise linked to the base flow. The long tails in the residence time distributions obtained from long concentration time series were related to the rainfall attributes and the long-term release of old water exporting solutes from the soil.
Links between water age and nitrate removal have also been examined, further reinforcing the conceptual basis of relating nitrate and water travel time. Benettin et al. (2020) applied Tran-SAS (Benettin and Bertuzzo 2018) coupled with an age-concentration relationship for chloride to simulate TTDs, which they compared with nitrate concentrations to study the relationship between nitrate peaks and the young water fraction. They show a good inverse correlation between nitrate and the young water fraction (age < 2.5 months) in streamflow. van der Velde et al. (2010) simulated nitrate transport in a small catchment and applied time-variant TTDs to the saturated zone only, assuming complete mixing and very small water travel times for surface flows. In their formulation, nitrate concentration is estimated using an exponential reduction with age representing the effects of denitrification and diffusion/mixing of the total solute mass in the saturated zone. Reinforcing these studies, a particle tracking model study by Yang et al. (2018) examining the dynamics of TTDs in discharge and subsurface mixing, found that median age and nitrate concentration were highly negatively correlated—high concentrations occurred in younger water, and vice versa.
More generally, water travel time-based models have been used successfully to simulate nitrate transport to streams, further highlighting the value of linking water travel time to water quality dynamics. Using in-stream nitrate concentration, soil nitrogen surplus, and the median age from backward TTDs, Yang et al. (2021) found that time-variant SAS functions for discharge were able to capture both event and seasonal in-stream nitrate variations. Nguyen et al. (2021) used the grid-based mHM-Nitrate model to simulate nitrogen dynamics within the soil zone and SAS functions to represent nitrate transport in the subsurface. The distributed and lumped forms of the model produced comparable results, both successfully tracking the dynamics of the nitrate concentration in the stream and its relationship with discharge. Nguyen et al. (2022) used their modified mHM-SAS model (Nguyen et al. 2021) to investigate the dynamics of nitrate transportation for a nested mesoscale catchment study (457 km2), finding less seasonality in subsurface mixing dynamics and more stable nitrate transport for lowland subcatchments dominated by agricultural uses compared with strongly seasonal headwater subcatchments with mixed forest and agricultural use.
In summary, recent studies have examined various aspects of relationships between nitrate dynamics and water age. Travel time-based models are being used to simulate catchment-scale solute transport (Yang et al. 2021). To link water TTDs with concentration, tracers are sometimes considered conservative; however, age-concentration relationships have been used with both chloride (e.g., Benettin et al. 2020) and Nitrate (e.g., Van Der Velde et al. 2010) in a few studies. For nitrate, the biogeochemical influences on source concentrations have been considered at times (e.g., Van Meter et al. 2017). Nearly all these studies have been conducted in humid catchments in Europe or north America and there is a need to examine such methods in a wider range of environments (Rinaldo et al. 2015). The one study we are aware of to combine TTDs with phosphorus transport (Van Meter et al. 2021) was at seasonal to annual time scales.
Here we aim to use a water travel time model coupled with age-concentration relationships to simulate nutrient dynamics at the event and seasonal timescales in a catchment in northwest Tasmania, Australia. This paper extends the existing literature in the following ways. We (i) extend such modelling to total phosphorus, (ii) investigate the performance of the age-based concentration models for nitrate and total phosphorus, (iii) examine whether seasonal variations affect the age-concentration relationships, and (iv) assess the level of complexity that is useful in the form of the age-concentration relationship for nitrate. To do this, we build on the water TTD model of the catchment developed by Riazi et al. (2022).
2 Model Configuration
2.1 Concentration Model
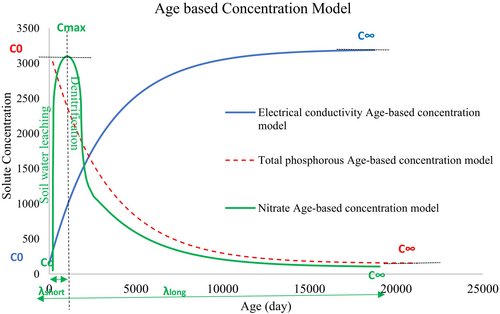
Here age-based concentration functions were used to model nitrate and total phosphorus based on the simulated water TTDs. In doing this, the conceptual understanding of relevant processes was considered. Soils contain a pool of organic and inorganic nitrogen cycling through various chemical forms. Soil nitrogen is increased by adding nitrogen fertilisers, organic matter, and through any nitrogen fixation by plants. It is lost through leaching, plant uptake, and denitrification. When rainwater enters the soil, nitrate concentrations in that water rapidly increase as it interacts with the soil nitrogen. Over time, processes such as plant uptake and denitrification at a variety of points along the various flow paths consume nitrate. This suggests an age-based model for nitrate should have a low initial concentration (representing rainfall), a peak, likely at a relatively young age as water mixes with nitrate from the soil, followed by a decline over time as denitrification and other processes remove nitrate.
Phosphorus is mainly transported attached to soil particles and hence mainly by overland flow. This implies that phosphorus will primarily be transported by young water, and the exponential relationship in Equation (3) is used with the expectation that C0 > C∞, which gives a decreasing trend to Phosphorus concentration with increasing age. This assumes that any phosphorus travelling through subsurface pathways will be adsorbed onto the porous media and largely immobilised. Figure 1 shows the general shape of the various concentration-age relationships used here.
2.2 Calibration and Uncertainty Analysis
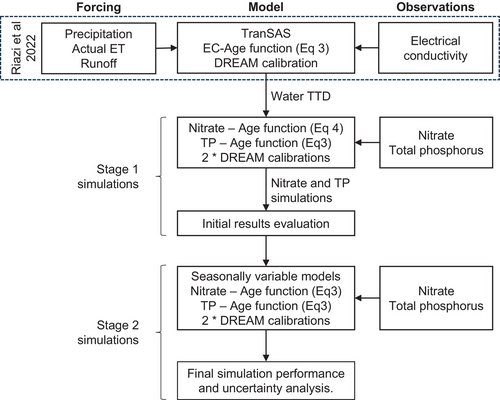
Figure 2 shows the overall modelling process. A travel time distribution model for streamflow is first established that provides a stream water age or backwards TTD at each timestep. The parameters controlling the TTDs were calibrated against electrical conductivity (EC), which was related to water age using Equation (3). Subsequently, the age-concentration relationships for both nitrate and total phosphorus were calibrated using high-resolution observations of nitrate and phosphorus in two steps. First, the initially proposed fixed concentration age relationships were fitted. Simulation results were then analysed with a focus on the adequacy of the form of the concentration—age relationships and their seasonal stability. That analysis then led to two changes in the modelling—using different age-concentration relationships for different parts of the year and changing to use the simpler (Equation (3)) relationship for nitrate.
In this approach, one of aQ or bQ is always 1, while the other parameter can vary down to some calibrated minimum value (amin, and bmin). When aQ < 1 (i.e., at higher discharges), the SAS function favours outflows of younger water, and when bQ < 1 (i.e., at lower discharges), the SAS function favours older water. A calibrated power transformation is applied to the discharge. For the evapotranspiration SAS function, aET was calibrated, and bET was set to one, meaning that evapotranspiration tended to favour younger water. Riazi et al. (2022) include a discussion of the use of EC as a tracer to calibrate the water TTD model. Table 1 provides the water travel time parameter values adopted from Riazi et al. (2022).
| Calibration period | a min | b min | a et | b et | S0 (mm) | © |
|---|---|---|---|---|---|---|
| 2008WY | 0.28 | 0.21 | 0.97 | 1 | 1868 | −0.36 |
| 2009WY | 0.23 | 0.21 | 0.78 | 1 | 945 | −0.33 |
In undertaking the simulations, a 12 h time step was used, and calibrations were performed using the DiffeRential Evolution Adaptive Metropolis (DREAM) algorithm (Vrugt et al. 2009). DREAM is a Bayesian Markov Chain Monte Carlo approach that provides both posterior distributions for calibrated parameters and a fitted residual error model that can be used to understand model parameter and total uncertainty. It is noted here that total uncertainty is the combination of model input, parameter, and structural uncertainty, combined with any uncertainty in the observations that the model is compared against. As typically implemented, DREAM characterises parameter and total uncertainty. A log likelihood objective function was used, assuming an independent identically distributed normal distribution for the model residuals. This objective function primarily depends on the sum of squared residuals. A total of 10,000 realisations for each of 10 Markov chains were used, with uniform prior distributions for the model parameters. Calibrated parameter values and model performance metrics were extracted for the maximum a posteriori model in each case. Relatively wide (i.e., uninformative) prior distributions were assumed, with values provided in Supporting Information (Table S1).
3 Study Site and Data
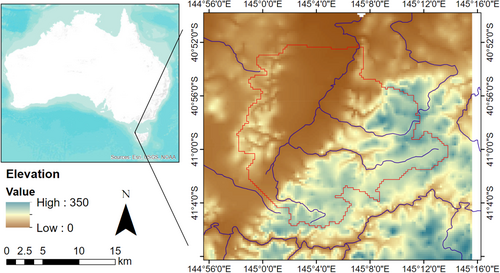
The Duck River catchment is located on the temperate northwestern Tasmanian coast, Australia (Figure 3). It has a gauged area of 369 km2. This catchment is divisible into two hill zones in the eastern and western sections and a flat plains zone in the central part, with the Duck River stream meandering across it. Geology, land cover, and land use are summarised in Table 2. A more detailed description is provided in Riazi et al. (2022).
| Zone | Geology | Usages |
|---|---|---|
| Eastern hills | Sedimentary mud and siltstones overlain by shallow Tenosol soils (Richley 1978), moderate permeability in the eastern and southern hills and basaltic materials with highly permeable and fertile Ferrosol soils in the north-eastern hills (Isbell 2002) | Forests (native and plantation) are the dominant in the eastern and southern hills and mixture of grazing beef cattle, less intensive dairy in comparison with the flat areas and cropping vegetables present in the north-eastern hills |
| Western hills | Marine sediments with forming Dermosol soils in it (high permeable in the surface and decreases with depth). The permeability is moderate in the northern parts (sandy) deteriorates in the southern plains (alluvial gravel, sand, silt, clay, and sandy coastal dunes (Isbell 2002) | Forestry, beef and cattle grazing are the main land usages |
| Flat central plains | Alluvial gravel, sand, silt and clay and sandy coastal dunes | Intensive dairy farming with having high seasonal groundwater tables |
The Duck River catchment produces high loads of nutrients, and Duck River concentrations are among the highest in Tasmania (DPIWE 2003). Intensive agriculture (specifically the dairy industry) is likely the main cause of the high nutrient concentrations in the catchment (Green 2001; DPIWE 2003). Effluent irrigation is a common practice throughout the catchment, which ceases for some time in winter. Occasional spills or overflows of effluent may occur within the catchment. The application of artificial fertiliser for all land uses depends on individual farmers management preferences, with some managers applying phosphatic fertilisers in spring and autumn (split applications) and others in summer (single application) (Burkitt et al. 2011). For nitrogenous fertilisers, urea is applied year-round. Nitrate in rainfall is 37 μg-N/L on average at Cape Grim ~50 km northeast of Duck River, which equates to 6% of the mean observed stream nitrate concentrations for the study period (622 μg-N/L).
High-frequency (hourly) records of EC, nitrate (NO3-N), total phosphorus (TP) in the Duck River over 2 years (Bende-Michl et al. 2013) have been used in this modelling. The forcing data used consist of rainfall, actual evapotranspiration (AET) and stream discharge, and are the same as used for modelling EC (Riazi et al. 2022). Rainfall was from the Australian Water Availability Project site (AWAP) (http://www.eoc.csiro.au/awap/) and hourly stream discharge (m3/s) records were obtained from the Water Information Tasmania Web Portal (https://portal.wrt.tas.gov.au/). AET and soil moisture were estimated using the SIMHYD model (Chiew et al. 2002) calibrated against streamflow for the period 1967 to 2019 using a daily timestep, as described in Riazi et al. (2022).
A water year of April to March was selected (discussed in more detail below) and a split sample calibration validation approach was selected. This was done despite there being only two years of high-frequency data available, as we felt that the benefit of examining model generalisation across years outweighed the use of all the data to more strongly inform the parameter values during calibration. We acknowledge that this is a subjective choice and that the short record is a challenge.
4 Results
4.1 Hydrological Condition and Nutrient Dynamics
We start with an exploratory analysis of the observation data with the aim of examining how stream discharge and nutrient concentrations vary over time. This provides insight into the role of discharge as one process influencing the temporal variation in TP and nitrate. The temporal dynamics of EC, TP, and nitrate (all nitrate is expressed as nitrate-N) are shown as timeseries along with concentration –discharge scatter plots (Figure 4). There are some missing data due to measurement issues (Bende-Michl et al. 2013). Most of the missing nitrate data were during the high-flow season in the 2008WY. TP has the most continuous data availability.
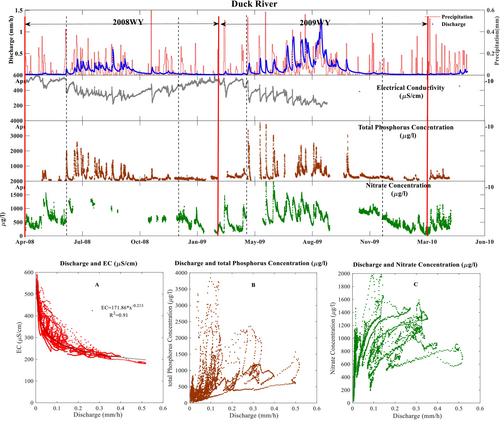
The typical seasonal discharge pattern in the catchment consists of low flows from October to April/May and then higher flows and a series of runoff events over the winter/spring period from April/May to October. Given the hydrological seasonality, the monitoring period was divided into two water years (red lines) starting on the 1/3/2008 (2008WY) and 1/3/2009 (2009WY) for modelling purposes. Hydrological conditions differed between the two study years, with 2009 (runoff = 776 mm) being relatively wetter than 2008 (runoff = 415 mm). This influenced the start of the high flow period (delineated by dashed black lines in Figure 4), which started about 3 weeks earlier in 2009, and the maximum discharge, which was twice the 2008 maximum discharge. Like runoff, the nutrients and EC also exhibited strong seasonality (Figure 4).
Both EC and nutrient concentrations responded strongly to flow events, although the dynamics of that response were different in the high and low flow seasons. EC and nitrate concentrations responded to flow, with EC decreasing and nitrate increasing. The responses were greater during the high flow season, although it should be noted that flow variations were also higher. The maximum nitrate concentrations were 1983 and 1567 μg-N/l for nitrate during high and low flow seasons respectively. For EC, the corresponding values were 564 and 596 μS/cm. The relatively consistent behaviour of EC and nitrate suggests similar transport pathways. Conversely, TP responded to flow very strongly during the high flow season but quite modestly during the low flow season. The highest TP during the high flow season was 3849 μg/L, while during the low flow season it was only 800 μg/L. This, together with the very flashy response of TP during events, suggests that TP was most likely transferred by surface flows.
Comparing the high flow seasons of the 2008WY and the 2009WY, the concentrations of TP between events were higher and EC was lower during the 2009WY. The wetter conditions in 2009 led to greater TP transport. Baseflow TP concentrations were also slightly higher in the 2009WY. Unfortunately, the high level of missing nitrate data in 2008WY make comparisons to the 2009WY difficult.
Scatter plots showing the relationships between solute concentration and discharge (Figure 4) show marked hysteresis behaviour. EC has a stronger relationship to discharge than nitrate and TP. The relationships of nitrate and TP with discharge vary markedly between events. The EC declines as flow increases while the TP and nitrate both increase at higher flows, with TP tending to increase more rapidly (Figure 4B, steepening curves) at higher flows while the rate of increase of nitrate tends to reduce as flow increases (Figure 4C, flattening curves).
4.2 Initial Models—Stage 1 Simulations
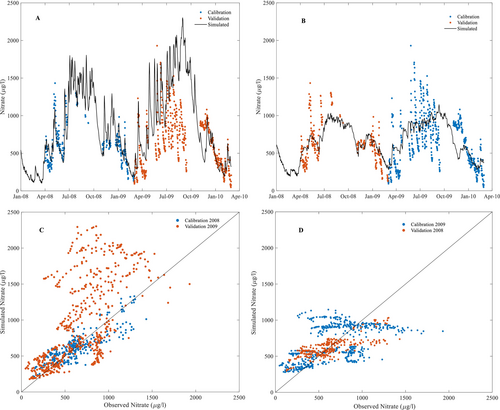
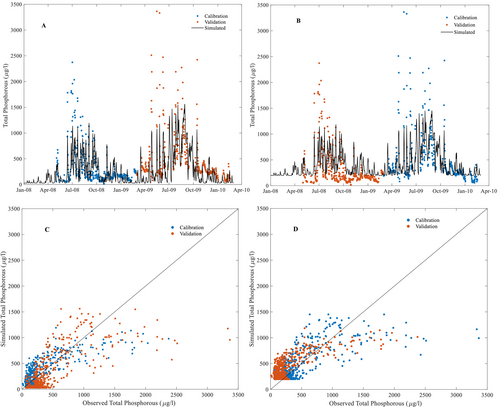
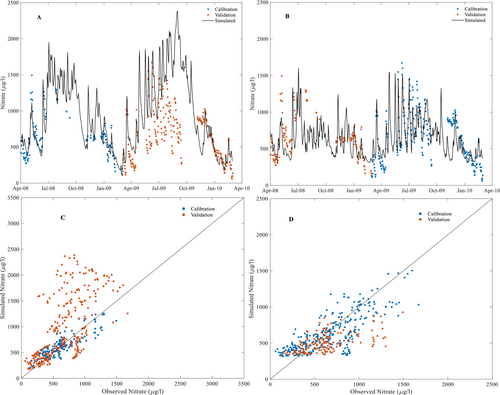
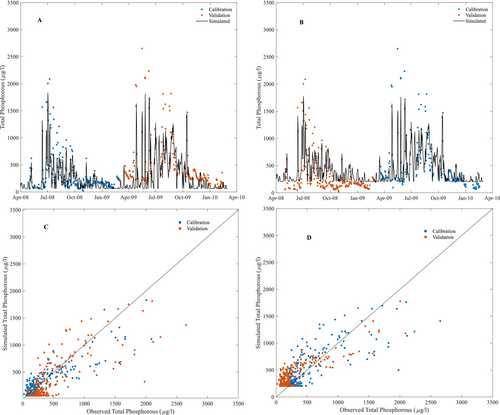
Calibration and validation results are presented using the two different calibration periods for each of nitrate (Equation (4)) and TP (Equation (3)) in Figures 5 and 6 respectively. These figures show time series (A and B) and scatter plots (C and D). Model performance statistics are shown in Table 3 for nitrate and TP.
| Conc. model | Calibration | Validation | ||||||
|---|---|---|---|---|---|---|---|---|
| Period | MAE (μg/l) | Bias (μg/l) | NSE | Period | MAE (μg/l) | Bias (μg/l) | NSE | |
| Stage 1 simulations | ||||||||
| N03 | 2008WY | 112 | 3.5 | 0.72 | 2009WY | 310 | 200.3 | −1.5 |
| 2009WY | 231.1 | 9.2 | 0.27 | 2008WY | 147 | −3 | 0.49 | |
| TP | 2008WY | 151 | −0.6 | 0.58 | 2009WY | 242 | −126 | 0.41 |
| 2009WY | 192 | −0.4 | 0.51 | 2008WY | 210.5 | 139 | 0.4 | |
| Stage 2 simulations | ||||||||
| N03 | 2008WY | 113 | 7.4 | 0.74 | 2009WY | 381 | 290 | −1.4 |
| 2009WY | 168 | −0.8 | 0.62 | 2008WY | 183 | −96 | 0.31 | |
| All | 175 | 1 | 0.52 | |||||
| TP | 2008WY | 121.4 | −2.9 | 0.75 | 2009WY | 216 | −126 | 0.54 |
| 2009WY | 173.13 | 2 | 0.62 | 2008WY | 176.7 | 117 | 0.62 | |
| All | 158 | −0.9 | 0.66 | |||||
Except for nitrate during the 2009WY, the calibration simulations performed well (NSE > 0.5), with higher NSE and lower mean absolute error for both solutes in the 2008WY. Model performances decreased during validation on the 2009WY, especially for nitrate. This relates to the differences in both TP and nitrate concentration between the 2008WY and the 2009WY years. The many missing data points in the 2008WY for nitrate are also challenging. While the nitrate calibration for the 2008WY performed well (Table 3), the 2009WY validation had a large bias. Comparing validation and calibration performance for each period showed reductions in NSE for validation (Table 3), except for nitrate validated using the 2008WY. Overall, calibration and validation performances were better for TP.
Figure 5 indicate that the model reproduces the overall seasonal trends and event dynamics for nitrate well when calibrated against 2008WY but not for the nitrate simulations calibrated using the more complete 2009WY (Figure 5A,C). In that case, the event response was very damped compared with the observations. In contrast, the nitrate simulation calibrated using the 2008WY captured the event dynamics where observation data were available, although there are few data during the high flow season (Figure 5A). While the validation against 2009WY showed event responses of the right magnitude (Figure 5A), there was substantial bias during the 2009WY high flow season, especially for concentrations above 500 ∝γ-N/l (Table 3, Figure 5A,C). While the bias is obvious, the responses during events plot on slopes approximately equal to one in Figure 5C, confirming the event response magnitude is well captured.
Figure 6 shows the TP simulations. TP simulations were better than the nitrate simulations (Figure 5 vs. Figure 6, Table 3). One behaviour that is obvious in both the timeseries and scatter plots for TP is that peak concentrations are underestimated during high flow events, especially earlier in the high flow season (Figure 6). There are also periods during the low flow season (around January each year) where the model suggests larger responses to minor flow events than occur in the observations. The observed time series reveal higher TP concentrations during the 2009WY than the 2008WY. When the model is calibrated against 2009WY, it also results in high simulated concentrations.
Tables 4 and 5 display the calibrated model parameters for the simulation of nitrate and TP respectively. For the nitrate model, the five concentration parameters (C0, C∞, Cmax, λshort and λlong) changed between the 2008WY and 2009WY calibration periods. The concentration parameters (C0, C∞, Cmax) calibrated to higher values in the 2009WY than in the 2008WY; although, Cmax has relatively similar values in the two years. The higher values for C0 and C∞ are likely to be related to the existence of more data availability in the high flow season of the 2009WY. Considering the time constants, the absence of data during the high flow season in the 2008WY leads to estimating smaller λshort. Furthermore, the value of λshort was extremely small (3.6 h) compared with the model time step (12 h) for the 2008WY calibration, closely approximating a negative exponential relationship (peak concentration occurred at an age of only 0.8 days). For the 2009WY calibration, λshort and λlong were practically identical at 20 days which results in a peak concentration at an age of ~19 days. This peak at 19 days was associated with strong damping of the event response, whereas the 2008WY calibration (peak at of 0.8 days) captured event dynamics in nitrate well.
| Calibration Period | C0 (μg/l) | C∞ (μg/l) | CMax (μg/l) | (d) | (d) |
|---|---|---|---|---|---|
| 2008WY | 144.8 | 0.08 | 5047 | 0.15 | 29 |
| 2009WY | 886 | 2.8 | 5005 | 20 | 20.1 |
| Calibration Period | C0 (μg/l) | C∞ (μg/l) | λ (d) |
|---|---|---|---|
| 2008WY | 8182 | 29 | 1 |
| 2009WY | 4884 | 199 | 1 |
In the case of TP (Table 5), calibrated values of C0 were higher and of C∞ were lower for TP in the 2008WY. The lower C∞ is consistent with lower TP concentrations during the low flow season in the 2008WY. As mentioned above, the maximum TP values are related to runoff events at the start of the high flow seasons. TP concentrations are higher for this time in the 2009WY, yet the higher C0 values for TP calibrated for the 2008WY. λ values were 1 day implying that 95% of the reduction in concentration with age occurs by an age of 2 days. Thus, simulated event responses depend on the amount of very young water combined with the C0 values, and the higher C0 for the 2008WY calibration likely relates to the wetter conditions and greater fraction of very young water during events in the 2009WY.
4.3 Residual Analysis
To further explore the model simulations and investigate whether systematic errors suggesting model improvements can be found, we analyse the model residuals (=simulated–observed) here. Both nitrate and TP exhibited significant biases during the validation years (Table 3). Figure 7 displays the nitrate and TP concentration residuals of models calibrated for the 2008WY (blue dots) and the 2009WY (red dots). Model residuals are plotted against (A) cumulative discharge for the water year, (B) time, (C) observed solute concentration, (D) discharge, and (E) day of the year.
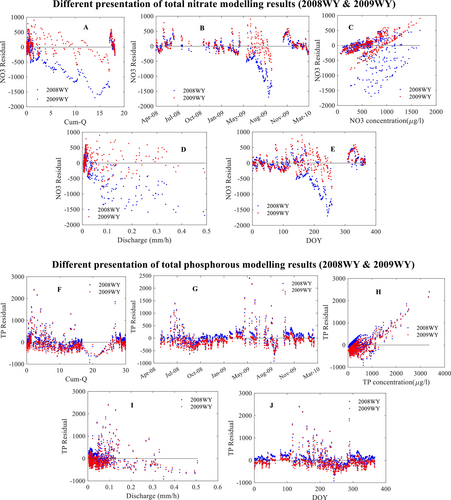
Comparing the two periods for nitrate shows different behaviour. The 2008WY calibration shows that the nitrate concentration was greatly overestimated between May-2009 and August-2009 with the residual becoming more negative with increased discharge (Figure 7D) and cumulative discharge (Figure 7A). In the 2008WY calibration, these overestimates are mainly associated with observed concentrations higher than 500 μg/L (Figure 7C). Figure 7C also shows a strong relationship between the residual and observed concentration for the 2009WY calibration, where high observations are underestimated and low observations are overestimated. This is due to the model failing to capture the event scale dynamics when calibrated against the 2009WY (Figure 5B,D). Figure 7E shows that residuals move systematically towards negative values from day of the year 120 to day of the year 250, corresponding to the high flow season and suggesting a systematic shift in concentrations over that season that is not captured by the model.
The different residual behaviours for the 2008WY and 2009WY calibration periods likely result from the lack of observations during the high flow season in the 2008WY, whereas there is much better data availability in the 2009WY. The inability of the model to capture the event dynamics for the 2009WY calibration may be related to the presence of a declining trend in event nitrate concentrations over the high flow season. The high flow season progressed from May to September 2009, meaning a highly smoothed fit may result in a higher likelihood than a fit with dynamic event concentrations but missing the seasonal trend. For the 2008WY, the seasonal trend is evident in plots A and E (blue dots) and less obvious in plots A and E for the 2009WY (red dots), as well as Figure 4A,B and is responsible for the spread in nitrate—discharge data (Figure 4, panel C). Comparing the timeseries results from 2008WY and 2009WY (Figure 4A,B) shows that the model can produce simulations with strong event responses, but it seems incapable of producing both the correct event and seasonal patterns with the one parameter set.
In contrast to nitrate, the behaviour of TP residuals is similar for both calibration periods, except for an overall downward shift of all residual data points with the 2009WY calibration compared with the 2008WY calibration. Overall, the calibrated model underestimated the high TP concentrations in the beginning of the high flow season and then overestimated them later in the high flow season (Figure 7H). The largest residuals occurred for discharges between 0.05 and 0.15 mm/h (Figure 7I), and they correspond with the highest observed TP concentrations (Figure 7G). There are several features showing seasonal trends in the residual plots for phosphorus. The residual time series show positive residuals in each autumn near the start of the high flow season and negative residuals later in the high flow season (Figure 7G). Residuals plotted against the cumulative flow for the water year (Figure 7F) and against dayof thear (Figure 7J) start with residuals clustered around zero. The residuals then move up around a cumulative flow of 1 mm or between days 100 and 200 before becoming negative for cumulative flows of 10–25 mm or days 150–300 before returning to be clustered around zero.
4.4 Improving the Models—Stage 2 Simulations
To further investigate seasonal effects on nitrate and TP concentrations, Figure 8 shows the simulated soil water storage from SIMHYD and the observed discharge together with the observed TP and nitrate concentrations and EC. The soil moisture started increasing from June in 2008 and May in 2009. It first reached its highest annual values during July and August in 2008 and 2009, respectively. The highest TP and nitrate concentrations occurred during this seasonal increase in soil moisture during the periods shown by the two black rectangles in Figure 8.
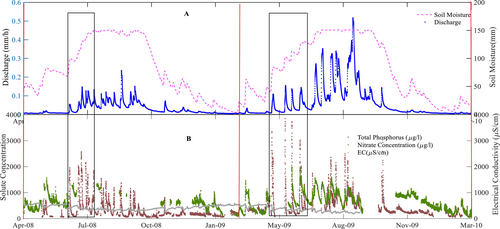
The travel time model provides a basis for capturing event and seasonal dynamics in water age that aims to also reflect the effect of varying contributions from different flow paths as hydrologic conditions change. This is achieved using dynamic SAS functions modulated by discharge. This approach assumes that for any given discharge, the only factor that would change solute concentrations is the seasonal variation in residence time distribution. Riazi et al. (2022) found that the residence time distribution of stored water became somewhat younger over the high flow season; however, the results presented above suggest that this is not sufficient to capture trends in event nutrient concentrations over the high flow season. Therefore, it is likely that a variable source strength for TP and nitrate is needed. This could be due to variations in fertilisation of agricultural areas, the release of solutes during mineralisation of organic matter during autumn, and/or flushing of solutes by successive runoff events, for example.
Seasonally varying source strengths imply that the concentration parameters in the concentration-age relationships might change seasonally. As a step towards understanding how seasonally varying concentration parameters could improve the modelling, soil moisture was used as a guide to separate the early part of the high-flow season from the rest of the year. Two changes were made. Firstly, Equation (3) rather than Equation (4) was used for the nitrate concentration-age relationship, given that the calibrated parameters implied this shape relationship is required to capture both event and seasonal dynamics anyway (Table 4). Secondly, soil moisture was used as a basis to allow C0 and λ to vary between two periods. C0 and λ are applied outside the rectangles on Figure 8 and C0* and λ* are applied within the rectangles, where C0* and λ* replace C0 and λ in Equation (3). The time periods associated with the higher source concentration were determined by examining soil moisture and discharge values for the beginning of high-flow period.
Applying this new model configuration to nitrate produced the results in Figure 9 and Tables 3 and 6. The results improved markedly, especially when calibrating using the 2009WY. Nevertheless, the lack of nitrate data for the high flow season in 2008WY still hinders the calibration of the model using the 2008WY for nitrate. Comparing the performance of nitrate concentration modelling in different stages (before and after changing source concentration) in Table 3, the NSE for the calibration period increased from 0.27 to 0.62 for the 2009WY and from 0.72 to 0.74 for the 2008WY. The inconsistency in data availability for the 2008WY and 2009WY still led to lower NSEs during validation.
| Calibration Period | C0 (μg/l) | C0* (μg/l) | λ (d) | λ* (d) | |
|---|---|---|---|---|---|
| 2008WY | 5123 | 5476 | 1.2 | 29 | 30 |
| 2009WY | 2679 | 4480 | 310 | 3.4 | 4.7 |
| All | 2939 | 5793 | 341 | 6.8 | 7.1 |
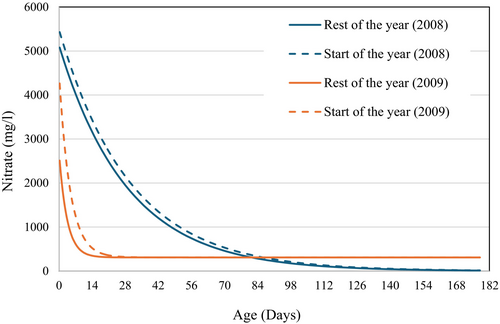
Changing the concentration model for nitrate from Equation (4) to a pair of relationships with the form of Equation (3) did not change the number of parameters calibrated. The calibrated C0* values are both somewhat higher than C0, as expected given the higher observed concentrations at the start of the high flow season (when C0* applies) but the timescale parameters, λ and λ*, were quite similar (Table 6). While λ and λ* are similar and including λ* requires an extra parameter to the model; it improves the modelling performance, and hence λ* was retained. The low variability of nitrate concentration values in the 2008WY led to relatively high and similar calibrated values for C0 and C0* compared with those calibrated using the 2009WY. The lower nitrate concentrations in 2008WY also led to a slightly lower value of C∞. Figure 10 displays the age-concentration relationships for nitrate in the Duck River for the start of the high flow season (May and June—dashed lines) and the rest of the simulation period (solid lines). The 2009WY calibration shows differences in the nitrate age-concentration relationship for ages up to 2 weeks. This difference stems primarily from the marked difference between the rate of decline in concentration with age. This likely relates to the low data availability during the high flow season in 2008WY, especially during events, and will be discussed further below.
The possibility of improving the TP simulations using the similar form of model as for the improved nitrate model was examined. This adds two additional parameters for calibration, C0*, and λ*; however, calibration showed λ* ≈ λ and therefore ultimately only a single value of λ was used reducing the additional parameters calibrated to one. The same periods were selected as used for nitrate.
The results of modelling TP concentration with a varying source strength are displayed in Figure 11 and Tables 3 and 7. Comparing Figure 7 (stage 1 simulations) and 11 (stage 2 simulations) shows that the simulated TP is substantially improved, particularly for high observed TP concentrations at the start of the high flow season. Comparing the performance of the TP modelling for stages 1 and 2 (before and after assuming extra source for TP concentration) in Table 3 shows the NSE improved from 0.58 and 0.51 to 0.75 and 0.62 for calibration against 2008WY and 2009WY, respectively. For validation, NSE increased from 0.41 and 0.4 to 0.58 and 0.51 for the 2008WY and the 2009WY, respectively. Allowing the source concentration for TP to vary between the early high flow season and the rest of the year improved the model performance more for the 2008WY calibration than the 2009WY calibration.
| Calibration Period | C0 (μg/l) | C0* (μg/l) | C∞ (μg/l) | λ (d) |
|---|---|---|---|---|
| 2008WY | 41 968 | 98 513 | 63 | 0.24 |
| 2009WY | 10 894 | 22 984 | 205 | 0.41 |
| All | 13 212 | 30 257 | 133 | 0.36 |
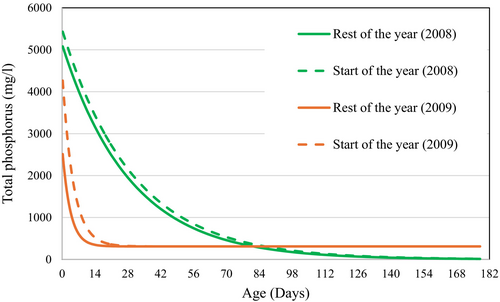
The calibrated values of C0 and C0* for the 2008WY were 41 968 and 98 513 μg/L for the modified model (Table 7) compared with C0 = 8182 for the original model (Table 5). At the same time, λ declined from 1 to 0.24 days. For the 2009WY μg/l calibration, C0 and C0* were 10 894 and 22 984 μg/L for the modified model compared with C0 = 4883 μg/L for the original model while λ declined from 1 to 0.41 days. In both cases, the C0* is roughly twice C0. It should be noted in interpreting the C0 values that C0 is for age T = 0 while the shortest transit time resolved in the simulated transit time distribution is half the model time step or 0.25 days. Given the small values of λ, C(T = 0.25) is very much less than C0. Figure 12 shows the variation of TP concentration with water age plotted starting at T = 0.25 days. Unlike nitrate, in the case of TP, the two different calibration periods result in similar time constants, with the key difference being the concentrations for very young water.
5 Discussion
In this paper, we have built upon the travel time modelling of Riazi et al. (2022) by applying age-concentration relationships to simulate the dynamic behaviour of TP and nitrate in the Duck River, Tasmania. Using high-frequency data, we undertook a two-stage modelling process, with stage one using temporally fixed age-concentration relationships and stage two allowing for two age-concentration relationships, one for the early part of the runoff season and one for the remainder of the year. While the fixed age-concentration relationships were able to reasonably capture the seasonal and event dynamics for total phosphorus, the fixed age-concentration relationship approach (stage one) was not able to simultaneously capture the seasonal and event dynamics for nitrate. Analysis of model residuals suggested problems in capturing seasonality for both TP and nitrate. Allowing the parameters controlling the young end of the age-concentration relationship to vary during the early part of the high-flow season substantially improved the modelling both in terms of metrics (Table 3) and model behaviour (Figures 9 and 11 c.f. Figures 5 and 6). The reason that only the parameters for the young end of the age-concentration relationships were allowed to vary relates to an expectation that mixing would dampen any seasonal variations in input concentration to long travel time (multiple year) groundwater storages within the catchment system.
5.1 Is Biogeochemistry Needed?
The improvement resulting from using two age-concentration relationships has several implications for travel time-based catchment water quality modelling. There are multiple potential sources of seasonality in the dynamics of reactive water quality constituents such as nutrients. The first simply relates to seasonality in flows. Second, the residence time distribution of water stored in a catchment varies over time due to both varying input and output fluxes with soil moisture and groundwater storage increasing in some parts of the year and decreasing in others, and to differences in the relative importance of different output pathways (evapotranspiration vs. various sources of streamflow) over the years. The travel time model of Riazi et al. (2022), which was calibrated against EC (assumed to be conservative), is notionally capable of capturing these hydrological aspects of seasonality. Thirdly, there is a range of biogeochemical processes that are likely to vary across the year and could lead to changes in concentrations. A fixed age-concentration relationship assumes these have a minor effect. The improvement in modelling results with the stage two simulations suggests that these biogeochemical effects need to be represented at least in a simple manner, which the stage two simulations enable, albeit in an empirical rather than process sense.
In their work on Duck River, (Bende-Michl et al. 2013) considered water quality variations over seasonal time scales and noted a variety of potential hydrological and biogeochemical effects. They considered behaviour during the summer/early autumn, autumn, late June/early July, winter, and mid- to late spring. In summary, these stages vary from relatively dry soil profiles to relatively wet, in source availability, and in mobilisation & delivery, all of which contribute to the river responses (Bende-Michl et al. 2013). Bende-Michl et al. (2013) suggested five stages over a year in the Duck River catchment.
During the low flow period in summer and early autumn, there are generally dry conditions with limited opportunity to mobilise nutrients and a build-up of nutrients in the catchment. Important management activities include the application of both inorganic fertilisation and organic livestock excreta from dairy operations, together with cattle grazing. While there is limited mobilisation during this period due to dry conditions, some intense rainfall events lead to detachment mobilisation. Overall, nutrients build up in the soil during this period. Autumn applications of N and P as fertiliser occur in April–May, which can also result in incidental loss from fertilisation, and Bende-Michl et al. (2013) note that ammonia peaks in this period. Meanwhile, increasing soil moisture enables mineralisation of soil organic matter (Paul et al. 2003) in general, with mineralisation pulses occurring with the rewetting of dry soils (Butterly et al. 2010). This would also lead to additional accumulation of mineral nutrients in soils, leading to a high nutrient source concentration at the start of the high flow season.
During the early events of the high flow periods (Bende-Michl et al. (2013)), the accumulated available nutrient sources are flushed from the catchment and the highest annual TP and nitrate concentrations were observed in the Duck River. At the same time, source concentrations are likely to be reducing due to the wet conditions and removal of easily mobilised nutrients. Figure 4B,C shows how the TP—flow and nitrate—flow behaviour changes over time. A variety of different processes are likely to influence behaviour during the high flow period. From a hydrologic perspective, increasing soil moisture (Figure 8) would activate a wider variety of flow paths (Saffarpour et al. 2016) and transport the nutrients. The importance of different sources also potentially changes over time. For both TP and nitrate, farm tracks may be an important high-concentration source due to animal waste deposition (Adams et al. 2014) and they may be relatively more important before the catchment gets very wet as they might supply a higher fraction of the streamflow. For TP, differences in vegetation cover over time might also lead to different levels of mobilisation of fine soil fractions with adsorbed P.
The relatively high nitrate concentration is likely to be sourced internally from grassland farm systems and springs that directly and indirectly feed the Duck River (Bende-Michl et al. 2013). Differences in mineralisation of organic N into nitrate with soil moisture may also influence the source concentration, and mineralisation might deplete the organic N pool over autumn. Differences in denitrification with temperature and soil water conditions are also likely. Contributions of nitrate from springs into some creeks, plus a spring flowing out from the escarpment and directly feeding the Duck River, are considered possible reasons for high nitrate concentrations (Bende-Michl et al. 2013).
Clearly, there is some need to represent changing source concentrations due to the effects of management and biogeochemical processing. Some studies have coupled soil nitrogen models with travel time models (Van Der Velde et al. 2010; Nguyen et al. 2022). Typically, these represent detail in nutrient processing in the soil but ignore processing elsewhere. They represent detail in transit times within the groundwater but ignore transit time in other parts of the catchment system. The above discussion of processes in the Duck River catchment paints a picture of complexity that would require very detailed data sets to properly inform a nutrient processing model. Conversely, a very simple representation of these dynamics (two age-concentration relationships differing in the young water end of the relationship) was able to provide good simulations of both event and seasonal dynamics. This suggests that the required level of model complexity remains unclear at the present time.
5.2 Separating Transit Time and Non-Conservative Tracers
In this work, we have deliberately separated the transit time aspects of the model from the non-conservative behaviour of nutrients. This was done by calibrating the travel time components against EC (Riazi et al. 2022) and then separately calibrating the nutrient age –concentration relationships. This prevents the biogeochemical processing of nutrients from influencing the water travel time simulations and implicitly assumes that it is better to inform the travel time components of the model with conservative tracers. It also means that models calibrated against TP and nitrate share a common water travel time model, which is an essential feature if water travel time distributions are to be meaningful. Benettin et al. (2020) also took an approach like this in studying relationships between nitrate and water age in that they calibrated TranSAS against chloride before comparing nitrate to the resulting age distributions, although they did not explicitly model nitrate. In contrast, Nguyen et al. (2022) calibrated a combined travel time and nutrient dynamics model against nitrate, in essence assuming that the nitrate dynamics would effectively inform the travel time component of the model. The relative merits of these differences in modelling approaches are not clear at present, and to some extent, it is unavoidable that these differences will reflect pragmatic issues of data availability. Nevertheless, this is an important area for further investigation.
5.3 Form of Age-Concentration Relationship
For nitrate we considered two forms of the age-concentration relationship. In the stage one simulations, a form with a peak was used due to the low nitrate concentration in rainfall, considering the soil as a key source and acknowledging processes such as denitrification that are likely to reduce nitrate concentrations over time once water leaves the soil profile. However, the timing of the peak was very early when calibrated against the 2009WY (the more seasonally complete data) and hence an exponential relationship was assumed between water age and concentration for nitrate for stage 2 simulations. This simpler form appears to be adequate, probably because nitrate quickly enters solution when water is in contact with the soil.
5.4 Interpreting the Age-Concentration Relationship Timescales
The age-concentration relationships from the stage two modelling give information about the water age ranges to which simulated stream concentrations respond. For nitrate, the concentration reduces with water ages up to about 2 weeks, after which the concentration does not materially change. Water delivered to a stream within two weeks represents a reasonably rapid flow path. Groundwater travel times are generally much longer, and transit time modelling suggested ages up to a decade in Duck River (Riazi et al. 2022). Overland and channel flow paths are likely to be closer to a day, given distances of up to ~50 kms (Figure 3). A travel time of the order of a week is most likely to involve a shallow subsurface flow path rather than either surface runoff or groundwater. This would correspond to nitrate sources within the soil profile being most important.
For TP, both age-concentration relationships declined rapidly, approximating C∞ within about a day. Following similar arguments to those above, this suggests a very rapid flow path, most likely surface runoff, is responsible for transporting TP.
5.5 Uncertainty Analysis
While the focus of this work has been on modelling the dynamics of nutrient concentrations and the performance of models based on relatively simple age—concentration relationships, as opposed to explicit modelling of nutrient cycling processes, the use of DREAM allows us to examine parameter and simulation uncertainties. Figure S1 shows the best simulation (green) together with uncertainty bands. DREAM produces posterior joint parameter distributions that can be used to quantify the prediction uncertainty related to uncertainty in parameter values (5th–95th percentile range shown in black) and also includes a statistical error model that, combined with the parameter uncertainty, characterises the total simulation uncertainty (5th–95th percentile range shown in grey). For both nitrate and TP, the total uncertainty range is quite wide; however, the parameter-related component of the uncertainty is narrow (i.e., the black band is much narrower than the grey band). This suggests that most of the model uncertainty arises from the combination of other sources of uncertainty (i.e., model structure, model input and observation uncertainty).
Figure S2 displays the marginal distributions of each model parameter obtained when calibrating the models against all the data. The posterior distributions of λ*, C0, C∞, and C0* for nitrate and C∞ for TP are unimodal and approximately Gaussian (Figure S2). The histograms illustrate the existence of various modes for the other concentration model parameters, λ (nitrate model) and C∞, C0*, λ (TP model). For the nitrate model, all the posterior parameter ranges are much narrower than the prior ranges and independent of the prior parameter boundaries. For the phosphorus model, there is a wide range in C0 values. This might relate to the extrapolation from the effective minimum simulated age (0.25 days) to the intercept (i.e., C0) and the fact that λ is very small, leading to an extremely rapid change in C(T) near T = 0.
The uncertainty analysis suggests parameter uncertainty is relatively low compared with other sources of uncertainty. Figures 10 and 12 give some insight into how much the parameter uncertainty could shift the concentration-age relationships with different calibration periods. Those figures show the calibration from 2008WY, 2009WY and all the data. Overall the parameters from different calibrations result in similar relationships, except for the 2008WY nitrate curves which suffer from low data availability. Together with the uncertainty analysis results, this suggests that parameter variability is much less important than other sources of uncertainty, with structural uncertainty in the model probably being most significant in our judgement. This suggests that work to refine the model structure would be more useful that refining parameter values. Longer observed data sets would of course be an advantage for both improving the model structure and better informing parameters as a wide range of conditions would be observed.
Finally, we note that the results of the uncertainty analysis of age-based concentration models for nitrate and TP are consistent with the uncertainty analysis of the age-based concentration model for EC (Riazi and Western 2024). Most notably, both analyses showed that model structural uncertainty, input uncertainty, and observation uncertainty dominated over parameter uncertainty, which was small.
5.6 Limitations
The modelling presented here was constrained by the short period of data availability and the relatively large amount of missing data for nitrate. Building longer records of high-frequency data for nutrient responses in catchments would relieve this constraint; however, that is challenging to achieve outside well-resourced dedicated long-term research catchments. Furthering our understanding of the value of longer records of high-frequency data to inform operational monitoring investments would be valuable.
In undertaking this work, we deliberately tried to model nutrient dynamics in a simple manner to explore how well such models could capture those dynamics. As noted above, an obvious improvement would be to add more detailed descriptions of nutrient cycling. This would also raise the issue of spatial representation of the catchment, which has a variety of land uses and variations in land management intensity within each land use. This would lead to a variety of nutrient dynamics. Nguyen et al. (2022) improved the performance of their nutrient cycling and transit time model by dividing the Selke catchment into three subcatchments with varying proportions of agricultural land use.
6 Conclusion
Modelling TP and nitrate concentration using TTDs calibrated against EC and nutrient age-concentration relationships calibrated against nitrate and TP was investigated for the Duck River catchment, NW Tasmania, Australia. Models with fixed age-concentration relationships were partially successful in representing nitrate and TP behaviours; however, seasonal trends in both nitrate and TP concentrations during events occurred across the high-flow season that could not be captured and that limited the ability to calibrate the models. By allowing source concentrations to vary between two periods—the early high-flow season and the rest of the year—it was found that model performance both in terms of NSE and matching both the seasonal and event-scale nutrient dynamics was markedly improved. This indicates that representing source concentration across the season is an important area of improvement for such models.
Overall, we found that using age-concentration relationships coupled with a water travel time model was able to capture solute transportation in the Duck River catchment. As others have found, this suggests the approach is able to represent the complexity of different processes in runoff generation by different flow paths or mechanisms and the associated solute transport, as well as the heterogeneities inherent in catchment scale simulation (Rinaldo and Marani 1987; McGuire et al. 2005; McGuire and McDonnell 2006). However, it was also clear that representing the biogeochemical aspects of the system to at least a simple level is required for non-conservative constituents such as nutrients.
Acknowledgements
Zahra Riazi was supported by a University of Melbourne postgraduate scholarship. The high-frequency data were provided by the authors of Bende-Michl et al. (2013). Open access publishing facilitated by The University of Melbourne, as part of the Wiley - The University of Melbourne agreement via the Council of Australian University Librarians.
Open Research
Data Availability Statement
Weather data is available from the Australian Water Availability Project site (AWAP) (http://www.bom.gov.au/climate/maps/). Streamflow data is available from the Water Information Tasmania Web Portal (https://portal.wrt.tas.gov.au/). The high-frequency salinity monitoring data are available from the authors of Bende-Michl et al. (2013).


