Non-stationary control of the NAO on European rainfall and its implications for water resource management
1 INTRODUCTION
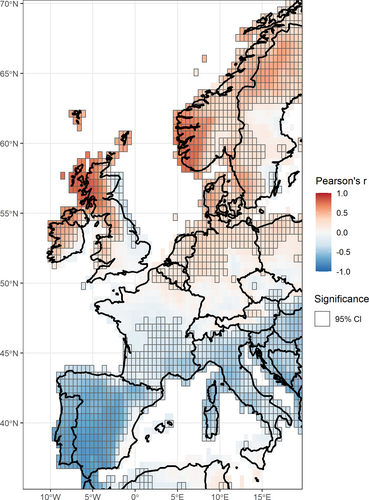
Water resource forecasting generally centres on understanding hydrological variability over coming months or years, so that water managers can prepare for extremes such as droughts or floods (Chang & Guo, 2020; Hao et al., 2018). Some forecasting systems seek to project further into the future to allow long-term planning of infrastructure and resilience to extremes and climate change (Svensson et al., 2015). These systems can rely directly or indirectly on outputs from Global Climate Models (GCMs; such as gridded reanalysis datasets) to forecast hydrological conditions (Bhatt & Mall, 2015; Ionita & Nagavciuc, 2020). In the North Atlantic region, in particular Western Europe, the North Atlantic Oscillation (NAO) is used as an indicator for hydrometeorological conditions given its leading control on winter rainfall totals (Hurrell & Deser, 2010; Scaife et al., 2008, 2014). A dipole of pressure anomalies over the North Atlantic, the NAO's positive phase (greater than average pressure gradient; NAO+) results in wetter conditions in northwest Europe with dryer conditions in southwest Europe (Rust et al., 2018; Trigo et al., 2004). Its negative phase (weaker than average pressure gradient; NAO−) results in the inverse effect on rainfall (Folland et al., 2015; and as shown by the correlation coefficients in Figure 1). Given this relationship, and, considering the role of winter rainfall variability in groundwater drought development (e.g., reduced winter recharge) and generation of late winter/early spring floods, the NAO offers a potential explanatory variable when understanding the behaviour of some hydrological extremes.

Many studies have investigated the relationship between the NAO Index (NAOI) and recorded hydrological variables in Europe, including river flow (Burt & Howden, 2013), groundwater (Lavers et al., 2015), and seasonal rainfall (West et al., 2019), or calculated water resource variables such as the standardized precipitation index (Moreira et al., 2016). Furthermore, a growing number of studies have detected multi-annual periodicities in hydrological variables river flow and rainfall (Rust et al., 2020), and groundwater level (Neves et al., 2019) that align with weak periodicities detected in the NAOI (Hurrell & Loon, 1997), suggesting that multi-annual cycles in the NAO may affect the occurrence of floods and droughts in Western Europe.
GCMs have historically been ineffective at predicting NAO dynamics within future scenarios (Smith et al., 2016); however, recent developments in high-performance computing have enabled forecasting of NAOI effects at seasonal (Świerczyńska-Chlaściak & Niedzielski, 2020) or decadal (Athanasiadis et al., 2020; Dunstone et al., 2016) timescales. Furthermore, with high-resolution hydrometeorological datasets becoming more readily available (Sun et al., 2018), regression analyses between the NAOI and climate variables for forecasting purposes is more achievable. As such, there is a renewed interest from the water resources community in developing medium- to long-term water resource forecasting systems using the NAOI, with the aim of improving preparedness for hydrological extremes and water resource planning (Hall & Hanna, 2018; Svensson et al., 2015). This is particularly useful in water-scarce regions such as southern England (Folland et al., 2015), and the Iberian Peninsula (Moreira et al., 2016) where long-range forecasting has the largest potential benefit to strategic water resource planning (Stein et al., 2016).
The current use of relationships between NAOI and winter rainfall (herein referred to as NAOI-P) relies heavily on the assumption that the strength and direction of the relationship is sufficiently stationary to be applicable in future scenarios. However, research into the dynamics of the NAO itself have shown the NAOI-P relationship to be non-stationary at multi-decadal timescales (Vicente-Serrano & López-Moreno, 2008). Furthermore, there has yet to be an assessment of their utility from a water resource perspective, at decadal or multi-decadal timescales relevant to current water resource projections. We discuss the non-stationarity of the NAOI-P relationship in Western Europe from a water resource forecasting perspective, by undertaking a rolling 10-year window correlation between the NAOI and gridded winter rainfall estimates for the period the past 125 years (1889–2016) across Western Europe. Furthermore, we identify five zones across Europe with similar non-stationary behaviours that provide insight for the application of the NAOI-P relationship for future water management.
2 DATA METHODS
Two datasets have been used in this paper; NAOI data from the NCAR Climate Analysis Section (Hurrell, 2003), and precipitation data from the Global Precipitation Climate Center (Schneider et al., 2018) have been used. The NAOI data are the Hurrell station-based winter (DJFM) index (Hurrell, 2003). This dataset covers the period 1864–2019. The precipitation data are taken from the GPCC's Full Data Monthly Product Version 2018 which is an estimated, gridded precipitation dataset at 0.5° resolution (Schneider et al., 2018). The dataset is specifically generated to investigate long-term climatological relationships and covers the period 1891–2016. The precipitation data have been processed according to the same winter (DJFM) used by the Hurrell winter NAOI dataset for use in the correlation analysis. Grid cells between −13° and 20° Longitude and 35°–70° Latitude were used to represent Western Europe. A simple Pearson's r correlation between NAOI and winter rainfall has been produced for the full-period of data (Figure 1).
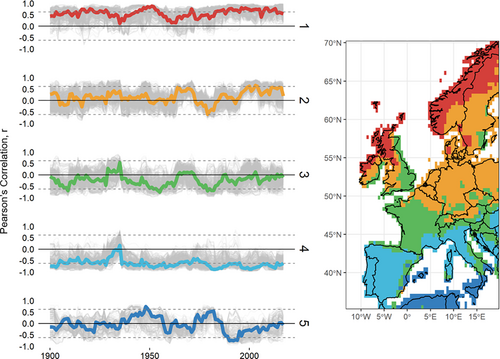
A rolling 10-year correlation analysis between winter rainfall and winter NAOI was calculated for each grid cell in Western Europe for the period 1891–2016, using the Pearson's correlation coefficient with the n-9 to n-year period representing the n-year correlation coefficient. A k-medoids cluster analysis (analogous to k-means for the median case) was then undertaken on the rolling-window correlation-series. Each rolling-window correlation series was not normalized prior to clustering as the Pearson's correlation coefficient is a normalized metric, and the analysis (in-part) is aiming to understanding how the directional control is characterized across Western Europe. Clustering has been undertaken to draw together generalized areas that have similar strength and direction of NAOI-winter rainfall correlation that may be useful for planning purposes. Five clusters were chosen as this gave the greatest spatial coherence between clusters, thereby indicating the regions where it may or may not be appropriate to use the NAOI-P to inform water resource decision making. Medoids (analogous to median centroids) have been calculated for each cluster.
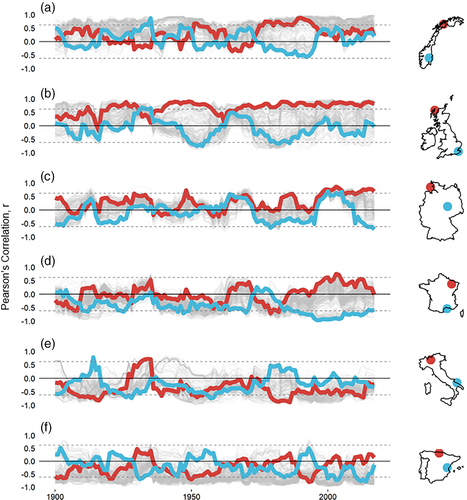
A dissimilarity matrix was also calculated for the rolling-window correlation series using an inverse Pearson's correlation coefficient. The dissimilarity of the rolling correlation series has been assessed to understand the range and extremes (most dissimilar) of NAO control on winter rainfall within selected nation-based regions. These are regions that represent characteristic NAOI-P relationships from either full-period correlation (Figure 1) or clustered rolling correlations (Figure 2) within their domain.

Significance thresholds have been calculated for all correlations (full-period and 10-year rolling) to the 95% confidence interval. Means and variances of the cluster medoids and dissimilar pairs have been calculated which, in addition to a qualitative assessment of temporal variability of the NAOI-P relationship, will be used to assess non-stationarity.
3 RESULTS
The clustered rolling correlation series (Figure 2) indicate regions with similar behaviour of the NAOI-P relationship. Clusters show that NAOI-P correlation varies considerably over time and space, transitioning from positive in higher latitudes (e.g., clusters 1 and 2), to negative in lower latitude (e.g., clusters 3 and 4). This is consistent with the full-period correlation results (Figure 1).
-
Relative temporal stability of NAOI-P correlation, containing two clusters:
- Cluster 1 (centroid mean: 0.57, var: 0.03) representing a positive correlation found in northwest regions of Scotland, Ireland and Scandinavia.
- Cluster 4 (centroid mean: −0.64, var: 0.03) representing the Iberian Peninsula and northern and central Italy, Sardinia and southeastern France with a stronger negative NAOI-P correlation.
-
Transitional regions with greater NAOI-P temporal variance, containing two clusters:
- Cluster 2 (centroid mean: 0.16, var: 0.07) representing a variable, often positive, correlation in western England, Wales, central Ireland, central Scandinavia and most of Germany, Belgium and the Netherlands.
- Cluster 3 (centroid mean: −0.24, var: 0.06) representing a variable, often negative correlation in east and southeast England and France.
- Highly variable NAOI-P relationship, containing only cluster 5 (centroid mean: −0.04, var: 0.1) covering Sicily, and northern Africa.

4 DISCUSSION AND CONCLUSIONS
This paper seeks to question whether the relationship between winter NAOI and winter precipitation (NAOI-P) is sufficiently stationary for application to water resource forecasting in Western Europe. Results indicate few regions in Western Europe where the NAOI-P relationship may be considered stationary at a decadal scale. Given the degree to which this relationship has been utilized in water resource studies, we find that such non-stationarity has direct implications for the efficacy of water resource forecasting in Western Europe.
Previous research into the NAOI-P relationship has consistently highlighted the northwest and southwest of Europe as having the strongest correlation (Hurrell & Deser, 2010; Tsanis & Tapoglou, 2019). Our results generally agree with these areas: for example, Cluster 1 (NW Scotland, Ireland and Norway) remains in a strong, positive correlation for the majority of the period assessed, and Cluster 4 (Portugal and Spain), remain in a similarly strong but negative correlation. In NW UK and Ireland, where winter rainfall is some of the highest in Europe (Totz et al., 2017) and water is in abundance, the NAOI-P relationship has more utility for flood risk and high-flows management, rather than drought. In Portugal and Spain, some of the most water-scarce areas in Europe (Estrela et al., 2012), the relative stationarity of the NAOI-P relationship shown in Cluster 4 supports use of this relationship for water management purposes in these regions. However, generalization of these regions (particularly Spain) as entirely stationary at a multi-decadal timescale may not be appropriate as shown by the dissimilarity pairs in Figure 2f, where we see considerable fluctuations in the correlation, suggesting caution should still be taken when applying the NAOI-P relationship over large areas in these regions.
While we show that some regions agree with existing research (as mentioned previously), our results show that most of Western Europe exhibits a non-stationary NAOI-P relationship. This has the greatest implications in water-scarce regions where there is a demand for new approaches to manage water scarcity, such as southern England (Bryan et al., 2019; Folland et al., 2015). Recent research (Prudhomme et al., 2017; Svensson et al., 2015) has focused on developing new forecasting systems to allow prediction of water resource variables (rainfall, river flow, groundwater level) for one or more years into the future, many of which rely (at least in part) on the NAOI-P relationship in these regions.
Our results show that Clusters 2, 3 and 5, which cover most of Europe, are transitional regions that exhibit stronger non-stationarity than those of relative stationarity (Clusters 1 and 4). Previous work shows many of these areas to have weak to moderate, yet often significant, NAOI-P correlations; such as for western and northern England (West et al., 2019), northern Germany (Riaz et al., 2017), southern France (Massei et al., 2007). Indeed, many studies in these regions have found skilful prediction of winter rainfall (and other water resource variables) through use of the historical NAOI-P relationship, despite the non-stationary reported here (Ionita & Nagavciuc, 2020; Moreira et al., 2016; Rasouli et al., 2020; Rousi et al., 2020; Scaife et al., 2014; Svensson et al., 2015). This apparent contradiction with our non-stationary correlation results at decadal timescales and results from other studies for multi-decadal timescales (Pauling et al., 2006; Vicente-Serrano & López-Moreno, 2008) can be explained by the common multi-decadal periods of relative stability in our results, despite general non-stationarity throughout the rolling correlation series. For example, increased stationarity can be seen in the Cluster 3 medoid, and in the dissimilarly pairs for the UK (Figure 2b), the south of France (Figure 2c), and Italy (Figure 2e), between 1970 and present. As mentioned previously, existing water resource forecasting systems rely on high-resolution, often gridded, hydrometeorological datasets for calibration of the NAOI-P relationship, many of which are only available for recent decades (Sun et al., 2018). Such forecasting systems may be using a calibration period of relative stability in the NAOI-P relationship that is not representative of the true non-stationarity shown here. This naturally draws into question the longer-term validity of many existing studies that seek to utilize the NAOI-P relationship, without accounting for its non-stationary nature.
Counter to this, there are many areas in Europe where utility of the NAOI-P relationship has been discounted for water resource forecasting due to poor average correlation (Figure 1): for instance, south Germany (Riaz et al., 2017), northern France (Massei et al., 2007) and southeast England (Hall & Hanna, 2018). However, our results suggest the NAOI-P correlation can remain in the same direction for up to 30 years, and stay in a state of significance (95% CI) for up to 5 years (e.g., southeast England) in some areas with a weak average NAOI-P correlation. This suggests that if the mechanisms for this relationship inversion are understood, the NAOI could still be a powerful indicator for future (short to medium-term) water resource variability in areas that have historically been ruled out due to poor average correlation. However, water management policy and practice will need to be sufficiently flexible, such as employing frequent reviews of forecasts, to allow for utilization of this changing control.
Variability of the NAO has been a subject of ongoing focus in atmospheric sciences, as has the behaviour of the NAO's control on winter rainfall variability in Europe. In investigating non-stationarity of the NAOI-P relationship at multidecadal (30 year) timescales, Vicente-Serrano and López-Moreno (2008) suggest inversions of correlation direction may be the result of an eastward shift of the NAO's southern pressure centre (Azores) towards the eastern Mediterranean. Atmospheric literature seems to agree that interannual to multi-decadal eastward shifts of the NAO are due to Rosby wave dynamics (Luo & Gong, 2006; Peterson et al., 2003; Zhang et al., 2011), the exact mechanics of which are still being explored in GCMs (Huang et al., 2018). If systems for water resource forecasting are to use the NAOI-P relationship, it is critical to account for the apparent NAOI-P non-stationarity. For this to happen, more research is required to understand the full extent of this non-stationarity within different regions and time periods across Europe, and most importantly, research is required to fully understand the mechanisms by which the NAOI-P relationship is inverted and how this can be represented in GCMs. Further, these non-stationary relationships may shed further light on existing uncertainties in hydrometeorological understanding, which are summarized by Blösch et al. (2019). With an improved understanding of non-stationarities between European weather and driving climate systems, we may be better positioned to answer questions around non-stationarity of the hydrological cycle (e.g., question 1 of the paper), questions on how drought- and flood-rich periods arise (e.g., question 9), or how hydrological models can be adapted to extrapolate changing climate conditions (e.g., question 19). Answers to these questions are critical for our continued sustainable use of water resource in a changing climate.
ACKNOWLEDGEMENTS
This work was supported by the Natural Environment Research Council (grant numbers NE/M009009/1 and NE/L010070/1) and the British Geological Survey (Natural Environment Research Council). J.P.B. publishes with the permission of the Executive Director, British Geological Survey (NERC). M.O.C. gratefully acknowledges funding for an Independent Research Fellowship from the UK Natural Environment Research Council (NE/P017819/1).
Open Research
DATA AVAILABILITY STATEMENT
The data that support the findings of this study are available in CORD at https://doi.org/10.17862/cranfield.rd.13949381. This study was a re-analysis of existing data that are publicly available from NCAR at https://climatedataguide.ucar.edu/climate-data.


