The impact of morphodynamics and storm floods on pore water flow and transport in the subterranean estuary
1 INTRODUCTION
Subterranean estuaries are considered powerful biogeochemical reactors affecting elemental net fluxes to the sea (Anschutz et al., 2009; Charette & Sholkovitz, 2006; Moore, 1999, 2010; Santos et al., 2008). The hydrobiogeochemical reactions and thus solute fluxes depend on dispersive mixing and subsurface residence times (Anwar et al., 2014; Robinson et al., 2009). These in turn are controlled by the hydro(geo)logical boundary conditions, such as meteoric groundwater flow, tides, waves, storm floods and beach morphology (Robinson et al., 2018). The classical view of a subterranean estuary comprises of a distinct and rather position stable salinity stratification of upper tide-induced seawater recirculation and underlying freshwater tube pinching out near the low tide mark (Robinson et al., 2006). In this study, we demonstrate by numerical density-dependent groundwater flow and transport modelling how transient beach morphology and regular storm floods that are typical for high-energy beaches change this classical picture of a subterranean estuary. The model results suggest that the variable beach morphology and seasonal storm floods lead to strong spatio-temporal variability of hydrodynamic and transport patterns reaching several 10th of meters into the subsurface, thereby distorting the classical salinity stratification. We believe that these findings are particularly relevant for sandy high-energy beaches which are commonly present at global coastlines.
2 DESCRIPTION
A two-dimensional cross-sectional model was set up with the USGS-software SEAWAT (Langevin et al., 2008) to simulate the groundwater flow and transport processes along a cross-shore transect of a subterranean estuary. It is based on conditions at a high-energy beach on the barrier island Spiekeroog at the southern North Sea coast, Germany. The respective north-facing beach is meso-tidal (tidal range 2.7 m) and exposed to predominant wave directions from the north–west with mean significant wave heights of 1.4 m (Herrling & Winter, 2015). The model builds on previous modelling efforts at the site (Beck et al., 2017; Grünenbaum et al., 2020a). The model extends in north–south direction from the dune base to the sea and from the surface to the aquifer base. The grid discretization is 2 m in horizontal direction. Vertically, the model extents from 3 m above to 40 m below mean sea level (base of aquifer), with a discretization of 0.5 m except for the top model layer which has a thickness of 4.5 m, encompassing the intertidal zone. This was important to avoid the MODFLOW/SEAWAT-specific numerical complications that could arise during frequent drying and re-wetting of model layers in phreatic transient aquifer simulations when the groundwater level considerably varies with time. Also, it was done to allow to introducing the effect of dynamic morphology without the need for a step-wise/transient re-gridding of the model domain (see below). Note that the vertical hydraulic gradients in the system are very small compared to the lateral gradients such that the unresolved vertical gradients within the up to 3 m thick saturated zone in the first layer have not much effect on the overall groundwater flow behaviour in the deeper zones.
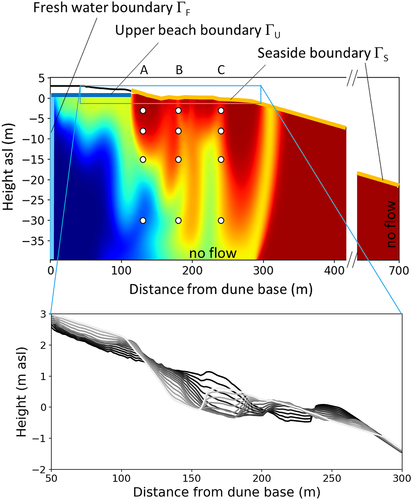
The model accounts for the topography variation over time, loosely based on linear interpolation of available topography scans from Grünenbaum et al. (2020b). A transient Cauchy-Boundary (┌S) in the intertidal zone (Figure 1 top) reflects the tide-averaged hydraulic heads depending on a time-varying morphology (Figure 1, bottom). The topography was varied step-wise in daily increments over half a year and back for the second half of the year over 20 years. The dynamic topography was not applied to the model grid. It was only used to calculate the hydraulic heads that were assigned at ┌S. The heads were calculated following the approach of Vandenbohede and Lebbe (2007) and Grünenbaum et al. (2020a), where the tide-averaged head at a given position results from (i) the height of the actual sea level when it inundates the beach surface and (ii) a constant height, that is, the respective topographic height for the time when the actual sea level is below the beach surface. More details on the boundary condition at ┌S are given in the Supporting Information S1. In addition, three annual storm floods were incorporated following the approach of Holt et al. (2019), where a recharge flux equal to the amount of water needed to fill up the unsaturated zone below the upper beach during a storm flood was applied.

At ┌F freshwater discharge is 0.5 m3/day per metre shoreline (Figure 1). The bottom and the northern boundaries are no-flow boundaries. At the upper beach, fresh groundwater recharge is 400 mm per year via a Neumann-boundary (┌U). The boundary conditions for the salt transport model are non-dispersive flux boundaries where water enters or leaves the model domain. Seawater (salinity of 35 g/L) infiltration at ┌U during storm floods is through a Neumann flow-boundary in combination with a non-dispersive transport boundary. During infiltrating conditions at ┌S a salinity of 35 g/L is defined, while during outflow, the computed concentration at the respective cells is assigned. Freshwater has a salinity of 0. Horizontal and vertical hydraulic conductivities and porosity (KH = 11 m/day, Kv = 5.5 m/day, n = 0.35) are similar to previous modelling at the site (Beck et al., 2017; Grünenbaum et al., 2020a). Longitudinal and vertical transverse dispersivities were set to αL = 2 m and αVT = 0.2 m, respectively.
The model was also applied to illustrate the effect of transient flow and transport on groundwater ages, that is, the residence times in the subterranean estuary by conducting so-called ‘direct age simulations’ following the approach of Goode (1996), where age is treated as a solute undergoing zero-order production. Along the freshwater inflow boundary at the dune base water ages increase linearly with depth from 4 to 51 years according to age dating within the islands' freshwater lens (Seibert et al., 2018).
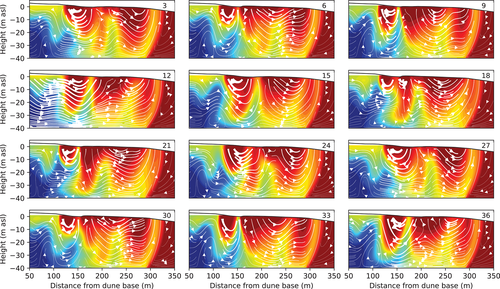
When the morphology is varied and storm floods are accounted for, simulated groundwater flow and transport patterns fundamentally differ from the classical view of a stable salinity stratification. There is not only one but multiple upper saline plumes that migrate through the intertidal zone (Figure 2, and DYNAMOD). Consequently, salinities strongly change over time with saltwater-freshwater interfaces moving through the entire intertidal zone. Flow paths are becoming very complex and flow directions and pore water flow velocities are constantly changing. Over the entire intertidal zone, discharge areas can quickly become infiltration areas and vice-versa. In the discharge areas, the discharging water does not have a constant salinity. Rather, the salinity varies dynamically from brackish to seawater salinity, depending on the actual flow field. Strikingly, snapshots from the transient salinity distribution and flow field reveal that it is not possible to deduce from the salinity patterns to the flow field and vice versa. This is in stark contrast to the classical picture of the tide affected subterranean estuary, where the flow lines are aligned more or less parallel to the salt-freshwater interfaces. This feature is lost in the dynamic morphology model.

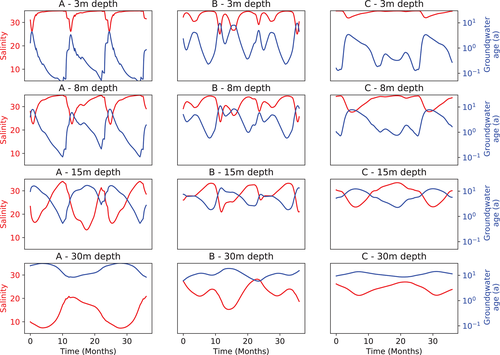
In order to further explore and illustrate the behaviour of the model, time-series of salinity and groundwater age, that is, the time that has passed since a water parcel entered the aquifer were extracted from fictive observation wells A, B and C at 3, 8, 15 and 30 m depth below sea level at three locations in the intertidal zone (Figure 1). The salinity time-series (red lines) show that values vary between locations and over time, whereby they generally decrease with depth as the freshwater proportion increases (Figure 3). The distinct peaks towards the top at position A closest to the high tide mark are to some extent an effect of the storm floods. The frequency of the salinity change appears to decrease with depth, whereas the amplitude of change increases. Note that the age displayed is a mixed age strongly affected by the proportion of (rather old) freshwater at the respective location, which is why it is mirroring the salinity time-series to some extent. Though the age generally increases with depth, it can also be relatively old at shallow depths when the respective location becomes a discharge zone. This is for example visible at 3 m depth at location B, where the mixed age almost approaches 10 years at times when the freshwater content is comparatively high. Hence, this mixed age ranges between weeks and decades in 3 m depth below ground in the model. Deeper in the subterranean estuary, the spectrum of the residence times decreases and is more in the order of decades.

The presented model is generic and simplified, and the reality is even more complex than illustrated here. For instance, waves are known to considerably affect the flow patterns in the beach subsurface (Geng et al., 2014; Geng & Boufadel, 2015; Xin et al., 2014). In groundwater flow models of the subterranean estuary the average wave setup is typically introduced by closed-form approximations (Nielsen, 2009) and added to the tide-resolved sea-side boundary condition (Wu et al., 2017; Xin et al., 2014). However, this was mostly done for idealized, that is, constantly sloping beaches rather than undulating beach shapes including runnel and ridge structures, which, however, are typical for meso- and high-energy conditions as studied in here. The runnel and ridge structures complicate the wave-patterns in the intertidal zone and it is likely that they have a shielding effect and dampen the wave amplitudes. Thus, the intertidal zone is presumably characterized by highly variable wave conditions which are difficult to quantify a priori. In addition, variably saturated flow in the high tide area and swash zone further complicates the seawater infiltration process and thus the subsurface flow patterns (Geng et al., 2017). However, even though wave-setup and variably saturated flow processes were neglected in the present study, we believe that the complicated and highly transient flow and salinity patterns demonstrated by the model are realistic for subterranean estuaries at high-energy sites.
ACKNOWLEDGEMENTS
The idea for this illustration evolved in the course of the BIME project (‘Assessment of ground- and pore water-derived nutrient fluxes into the German North Sea—Is there a, Barrier Island Mass Effect?’ funded by the Ministry for Science and Art (lower Saxony), VW ZN 3184 MWK and in preparation of a follow-up project. We would like to thank our colleagues for continuous and fruitful discussions on subterranean estuary research, namely S. Ahmerkamp, J. Ahrens, M. Beck, P. Böning, H. J. Brumsack, J. Degenhardt, T. Dittmar, C. Ehlert, B. Engelen, N. Grünenbaum, T. Holt, M. Holtappels, K. Lettmann, H. K. Marchant, D. Meier, M. Müller-Petke, J. Niggemann, K. Pahnke, V. Post, A. Reckardt, B. Schnetger, K. Schwalfenberg, S. Seibert, H. Simon, J. Sültenfuß, V. Vandieken, H. Waska, C. Winter, O. Zielinski. All model input files, including python-scripts for pre- and post-processing are provided in the Supporting Information. Open Access funding enabled and organized by Projekt DEAL


