Characterizing the variability of transit time distributions and young water fractions in karst catchments using flux tracking
Funding information: National Key Research and development Program of China, Grant/Award Number: 2016YFC0502602; National Natural Science Foundation of China, Grant/Award Numbers: 41571130071, 41971028; UK Natural Environment Research Council, Grant/Award Number: NE/N007468/1
Abstract
Hydrological and biogeochemical processes in karst environments are strongly controlled by heterogeneous fracture-conduit networks. Quantifying the spatio-temporal variability of water transit time and young water fractions in such heterogeneous hydrogeological systems is fundamental to linking discharge and water quality dynamics in the karst critical zone. We used a tracer-aided conceptual hydrological model to track the fate of each hour of rain input individually. Using this approach, the variability of transit time distributions and young water fraction were estimated in the main landscape units in a karst catchment of Chenqi in Guizhou Province, Southwest China. The model predicted that the mean young water (i.e., <~2 months old) fraction of ground conduit flow is 0.31. Marked seasonal variabilities in water storage and hydrological connectivity between the conduit network and fractured matrix, as well as between hillslopes and topographic depression, drive the dynamics of young water fraction and travel time distributions in each landscape unit. Especially, the strong hydrological connectivity between the land surface and underground conduits caused by the direct infiltration through large fractures and sinkholes, leads the drastic increasement in young water fraction of runoff after heavy rain. Even though the contribution of young water to runoff is greater, the strong mixing and drainage of small fractures accelerate the old water release during high flows during the wet season. It is notable that the young water may sometimes be the most contaminated component contributing to the underground conduit network in karst catchments, because of the direct transfer of contaminants from the ground surface with rain water via large fractures and sinkholes.
1 INTRODUCTION
Karst regions cover 12% of the Earth's surface and are the main source of potable water for more than 25% of the world's population (Ford and Williams, 2013). Because of the unique nature of karst geology and geomorphology, and characteristic features such as vertical shafts, underground conduits and sinkholes, the spatial heterogeneity of drainage systems is high compared to non-karst areas. The complex subsurface mixed-flow systems in karst groundwater systems include low velocity flows within the matrix and small fractures, and high velocity flow within large fractures and conduits (White, 2007; Worthington, 2009), which lead to a highly dynamic spatio-temporal variability of hydrological processes (Bakalowicz, 2005; Ford and Williams, 2013; Hartmann et al., 2014a). Cockpit karst terrain, encompasses “hillslope - depression” flow systems that account for about 73% of the southwest karst area of China. In karst catchments in cockpit terrain, variation in the hydrograph at hillslope springs is generally sharper than that at downstream catchment outlets, due to the thinner soil layer and presence of epikarst on hillslopes (Zhang et al., 2013). However, high sinkhole densities and outcropping fractures distributed in low-lying depression areas can facilitate direct recharge to underground conduits from surface flows, resulting in drastic changes in hydrographs at catchment outlet after heavy rain (Zhang et al., 2017). The contrasts in the architecture of the critical zone significantly affect variations in hydrological connectivity between the main hillslope and depression topographic units, as well as between different porous media in any landscape units.
Transit time distributions (TTD) are fundamental characteristics of catchment hydrological function, which can indicate the dynamics of water movement and solute transport in watersheds (Kirchner et al., 2000; McDonnell and Beven, 2014). The TTD gives conceptual, integrated understanding of the nature of flow paths that transform precipitation inputs (e.g., rainfall, snowmelt) to runoff at the catchment outlet, and their associated temporal dynamics. The young water fraction (Fyw) is the fraction of water with transit times between zero and a young water threshold (typically 2–3 months). This has recently been proposed as a more reliable and stable descriptive metric of the TTD for spatially heterogeneous and non-stationary conditions by Kirchner (2016a, b).
Currently, there are two main broad approaches for water transit time distribution and young water fraction estimation: time-invariant and time-variant approaches. Although it is difficult for time-invariant approaches (e.g., lumped convolution approaches) to constrain the spatial variation of flow transit times and water age distributions within a catchment, the influence of climate and landscape properties can also be assessed by catchment inter-comparison of the mean transit time (MTT) and Fyw. For example, comparison of MTT determined by lumped methods across a range of environmental gradients catchments, Hrachowitz et al. (2009, 2010) and Heidbüchel et al. (2013) helped disentangle the relative influence of controls due to meteorological conditions and watershed characteristics (e.g., drainage density, topographic wetness index, soil cover and storage capacity, antecedent moisture conditions and precipitation event characteristics) on stream water ages. Similarly, the relationships between Fyw and terrain, soil, and land-use indices, as well as the precipitation characteristics have been examined in 22 Swiss catchments (von Freyberg et al., 2018). In addition, Jasechko et al. (2016) calculated the Fyw of streamflow of 254 relatively large catchments around the world, and they found there is no significant correlation between Fyw and annual rainfall, but there is an inverse correlation with the average topographic gradients inferring deeper vertical infiltration in steeper catchments. However, the time-invariant approaches have limitations for estimation of travel/residence time for complex flow systems experiencing non-steady state hydroclimatic variability, due to the inherent assumptions which ignore catchment non-stationarity and uncertainty in model fitting (Botter, 2012).
In recent years, a theoretical approach combining flow and transport processes at catchment scale through StorAge Selection (SAS) functions has been used to collapse complex transport processes into a unified framework (Botter et al., 2010, 2011; Rinaldo et al., 2015; Benettin et al., 2017). This approach can effectively characterize time-variant age distributions of catchment water storage and flux, but does not take into account the difference of water age dynamics in different landscape units. Alternatively, where transit times and water ages are tracked using tracer-aided hydrological models (e.g., McMillan et al., 2012; Hrachowitz et al., 2013, 2016; Benettin et al., 2015a; Soulsby et al., 2015a; Remondi et al., 2018), although such models are usually conceptual, they have stronger skill in capturing the spatio-temporal variability of catchment transit times and water age due to non-stationarity conditions and spatial heterogeneity. These approaches have contributed to the enhanced understanding of spatial variation in runoff generation and solute transport processes and have shown how this influences the dynamics of transit times and water ages at the catchment scale (Birkel et al., 2012; Soulsby et al., 2015a). Process-based models, with more complex structures and parameterisation, can provide more physically-based descriptions of catchment hydrological processes, and can give more integrated understanding of tracking flow transit times and water ages and analysing how hydrometeorological conditions and spatial heterogeneity may affect the TTD and Fyw (Kuppel et al., 2018a; Remondi et al., 2018). However, the high parameterisation of such models can increase uncertainty, unless detailed data on watershed states (soil moisture storage, groundwater levels etc.) and hydroclimatic inputs are available for multi-criteria model calibration, which limit the application of this method to more intensively instrumented, long-term study catchments (Kuppel et al., 2018b).
As both climate and landscape characteristics interact to determine transit times and water ages, understanding how catchment morphological properties and external hydrometeorological forcing control TTDs and water age remains challenging. Most studies are site specific and focused in humid temperate catchments, so generalization to different geographical regions is rarely possible (Burt and McDonnell, 2015; Birkel and Soulsby, 2015; Maxwell et al., 2016). However, due to the high spatial variability of the hydrodynamic properties and temporal dynamics of hydrological connectivity in the karst critical zone, the TTD and water age of catchment water fluxes have significant spatial and temporal variability (Zhang et al., 2019). Unfortunately, there is relatively little research on this issue, despite the geographical extent and global importance of karst regions. Previous research mainly focused on estimation of mean transit/residences time for specific karst springs using time-invariant method (Hu et al. 2015). Hartmann et al., (2014b) simulated the time-variant transit time distributions of an Austrian karst system using a semi-distributed model. However, these studies considered entire karst basins. There is a need to understand the heterogeneity of TTDs and Fyw of water fluxes in different geomorphological units (e.g., hillslope and depression) or different mediums (e.g., dual flows in within the matrix and conduits) within karst landscapes, which are crucial for the understanding the interactions of hydrological processes and water quality in drainage waters.
To help address the general research gaps in karst catchments, our overall objective is to understand the spatio-temporal variability of water transit time distributions and young water fractions in karstic hydrogeological systems, and the associated controlling effects of hydroclimatic conditions and architectures of karst critical zone. More specifically in this study, we sought to address two questions: (a) How can we characterize the time-variant transit time and water age distributions in the main compartments of the complex karst landscape using a tracer-aided conceptual model? (b) How do transit time and water age distributions vary under different wetness conditions and architectures of karst critical zone; and what are the associated storage-connectivity dynamics?
2 SITE AND METHODOLOGY
2.1 Study catchment
Chenqi catchment is located in Puding County, Guizhou Province, southwest China, it has an area of 1.25 km2 (Figure 1). Chenqi has characteristic cockpit karst terrain, with contrasting landscape units of elevated hillslopes and low-lying depressions (Zhang et al., 2011, 2013; Chen et al., 2018). Chenqi is drained by a single underground conduit, which links to three sinkholes located in the depression area. Mean annual rainfall and temperature are 1,140 mm and 20.1°C, respectively. The wet season runs between May and September and the dry season follows between October and April. The average monthly humidity ranges from 74 to 78%.
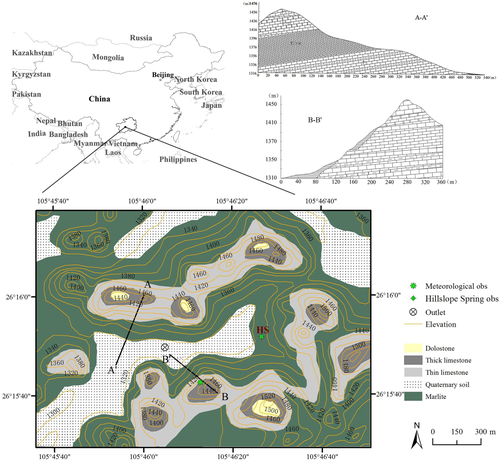
The aquifer system at Chenqi consists mainly of limestone (including thick and thin limestone), and some other lithologies, for example, dolostone and marlite. The limestone is about 150–200 m thick, with high densities of karst fissures and conduits. Marl embedded in the limestone forms the main impervious bed of karstic aquifer, which usually block further infiltration of vertical drainage and promote lateral flow in large fractures or conduits. Due to the thin soil layer and fractured rock zone (epikarst), the permeability is very high, resulting in limited surface runoff except after heavy rain (Peng and Wang, 2012). On hillslopes, the Quaternary soil depth is less than 30 cm. The epikarst decreases with altitude on the hillslopes with the thickness less than 5 m (Zhang et al., 2011). By contrast, the soil and epikarst in depression are much thicker. The deciduous broad-leaved forest and shrub are at the top and middle of the hillslope, respectively. The crops, including rice paddies and corn, are in the depression with the thicker soil layer.
Discharges is measured at the catchment outlet (in an underground conduit) and at a hillslope spring (HS) at the foot of the eastern steep hillslope (Figure 1). At the two observation points, the flow is sampled hourly for hydrogen and oxygen isotopes analysis. An automatic weather station is located at the southern hillslope, which records precipitation, air temperature, wind, radiation, air humidity and air pressure. Hourly precipitation samples are also collected during rainfall events.
2.2 Sine-wave approach for estimating the young water fraction
 (1)
(1) (2)
(2) (3)
(3) (4)
(4)Then Fyw equals the amplitude ratio As/Ap, and the threshold age for Fyw is 0.189 years (69 days).
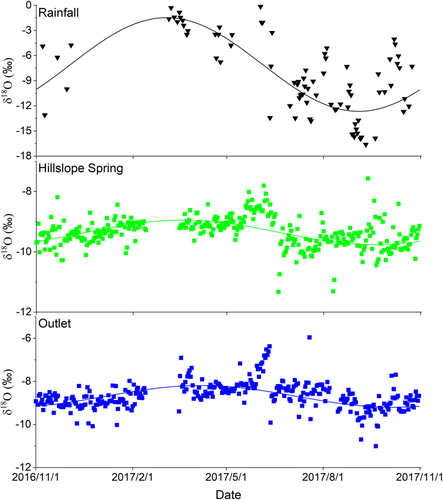
Accordingly, we fitted sine waves to the daily precipitation and streamflow isotope data, from November 2016 to October 2017, at the hillslope spring and catchment outlet (in Figure 1) using iteratively reweighted least squares (IRLS), with rainfall/discharge-weighting. The significance level for correlations was 0.05.
2.3 Tracer-aided model and water dynamics tracking
The model was based on a generic structure initially developed to simulate catchment-scale water and solute transport (Mg and Ca) for at different scales in the karst critical zone (Zhang et al., 2017).The structure was subsequently improved by sub-dividing the landscape into hillslope and depression landscape units, and stable isotopes were also added to simulate the flow and conservative tracer dynamics in karstic critical zones (Zhang et al., 2019). This improved tracer-aided model can also track the water ages in different landscape units, which links hydrological connectivity to water storage. Here we were able to use the improved tracer-aided model to characterize the transit time and water age distributions. The detailed descriptions of the model can be found in an earlier paper (Zhang et al., 2019), and only the general features of the model structure and essential evaluations are summarized in this study.
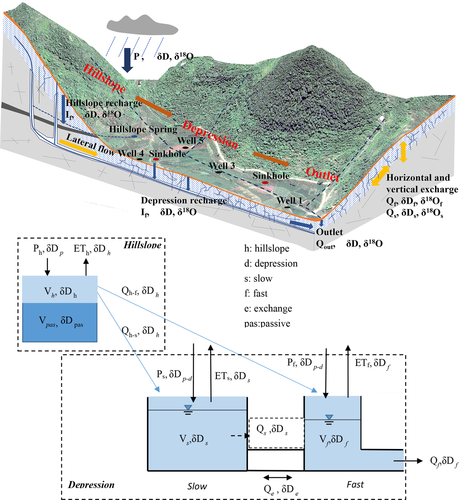
As shown in Figure 2, the karst catchment is disaggregated into two dominant landscape units of hillslopes and depressions. In the depression unit, the karst critical zone is conceptualized as two connected reservoirs; “fast” and “slow” flow reservoirs, which represent the dual porosity systems of matrix blocks/small fractures with low permeability and underground conduit network with high permeability, respectively (Hartmann et al., 2014a). These two connected reservoirs in the model are used to simulate the water and tracer dynamics in the depression unit. Conversely, the karst critical zone in the hillslope unit is conceptualized as one reservoir (Figure 2).
 (5)
(5) (6)
(6) (7)
(7)In the model, the actual evapotranspiration is estimated using the parameter of conversion constant (0.76 for this catchment from Xue et al., (2019)) and the potential evapotranspiration derived from Penman formula. All the items in the water balance equations are represented using water amount (in m3). Therefore, the amount of precipitation infiltration and evapotranspiration for the hillslope and depression are controlled by corresponding areas identified using GIS. Then the precipitation input and evapotranspiration amount for the depression are partitioned to slow and fast reservoirs according to the ratio coefficient of rainfall recharge (a in Table 1). Linear and exponential relationships between the reservoir storage V and flow discharge Q are used to calculate the discharge for slow/fast reservoirs in depression and hillslope, respectively. These are determined by the corresponding flow constant for each reservoir (w, Ks and Kf in Table 1). Flow from the hillslope is then assigned to slow and fast reservoirs in depression according to the coefficient of hillslope lateral flow (b in Table 1). Darcy law is used to estimate the exchange flow between the slow and fast reservoir in depression that depends on their difference in water levels relating the reservoir storages; this uses two parameters, an exchange constant between the two reservoirs and the ratio of porosity of the quick to slow flow reservoir (Ke and f in Table 1, the mathematical formula is in Zhang et al., 2017). The direction of exchange flow depends on the hydraulic gradient between the two reservoirs, which allows the model to simulate the bidirectional flux exchanges between fractured matrix and ground conduits; a unique feature of the karst critical zone (Zhang et al., 2017).
| Coefficient | Initial range | Final range (mean) | Descriptions |
|---|---|---|---|
| K s (hour−1) | 40–150 | 48–120 (92) | Flow constant for slow flow reservoir |
| K f (hour−1) | 1–40 | 5–18 (11) | Flow constant for fast flow reservoir |
| K e (hour−1) | 800–2,200 | 1,000–2000 (1549) | Exchange constant between the two reservoirs |
| f | 0.008–0.025 | 0.01–0.02 (0.015) | The ratio of porosity of the quick to slow flow reservoir |
| a | 0.47–1 | 0.51–0.9 (0.68) | Ratio coefficient of rainfall recharge |
| w | 0–0.015 | 0.003–0.01 (0.005) | Flow constant for hillslope unit |
| b | 0.48–1 | 0.5–0.62 (0.54) | Coefficient of hillslope lateral flow |
| Is | 0–0.8 | 0.002–0.6 (0.24) | Coefficient for evaporation fractionation |
| α (×104) | 0.8–1.6 | 1–1.5 (1.26) |
Constant for calculation of rainfall recharging the active store in hillslope |
| β | 0–1 | 0.02–0.95 (0.49) |
|
| φ | 0–1 | 0.04–0.97 (0.56) | Coefficient for exchange flow between active and passive stores in hillslope |
| τ | 0.5–1 | 0.71–0.93 (0.82) | Weighting constant |
 (8)
(8) (9)
(9) (10)
(10) (11)
(11) (12)
(12) (13)
(13)The coupled flow-tracer model was calibrated to hourly discharge and isotope ratio data at the catchment outflow. The modified Kling–Gupta efficiency (KGE) statistic was used as the calibration objective function. The KGE values for discharge and δD signature were combined to formulate a single goodness of fit measure, as KGE = KGEd + KGEi)/2. Additionally, comparison of the simulated and measured discharge and δD signature of the hillslope spring and δD signature of wells in depression were used as a “soft” validation of the simulations (Zhang et al., 2019).
A total of 12 model parameters were calibrated using a Monte Carlo analysis, as well to provide an indication of the modelling uncertainty from the spread of simulations from the final parameter set (Table 1). The calibration procedure involving two iterations is similar to the recommendation of Birkel et al., (2010). In the first iteration, a total of 105 random samples were used out to select parameter values. After simulations with these parameter combinations, the parameter ranges for the second iteration were derived by discarding all parameter sets with KGE < 0.3. Then another 105 parameter combinations within the constrained parameter ranges were randomly generated for further simulations. The final 500 best parameter combinations were retained and used for subsequent analysis (Table 1).
The results in the earlier paper showed that this model could capture the flow and tracer dynamics within each landscape unit quite well (Zhang et al., 2019). The performance in the simulation of discharge and isotope was satisfactory, and the objective function values of the combined KGE were all greater than 0.65 for the best 500 parameter sets, with a maximal value of 0.72 and the mean of 0.7. The mean of KGEQ and KGEi were 0.85 (0.81–0.87) and 0.56 (0.52–0.59). Therefore, the tracer-aided model provided a useful tool to track the fate of each hour rainfall from entering to leaving catchment, deriving the transit time and water age distributions in different karst landscape unit.
The procedure for estimating the young water fraction and transit time distribution in each landscape unit was recommend by Remondi et al. (2018): (a) the rain water from each rainfall hour was uniquely labelled with a specific tracer concentration; (b) then the tracer-aided model with the calibrated parameters was run multiple times in parallel, tracking the variation in each tracer concentration through time in each conceptual water store, which means the fate of rainwater from each rainfall hour is tracked; (c) based on the model results, the transit time distribution and water age distribution of water flux were estimated for each conceptual water store. In this study, a total of 892 rainfall hours during the study period of November 11, 2016 to October 31, 2017 were separately tracked.
3 RESULTS
3.1 Young water fraction of water fluxes in different landscape units
The Fyw of water fluxes from the different landscape units were tracked using the tracer-aided model and calibrated parameter sets (Figure 3). The simulated mean Fyw were 0.39, 0.31 and 0.10 for the hillslope unit, fast flow and slow flow reservoirs during the study period. The seasonal differences in Fyw are significant for all the conceptual stores. The mean Fyw of water flux increased between the dry and wet seasons: ranging from 0.30, 0.07 and 0.03 for the dry season (December to the next April) to 0.48, 0.54 and 0.17 for the wet season (May to October), for the hillslope unit, fast flow and slow flow reservoirs, respectively. The mean Fyw of runoff at the catchment outlet (fast flow reservoir) was mainly affected by the varying contributions of the major water sources in different seasons. In the dry season, a high proportion of flow was contributed by the slow flow reservoir to the runoff at the catchment outlet (the largest proportion was 78.4% from Zhang et al., 2019) leading to the low Fyw of runoff at catchment outlet. In the wet season, the Fyw of runoff had increased significantly because the hillslope unit contributes much more water to runoff at the catchment outlet (57.5%), which was much younger than the water in the slow flow reservoir.
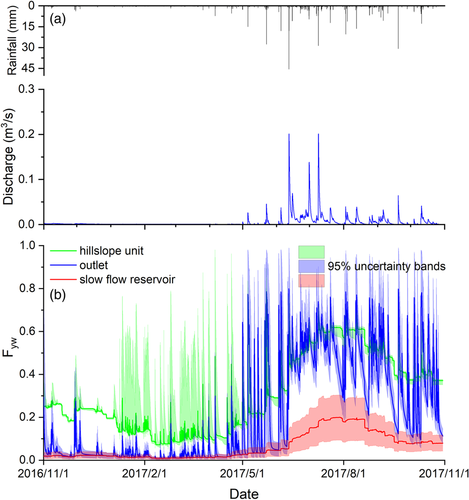
There is a noteworthy phenomenon that the mean Fyw of the water flux in the hillslope unit was higher than that at the catchment outlet in the dry season (0.30 vs. 0.07), but it was reversed in the wet season (0.48 vs. 0.54); this is likely to be due to the impact of outcrop fractures and sinkholes in the lower catchment. During heavy storm events, overland flow and rapid epikarst drainage were generated by high intensity rainfall and directly routed via sinkholes and large fractures to recharge the underground stream network and sustain catchment outputs. After this influx of younger water, the Fyw to the catchment outlet increased rapidly, and therefore was higher than the hillslope unit during the wet season. The Fyw of both flow in hillslope unit and catchment changed significantly during rainfall events, especially during the wet season. For example, the Fyw of flow from hillslope unit and catchment outlet rose from 0.5 to close to 1 (Figure 3).
We also calculated Fyw of runoff using sine-wave approach proposed by Kirchner (2016a). Although this methodology has been successfully used at a number of sites (e.g., Jasechko et al., 2016; Song et al., 2017; Lutz et al., 2018; von Freyberg et al., 2018), it has not been widely tested for karst catchments due to the lack of data and high spatial heterogeneity. The seasonal cycle amplitudes As and Ap in Equations (1) and (2) were determined according to the sinusoidal fits (Figure 4), and the sine regression models of precipitation and runoff at the hillslope spring and catchment outlet were all statistically significant (p < .00001). Using this approach, the Fyw for the hillslope spring and catchment outlet were 0.07 and 0.09, respectively. Although the sine regression was statistically significant for daily stable isotope values of rainfall, runoff at the hillslope spring and catchment outlet, the values obtained by sine-wave method were notably smaller than those determined by tracer-aided model tracking (0.39 and 0.31 for hillslope and outlet).
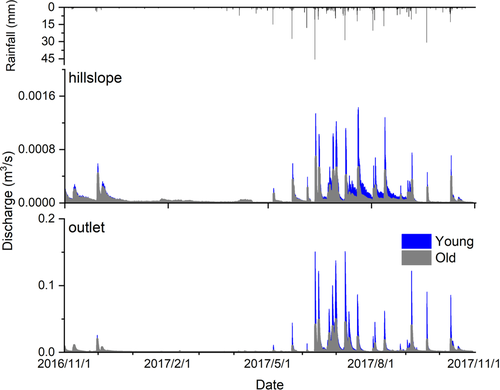
Based on the Fyw calculated by flux tracking using the tracer-aided model, the discharge of “old water” (i.e., with and age > 69 days) were estimated for hillslope and catchment outlet (Figure 5). The model results indicate that more rapid turnover of old water occurs in the wet season, although the Fyw in wet season is obviously higher than in the dry season (Figure 3b). The mean discharge of old water was 7.8 × 10⁻⁴ and 3 × 10⁻⁵ m3/s for the hillslope and catchment outlet, respectively, during the dry period; and was 3.9 × 10⁻³ and 5.8 × 10⁻⁵ m3/s for the wet period. This indicates that in the rainy season, the young water (rain) enters soil and/or fractures/conduits and increasingly begins to displace the old water. These results are consistent with the reasoning by Harman (2019), that the old water release may be accelerated by high discharge or catchments wetness.
3.2 Seasonal inter-relationships between storage and the young water fraction
There is a marked seasonal variability in density distributions of Fyw for the three conceptual stores (Figure 6a, b). Due to the thin soil layer and epikarst on the hillslopes (Zhang et al., 2013), even small rainfall events can lead to sharp increases in Fyw in the hillslopes The probability density distributions of Fyw show that water fluxes in the hillslope unit and the catchment outlet (from fast flow reservoir) have much more pronounced changes compared to the slow flow reservoir for each month during the dry period (Figure 6a). The high proportion of water contributions from the slow reservoir to the catchment outlet caused the similar mean Fyw (<0.05) for these two conceptual stores, although their density distributions are notably different over the dry season due to contrasting responses to low rainfall infiltration. In each month during the wet period, the mean Fyw of water flux from the hillslope unit was higher than from the outlet and slow flow reservoir, and also had the largest variation (from approximately 0 to more than 0.9 in Figure 6b).
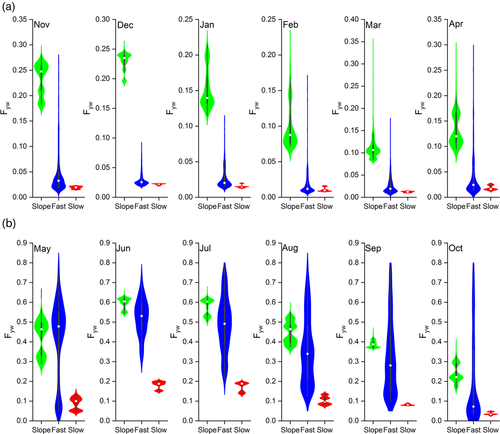
The mean of the Fyw and its variability demonstrate that the dominant water source of runoff at the catchment outlet has a controlling influence on the Fyw in the water flux from the catchment. During responses to rainfall in the dry period, slow flow in the matrix or small fractures contributes a high proportion of older water to the underground channel at the catchment outlet, resulting in the low Fyw of the catchment outlet. Meanwhile, hillslope flow and direct rainfall recharge occasionally contribute to the outlet for some of the small rainfall events, resulting in the great changes of Fyw at the catchment outlet. After heavy rain, the hillslope unit and direct rainfall recharge become the main water sources to the underground channel runoff, which can displace a large proportion of older water in the slow flow reservoir. Hence, the Fyw of water flux for the outlet became very high (Figure 6).
Figure 7 shows the respective modelled relationships between the Fyw of water fluxes and the storage of the hillslope unit, and the fast and slow flow reservoirs. For the hillslope unit, when storage was low for most rainfall events in the dry season, the Fyw of water flux usually increases sharply above a specific water storage, giving marked hysteresis (Figure 7a). Below the specific water storage, small rainfall amounts can rapidly recharge the aquifer, and substantially increase the relatively small hillslope storage. Furthermore, as there is no additional young water to maintain recharge of the hillslope unit once rainfall stops, there is a rapid decline in Fyw. Under higher storage conditions (in the wet season), the Fyw of water flux tends to be a significant linear increase with storage over a prolonged time.
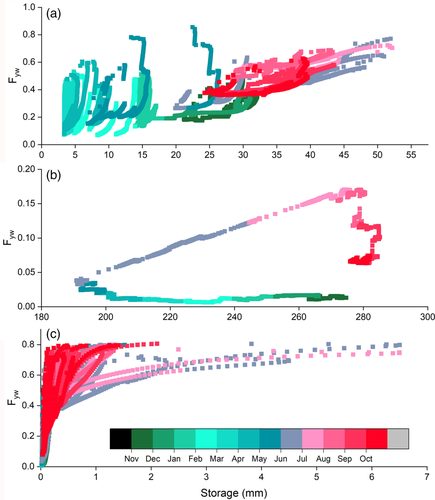
For the slow flow reservoir, there was a strong season hysteretic pattern of Fyw of modelled flux versus water storage (Figure 7b). During the dry period, water stored in small fractures is released to the underground channel without inputs of young water in rainfall. Therefore, the Fyw nearly stayed constant between November and April (<0.05), with the steady decrease in storage (from approximately 280 to 200 mm). During the wet season (May to August), the Fyw increased linearly with the increase in water storage, because of consecutively new rainwater recharge. In the later rainfall period (September and October) when the slow flow reservoir storage reaches the highest, there was a little change in storage with the gradually aging water (Figure 7b), mainly sustained by the hillslope unit (Zhang et al., 2019).
For the fast flow contributions to catchment outflows, there was a large variation in Fyw of water flux (from approximately 0 to 0.8) because water storage in the fast flow reservoir (conduits) was low (Figure 7c). Particularly, the very narrow range of water storage (<1 mm) for the low Fyw indicates that variation in the outlet Fyw is caused by some fast flow (young water) that effectively short-circuits storage, as shown by the sharp increases of the hillslope flow in the dry period. As the Fyw becomes high, the band of water storage increases, which corresponds to the linear relationship between the Fyw and storage during the wet season (Figure 7a, b). This means that much more young water (high Fyw) from the hillslope unit and direct infiltration of rainfall fills the underground channel, and then quickly mixes with or displaces the older water at the catchment outlet. During the wettest periods when the Fyw becomes highest (e.g., >0.7), a marked increase in storage occurs, however the Fyw sometimes did not increase dramatically. This means that after large quantities of young water from the hillslope unit and direct rainfall infiltration (via sink holes) simultaneously drain into the underground channel in wet time, the fast flow reservoir has been almost filled with young water even though the storage changes with the rise and decline of hydrographs.
3.3 Time variance of the water age and travel time distributions
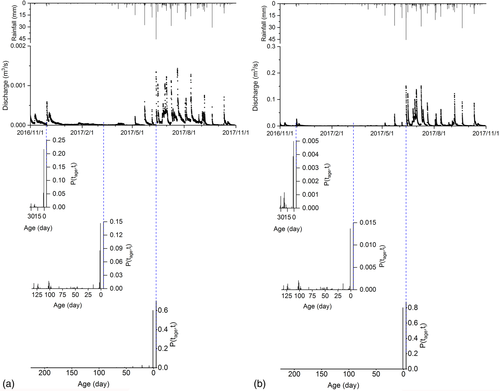
The probability density functions (pdfs) of travel and residence times can provide insight into transport dynamics at the catchment scale (Botter, 2012). The water age pdfs of runoff at outlet of hillslope unit and the catchment (reflecting the integration of the residence times of the contributing water storages) are drawn from a series of tracer-aided model simulations where the water dynamics in each conceptual store are driven by rainfall input over specific periods (Figure 8). In this study, three times were chosen (t1: November 30, 2016; t2: March 11, 2017 and t3: June 12, 2017) for estimating the water age pdfs of runoff. These specific times reflect dry conditions (March 11, 2017), wet conditions (June 12, 2017) and the midpoint (November 30, 2016) of the study period (the rainfall and discharge characteristics at each time at the hillslope and outlet are shown in Table 2). The results in Figure 8 show noticeable differences among the water age pdfs corresponding to the three different periods. The water age pdfs show a series of pronounced spikes reflecting the impact of the rainfall input within the catchment (shown in Figure 8). In the dry period, the water age of outflow from the hillslope store and catchment outlet is dominated by the release of old water. For example, the youngest water with the age of 0 day (the rainfall water converting to outflow on the same rain day) only accounts for 21 and 0.5% of the total discharge at hillslope and catchment outlet on November 30, 2016. In contrast, the probability of a water age of 0 days was 60 and 80% for the hillslope and catchment outlet, respectively, on June 12, 2017. The time variability in pdf of runoff water age indicates a strong and direct effect of precipitation and storage conditions on the shape of individual water age pdfs, both of which affect the time of water exiting the catchment. It is particularly noticeable that the differences in water age pdfs between dry and wet season for runoff at the catchment outlet are much larger than for the hillslope. For example, the probabilities of a water age of 0 days are 21 to 60% for the hillslope but 0.5 to 80% for the catchment outlet, in dry and wet season. The high storage capacity of the slow flow reservoir in the depression in dry periods can accommodate most rainwater, leading to older water flowing out of the catchment quickly. However, during the wet period, substantial proportions of high intensity rainfall recharge the large fractures and conduits. Therefore, most young water flows out of the catchment through the hydrologically connected flow paths between the hillslope and underground channel, or via sinkholes/large fractures increasing the young water fraction of runoff significantly (Figure 8).
| Site | Hillslope | Outlet | ||||
|---|---|---|---|---|---|---|
| Time | 30/11/2016 | 11/3/2017 | 12/6/2017 | 30/11/2016 | 11/3/2017 | 12/6/2017 |
| Rainfall (mm) | 3.9 | 0.4 | 45.6 | 3.9 | 0.4 | 45.6 |
| Discharge (m3/s) | 0.0006 | 0.00001 | 0.0013 | 0.026 | 0.0004 | 0.151 |
Figure 9 shows the forward-projected transit time distribution (TTD) of rain water entering the catchment on the three dates considered in Figure 8: this shows the distribution of how long rainfall entering the system at the reference time of ti (i = 1, 2, 3 in Figure 9) will spend transiting through the system before it reaches the outlet (Benettin et al., 2015b). The difference among the three transit time pdfs again highlights the effect of time-variance on the transport dynamics emerging at the catchment scale as a result of successive rainfall inputs. Each transit time pdf corresponding to the three start times is multimodal, with more or less pronounced peaks whose magnitudes are strongly synchronous with the hydrologic dynamics. In addition, the temporal evolution of the hillslope and catchment outlet flows (Qh and Q, respectively), are evidence of the correlation between the position of the transit time pdf spikes and the occurrence of the flood events (Figure 9). The results show that the TTD of infiltrating rain water is affected by the discharge (reflecting the displacement of storage in corresponding conceptual stores). When there was a flood, this part of “old” water stored in the aquifer is displaced in large quantities at high discharge rates (the peaks of pdf in July and August in 2017 shown in Figure 9a, b).
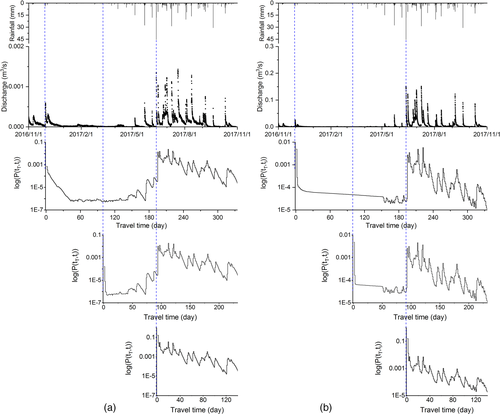
Although the MTT cannot be calculated from the simulation results due to the short simulation period (only 1 year), the catchment and hillslope unit controls on the inflow water can be evaluated from the transit time pdfs. For the dry conditions (March 11, 2017) with the rainfall of 0.4 mm, only 6% of inputs rain water exited the catchment through the conduit over the period from this rain day to the end of the simulation time, a total of 233 days. For the midpoint of this study period (November 30, 2016) with the rainfall of 3.9 mm, the same percentile of 6% of inputs rain water exiting the catchment took 225 days. For the wet conditions (June 12, 2017) with the rainfall of 45.6 mm, 16% of inputs rain water exited the catchment on that day, and 6% of inputs rainfall water exiting the catchment only took about 3 hr. The results indicate that most of water entering in dry periods (mainly after the light rains) is stored in the catchment for a long time with high mean transit time. In contrast, in wet periods a considerable proportion of new water will exit the catchment in a short time. The patterns of the transit time of outflow from the hillslope unit are similar to the catchment; 6% of inputs rainfall water exiting the hillslope unit took 203, 106 and about 0.1 days, respectively.
4 DISCUSSION
4.1 Simulating water age dynamics in karst catchment using a conceptual model
Characterizing water age dynamics is fundamentally important to deepen our understanding of catchment function, especially in karst catchments with their unique, complex critical zone architecture of multi porous media. However, time-invariant (lumped) approaches are particularly difficult to justify in karst catchments due to the predominance of non-steady-state conditions and non-stationarity of water ages. In addition, most continuous hydrological and tracer measurements are at the catchment outlet or at specific spring/wells in karst studies. This limits the assessment of spatial variation in water age by comparing the MTT or young water fraction determined by lumped methods across different environmental gradients landscape units. In contrast, the process-based model used here can give clear insight in hydrological processes and estimates of water flux ages, the model should be transferable to other karst areas, though detailed data are needed to do so. Many papers have demonstrated the utility of tracer-aided conceptual models using isotope “fingerprints” to infer flow paths, catchment storage, hydrological connectivity and flux ages (Benettin et al., 2015a; Soulsby et al., 2015a; Remondi et al., 2018; Kuppel et al., 2018a). This approach has already shown a superior performance in tracking water fluxes and ages, and assessing the influence of catchment storage and hydrological connectivity in karst catchments by Zhang et al., 2019. Therefore, the tracer-aided conceptual model (time variant approach) presented provides a new tool for characterizing the water age dynamics of fluxes within different karst landscape units, which could be more widely tested.
We also calculated the Fyw using the sine-wave method with daily isotope data in this study, which shows an underestimation in mean Fyw both for catchment and hillslope unit (Figure 4). The uncertainty of the sine-wave fitting method for Fyw has been discussed in other studies. For example, Stockinger et al., (2016) found that the tracer sampling frequency markedly influenced estimation of Fyw, and weekly isotope tracer data lack sufficient information about faster water transport mechanisms in the catchment. However, the daily isotope tracer data used in some Fyw calculations (Stockinger et al., 2016; Song et al., 2017) is also less well-suited for determining Fyw using the sine-wave approach in highly responsive karst catchments, because it fails to capture the crucial sub-daily variability in rainfall isotope signatures at a resolution appropriate to the response times of sub-tropical karst systems (Coplen et al., 2008). Therefore, for such environments, there is high uncertainty using the sine-wave approach with relatively low-frequency measurements of tracer behaviour collected daily or weekly, to calculate the Fyw of runoff in catchments with rapidly variable flow dynamics, although it can reflect the seasonal tracer cycles. This remains a significant challenge in applying this method to determine the Fyw in karst areas, because of the high cost of long-duration, continuous sampling at sub-daily, even hourly resolution. In contrast, the calibrated tracer-aided model using a shorter time series of high temporal resolution data allows us to examine the rapid variations in water age distributions of different internal fluxes in karst critical zone.
4.2 Influence of hydrological connectivity on Fyw in karst critical zone
Although much recent research has focused on estimating the mean annual Fyw (von Freyberg et al., 2018; Wilusz et al., 2017) and short-term responses of Fyw to changes during precipitation events, the influence of storage (i.e., catchment wetness) and/or discharge on such catchment dynamics is less clear (Kirchner, 2016b; Lutz et al., 2018; von Freyberg et al., 2018; Wilusz et al., 2017). In essence, temporal changes in hydrological connectivity, driven by storage dynamics, directly lead to changes in the Fyw of runoff. In karst environments, the change in hydrological connectivity and its impact on the Fyw is particularly pronounced. During the dry period, less young water from rainfall and hillslope contributes to underground conduit leading to weak hydrological connectivity between them, which causes the low Fyw at the catchment outlet. The Fyw of water fluxes increases as hydrological connectivity between the hillslope and depression is strengthened during the wet period. Compared to non-karst basins, the dramatic variation of Fyw in a short time is striking for both dry and wet seasons in a karst catchment, for example, Fyw rose from approximately 0.2 to approximately 0.9 in several hours (Figure 3). This is due to the highly permeable epikarst with thin soil layer cover leading rapid infiltration from surface to ground conduit networks after rain. The concentrated infiltration from surface to underground flow systems via sinkholes is a unique phenomenon in karst catchments, which leads the Fyw at catchment outlet change from a low value (e.g., lower than 0.1) to near 1 in a short time after heavy rain (Figure 3). In this sense, karst catchments perhaps have more income with the preferential drainage of urban catchments, than those with a less disturbed subsurface (Soulsby et al., 2015b; Bonneau et al., 2017).
In addition, the bidirectional flow exchange between matrix/small fractures and conduits controlled by their respective water levels, is another unique feature of karstic critical zone (Zhang et al., 2017). When the older water from the matrix enters the conduits, or the young water from the conduits flows back to the matrix, the Fyw of both water stores will be changed. Although new water from the conduits has a small impact on the age of the large volume of storage in the slow flow reservoir (the Fyw of fluxes from the slow flow reservoir did not change as drastically as other conceptual stores), there is still an impact on the Fyw of water in the small fractures around the larger conduits. Even though this component of the younger entrance water will reduce the age of the water in the small fractures around conduits, the latter have the potential to be contaminated, which may have implications for water quality studies.
In addition, the high Fyw is likely related to cleaner water sources in hillslope draining non-agricultural forest and shrubs (Xiao et al., 2013) or surface contaminants in the lowland depression derived from agriculture (e.g., nitrogen). Hence, it is important to assess the role of hydrological connectivity and quantify its influence on the Fyw in the karst critical zone and associated interactions with biogeochemical processes.
4.3 The turnover of old water in storage
The “old water paradox” has been a focus of interest for hydrologists; this addresses the question of how catchments store water for weeks or months, but then release it in minutes or hours in response to rainfall inputs (Kirchner, 2003). This is closely related to understanding dominant streamflow generation processes and associated solute fluxes and provides insight into the difference between the velocity of water particles and the celerity of the response of hydrological systems (McDonnell and Beven, 2014). In karst catchments, the increment of young water proportion in storage and runoff is fast due to the rapid infiltration, of rainfall, consistent with the “inverse storage effect” by Harman (2015). However, the short-term rainfall-runoff dynamics (over hours) are controlled by the celerity, which mobilizes water that has usually been stored in the small fractures (slow flow reservoir) for much longer periods (months to years) but is constrained by low pore velocities. This is consistent with the findings on nutrient dynamics in karst areas reported by Yue et al., (2019), that the maximum nitrate concentrations during storm events generally lag behind peak Q, which indicates that the initial event water is low in nitrate and then sources with greater nitrate concentrations become increasingly important. Therefore, although the Fyw is notably high for runoff during rainfall events, the high discharge still resulted in large amounts of old water being drained (Figure 5). Additionally, the greater wetness leads larger flux exchanges between matrix/small fractures and large fractures (Chen et al., 2018). This indicates the strong mixing of young rain water with old stored water during and after the rainfall, even though celerity of the response of discharge to rainfall is fast. This is consistent with the results of solute dynamics in the same catchment from Yue et al., (2019) and Zhang et al., (2019). For example, the δD values at the sampling points in this catchment for the two largest rainfall events in 2017 shows that δD values at the outlet and hillslope spring are much less negative than rainwater (Table 3). Therefore, in addition to the old water released from small fractures at the beginning of rainfall event, the strong mixing also causes accelerated displacement of old water during high flows.
| Date | Rainfall amount | Rain | Hillslope spring | Outlet |
|---|---|---|---|---|
| 12/6 | 86.6 mm | −85 | −48 ~ −70 | −62 to −67 |
| 9/7 | 83.4 mm | −80 | −62 ~ −73 | −59 to −70 |
4.4 Broader implications for land and water management in karst area
The insights from this study have implications for understanding the timescales of water quality problems and their potential solutions in karst areas. Nitrogen fertilizer is the predominant contributor of nitrogen pollution in many karst catchments worldwide (Panno et al., 2001; Minet et al., 2017; Eller and Katz, 2017). Especially, in southwest China, one of the largest and continuous karst areas in the world, the agricultural activities are the main cause of aquifer nitrate pollution (Yang et al., 2013). The relationship between nitrogen concentration and discharge (C-Q) is non-uniform behaviour due to the complex hydrological properties and source heterogeneity at catchment scale (Abbott et al., 2018; Miller et al., 2016; Musolff et al., 2017). In karst catchments, the old water release from the matrix leads a constant nitrogen concentration in flow during dry season. However, the young water from relatively small rains can mobilize nitrogen sources from the ground surface or shallow soil to underground channel, because of the thin soil layer. This can cause a short-term flushing C-Q pattern at the catchment outlet in dry season (Yue et al., 2019). During the wet season, the nitrogen in discharge at catchment outlet has different C-Q patterns. The contribution of hillslopes with low concentrations (Xiao et al., 2013) to underground streamflow results in the dilution in the C-Q relationships, while the contribution of direct infiltration of rainfall increases nitrate concentrations (Yue et al., 2019; Wang et al., 2020) resulting in flushing C-Q patterns, which mainly appear after heavy rain. Stream water in non-karst areas tends to shifts between groundwater-dominant runoff sources under dry conditions and near surface under wet conditions leading the different C-Q patterns (Zhi et al., 2019). For both patterns, the velocity of pollutant transport processes is usually much slower than the celerity of hydrological response (Hrachowitz et al., 2016). In karst areas, the difference between velocity and celerity is significantly shorter than that in non-karst areas due to the high aquifer permeability.
Large labile sources of nitrogen remain on the surface of karst soils after fertilization of crops (Yue et al., 2019). When heavy rain occurs, large fluxes of nitrogen can be transported into karst aquifers, particularly by young water infiltrating due to strong hydrological connectivity between the soil surface and subsurface conduits, leading to marked increases in the nitrogen concentration of outflows (Yue et al., 2018, 2019; Wang et al., 2020). This indicates that the high Fyw of outflows may contribute disproportionately to nitrogen losses, suggesting that younger flows may be the most contaminated component in karst underground conduit flows. Young water contributes a high proportion of the total runoff in karst catchments (approximately 30%in this study), indicating that rapid flow paths can transmit large contributions of soluble contaminant inputs to streams over much shorter time periods. This is consistent with recent global scale analysis that has emphasizes the importance of young water contributions to larger rivers (Jasechko et al., 2016). However, in karst systems, due to the bidirectional flow between the fast and slow flow reservoirs, the soluble contaminant inputs to the small fractures or matrix in aquifer creates a “memory effect” of pollutant inputs that could be a significant pollutant source to streams, even if the Fyw is high, especially at the beginning of wet season. That means a significant portion of nitrogen from the fertilizer will be released slowly for a long time, leading to chronic aquifer nitrate pollution. Denitrification is the main mechanism of nitrogen removal, and reaction rates in karst areas are very fast, and can reach 15 mg N m2/d (Heffernan et al., 2012). According to the results by Yue et al., (2015), denitrification removes about 46.7% of the nitrate in this catchment, and the ratio is similar to that in other karst area, such as 36% in Kentucky, United States (Husic et al., 2019). Although long residence times may increase the potential for denitrification (Albertin et al., 2012; Han et al., 2015), there is also substantial residual nitrogen remaining (Yue et al., 2019). Therefore, improving the efficiency of fertilization is an urgent need to reduce the nitrate contamination. For example, timing fertilization to earlier in the growing season and restricted application around sinkholes may help to loss of N during large storm events.
5 CONCLUSIONS
This study characterized the time-variant TTD and Fyw in different landscape units within a karst catchment in Chenqi in Southwest China, using a tracer-aided conceptual hydrological model. This approach shows obvious generic potential for assessing the spatio-temporal variability of water ages dynamics in other karst catchments. The Fyw showed marked seasonal variation for both hillslope and depression landscape units, and the simulated mean Fyw were 0.39, 0.31 and 0.10 for the conceptual stores of hillslope, fast flow and slow flow reservoirs, respectively. The dynamics of the young water fraction and travel time distribution in each landscape unit are controlled by water storage and hydrological connectivity between conduit networks and the fracture matrix, as well as between the hillslope and depression. Strongly affected by direct infiltration through large fractures and sinkholes, young water recharges the underground channel quickly after heavy rainfall, leading to significant increases in the Fyw of runoff at catchment outlet (close to 1). Even though the contribution of young water to runoff is greater at high flows, the old water contribution is generally accelerated as well, due to the significant displacement of old water from small fractures at the beginning of flood. Meanwhile, there was strong mixing of the younger rainwater with older stored water during and after rainfall, decreasing turnover times. From the young water fraction dynamics and the findings on nitrogen processes from Yue et al., (2019), we inferred that underground conduit water in karst areas may be contaminated by young water, which can bring large amounts of contaminants from the surface.
While both the transit time distributions and young water fractions were estimated reasonably well, the tracer-aided model used here is a conceptual, and can only to assess the spatial variations in transit time and water age between the dominant landscape units in complex karst terrain. Consequently, using tracers in more complex, spatially distributed process-based modelling is needed for finer spatial insights.
ACKNOWLEDGMENTS
This research was supported by National Key Research and development Program of China (2016YFC0502602), National Natural Science Foundation of China (41971028, 41571130071) and the UK Natural Environment Research Council (NE/N007468/1). In addition, we thank the two anonymous reviewers and the editor for their constructive comments which significantly improved the manuscript.
Open Research
DATA AVAILABILITY STATEMENT
The data that support the findings of this study are available from the corresponding author upon reasonable request.


