ASS1 Overexpression: A Hallmark of Sonic Hedgehog Hepatocellular Adenomas; Recommendations for Clinical Practice
Abstract
Until recently, 10% of hepatocellular adenomas (HCAs) remained unclassified (UHCA). Among the UHCAs, the sonic hedgehog HCA (shHCA) was defined by focal deletions that fuse the promoter of Inhibin beta E chain with GLI1. Prostaglandin D2 synthase was proposed as immunomarker. In parallel, our previous work using proteomic analysis showed that most UHCAs constitute a homogeneous subtype associated with overexpression of argininosuccinate synthase (ASS1). To clarify the use of ASS1 in the HCA classification and avoid misinterpretations of the immunohistochemical staining, the aims of this work were to study (1) the link between shHCA and ASS1 overexpression and (2) the clinical relevance of ASS1 overexpression for diagnosis. Molecular, proteomic, and immunohistochemical analyses were performed in UHCA cases of the Bordeaux series. The clinico-pathological features, including ASS1 immunohistochemical labeling, were analyzed on a large international series of 67 cases. ASS1 overexpression and the shHCA subgroup were superimposed in 15 cases studied by molecular analysis, establishing ASS1 overexpression as a hallmark of shHCA. Moreover, the ASS1 immunomarker was better than prostaglandin D2 synthase and only found positive in 7 of 22 shHCAs. Of the 67 UHCA cases, 58 (85.3%) overexpressed ASS1, four cases were ASS1 negative, and in five cases ASS1 was noncontributory. Proteomic analysis performed in the case of doubtful interpretation of ASS1 overexpression, especially on biopsies, can be a support to interpret such cases. ASS1 overexpression is a specific hallmark of shHCA known to be at high risk of bleeding. Therefore, ASS1 is an additional tool for HCA classification and clinical diagnosis.
Abbreviations
-
- ASS1
-
- argininosuccinate synthase 1
-
- b-HCA
-
- beta-catenin mutated hepatocellular adenoma
-
- b-IHCA
-
- beta-catenin mutated and inflammatory hepatocellular adenoma
-
- BMI
-
- body mass index
-
- cDNA
-
- complementary DNA
-
- CRP
-
- C-reactive protein
-
- GS
-
- glutamine synthase
-
- HCA
-
- hepatocellular adenoma
-
- HCC
-
- hepatocellular carcinoma
-
- H&E
-
- hematoxylin and eosin stain
-
- H-HCA
-
- HNF1A mutated hepatocellular adenoma
-
- HHIP
-
- hedgehog interacting protein
-
- HNF1A
-
- hepatocyte nuclear factor 1 A
-
- IHC
-
- immunohistochemistry
-
- IHCA
-
- inflammatory HCA
-
- INHBE
-
- inhibin beta E chain
-
- LFABP
-
- liver fatty acid binding protein
-
- mRNA
-
- messenger RNA
-
- MS
-
- mass spectrometry
-
- NT
-
- nontumoral
-
- OC
-
- oral contraception
-
- PCR
-
- polymerase chain reaction
-
- Ppia
-
- peptidyl propyl isomerase A
-
- PTCH1
-
- patched homolog 1 (Drosophila)
-
- PTGDS
-
- prostaglandin D2 synthase
-
- RT-PCR
-
- reverse-transcription PCR
-
- Rpl13a
-
- ribosomal protein L13a
-
- SAA
-
- serum amyloid A protein
-
- shHCA
-
- sonic hedgehog hepatocellular adenoma
-
- T
-
- tumoral
-
- UHCA
-
- unclassified hepatocellular adenoma
Hepatocellular adenomas (HCAs) are rare benign liver tumors. The main risk factor is hormonal exposure to either estrogens or androgens,(1, 2) but metabolic, vascular diseases, glycogen storage diseases, and some other rare genetic diseases have also been associated with HCA development.(3-5) Bleeding and malignant transformation into hepatocellular carcinoma (HCC) are the two major complications, both of which are strongly related to the size of the adenoma. Accordingly, clinical guidelines recommend liver resection when the HCA reaches 5 cm.(6-11) HCAs represent a heterogeneous entity divided into several subtypes based on their patho-molecular features: H-HCA with inactivating mutations of the hepatocyte nuclear factor 1 A (HNF1A) gene, inflammatory HCA (IHCA) with diverse mutations leading to the activation of STAT3, b-HCA with mutations in the CTNNB1 gene, leading to activation of the beta-catenin pathway, and unclassified HCAs (UHCAs), which represent 10% of all HCAs(3, 12) and are the focus of the current study.
In the pathological diagnostic workup, molecular analyses are rarely performed, and HCA subtype identification is based on their prototypical protein expression at immunohistochemistry (IHC). Accordingly, loss of liver fatty acid binding protein (LFABP), aberrant expression of C-reactive protein (CRP), and glutamine synthase (GS) are used to identify H-HCA, IHCA, b-HCA and b-IHCA, respectively.(13-17) Until now, HCAs were classified as UHCAs when all of these immunohistochemical markers were negative.
Recently, a new molecular subgroup representing 4% of all HCAs, the sonic hedgehog HCA (shHCA), has been described, and was associated with a high rate of bleeding.(18) These tumors are characterized by focal deletions that fuse the promoter of inhibin beta E chain (INHBE) with GLI1, inducing the up-regulation of GLI expression and an associated signature (patched homolog 1 [Drosophila] [PTCH1], prostaglandin D2 synthase [PTGDS], hedgehog interacting protein [HHIP]) assigned to the sonic hedgehog pathway activation. These molecular data have been obtained on tumors’ complementary DNA (cDNA), requiring a good quality of messenger RNA (mRNA) on frozen tissue, a biological material often unavailable in routine practice. Prostaglandin D2 synthase (PTGDS) has been proposed as an immunomarker to identify shHCA.(18) However, the use of PTGDS has not been validated.(16, 18, 19)
At the same time, using proteomic analysis, we identified a homogeneous subgroup of UHCA,(20) also associated with a high rate of bleeding, and characterized by the overexpression of argininosuccinate synthase (ASS1) protein(20) in comparison with nontumoral (NT) liver. ASS1 positivity without overexpression in different HCA subgroups has been reported and has created confusion about the pertinence of ASS1 as an immunomarker.(19, 21)
Our aims were (1) to study the link between shHCA and ASS1 overexpression, (2) to clarify the use of ASS1 as an immunomarker and avoid misinterpretations of the staining, through the study of a large series of UHCA cases, and (3) to propose recommendations for ASS1 use as biomarker in clinical routine.
Material and Methods
Patients
- 24 surgical cases retrieved in the Pathology department, CHU Bordeaux (from our series of 224 resected HCAs); of the 24 cases, 17 were previously published as UHCA, defined by molecular analysis before the discovery of shHCA,(20) and 12 of 17 had been further classified by molecular analysis as shHCA (J.Z-R.);
- 17 surgical cases sent for advice to the Pathology department, CHU Bordeaux; these 17 consults were defined according to strict IHC criteria, all HCA immunomarkers being entirely negative. Since the work of Hale et al.,(22) great progress has been made in GS interpretation using molecular biology as the gold standard(23); a strictly normal GS expression allowed us to exclude a b-catenin mutation.
- 32 cases from an international (Europe, United States, Asia, and Australia) cooperation study on UHCA. For this latter source, we requested liver pathologist colleagues to send at least one hematoxylin and eosin (H&E) and one blank slide with tumoral (T) and NT tissue; we excluded six cases (poor fixation, GS positivity, or unsure diagnosis of HCA in one, two, and three cases, respectively).
Finally, a total of 67 cases were used in the study.
H&E slides were reviewed by an experienced liver pathologist (P.B.S.). In addition to H&E and ASS1, other stainings (HCA markers, CD34, CK7, and reticulin) were analyzed in all cases from Bordeaux and in other cases when there were available slides.
We first selected cases in three groups based on the H&E slides. Cases were considered as (1) “compatible” with the diagnosis of shHCA, using the criteria already defined(20) (primarily a characteristic bland aspect), (2) “in favor of the diagnosis” when there were additional blood cavities at different stages of degradation, or (3) “not compatible” when there were pathological criteria usually observed in H-HCA, IHCA, b-HCA, b-IHCA, or possibly in Focal Nodular Hyperplasia (FNH).
We analyzed the pathological criteria of the tumor as well as the percentage rate of steatosis in the NT liver. In addition, for the cases of CHU Bordeaux, we analyzed the link between the mode of discovery and the presence of hemorrhagic/necrotic tissue (cases from abroad, with missing clinical data could not be used for this point).
As far as possible, we collected the following clinical criteria: age, sex, oral contraception (OC), body mass index (BMI), number of nodules, size of the largest nodule, mode of discovery, and associated diseases.
All patients have given informed consent, and this study was approved by the local committee “Direction de la Recherche Clinique et de l’Innovation” of Bordeaux University Hospital, Bordeaux Liver Biobank BB-0033-00036.
Immunohistochemistry Analysis
Surgical specimens were fixed in 10% buffered formaldehyde; tissue sections from T and NT parenchyma were routinely processed for the purpose of diagnosis. Selected representative slides, including T and NT tissue, were processed for ASS1 and PTGDS IHC.
For ASS1 immunostaining, the 2.5-µm-thick sections were dewaxed and rehydrated, and antigen retrieval was performed in the PT Link pH 9 buffer (Agilent Dako, Santa Clara, CA) for 40 minutes at 95°C then cooled down to 65°C for 20 minutes. All staining procedures were performed in an automated autostainer (Agilent Dako) using the Kit Flex (Agilent Dako) reagents according to the manufacturer’s instructions. The sections were incubated with the ASS1 rabbit polyclonal antibody (16210-1-AP; ProteinTech, Rosemont, IL) at a 1:1,000 dilution for 45 minutes at room temperature. The slides were finally counterstained with hematoxylin, dehydrated, and mounted. Each immunohistochemical run contained a negative control (buffer, no primary antibody). Sections were visualized with a Nikon Eclipse501 microscope, and images were acquired using NIS-Elements F.
UHCA overexpressing ASS1 in the tumor (either homogeneous or heterogeneous) but more than in the corresponding NT liver was classified as HCA ASS1+. More precisely, ASS1 overexpression means higher signal in the tumor, and overall there is loss of the zonal distribution usually observed in NT liver. Cases with no tumoral staining or less staining than in the nontumoral liver were considered as HCA ASS1 negative. Cases with difficulty in defining for any reason the difference between T and NT liver were considered as “noncontributory.”
PTGDS immunostaining was performed in a reference center (Hospital Beaujon, Paris, France) on blank slides from Bordeaux series. Antigen retrieval was performed with the CC1 buffer (pH 8.4; Roche, Basel, Switzerland); anti-PTGDS (clone HPA004938; Sigma-Aldrich, St. Louis, MO) was used at a 1:25 dilution.
Interpretation was made by an experienced pathologist (V.P.) as positive (intensity mild [1] or moderate [2], diffuse, or focal) or negative.
Molecular Analysis
mRNA Isolation
Frozen tissue from T and NT livers was obtained immediately after surgery and stored at −80°C until used. Total RNA from samples was homogenized in Tri-reagent (Euromedex, Strasbourg, France), and RNA was isolated using a standard chloroform/isopropanol protocol.(24) RNA was processed and analyzed following an adaptation of published methods.(25) Concentration of the total RNA samples was measured using the microDrop DS-11 Spectrophotometer (DeNovix Inc., Wilmington, DE). The purity of total RNA was also assessed using an Agilent TapeStation 2200 (Agilent Technologies, Palo Alto, CA).
mRNA Retrotranscription
cDNA was synthesized from 2 μg of total RNA using RevertAid Premium Reverse Transcriptase (Fermentas, Waltham, MA) and primed with oligo-dT primers (Fermentas) and random primers (Fermentas).
Polymerase Chain Reaction
Samples were genotyped from cDNA by polymerase chain reaction (PCR) using primers mentioned in Nault et al.(18) PCR assay was carried out on a Bio-Rad C1000 thermal cycler (Hercules, XA) (10-µL volume) using 4 ng of cDNA, GoTaq G2 Hot Start Green Master Mix (Promega, Madison, WI), and 0.2 µM of each primer. PCR conditions were as follows: 1 cycle, 5 minutes at 95°C; 37 cycles, 30 seconds at 95°C, 30 seconds at 58°C, and 45 seconds at 72°C; 1 cycle, 5 minutes at 72°C. PCR products were analyzed on a Labchip GX microfluidic electrophoresis system (PerkinElmer, Waltham, MA) using the DNA5k kit.
Quantitative PCR
Quantitative PCR was performed using a LightCycler 480 Real-Time PCR System (Roche, Meylan, France). Quantitative PCR reactions were performed in duplicate for each sample, using transcript-specific primers, cDNA (4 ng), and LightCycler 480 SYBR Green I Master (Roche) in a final volume of 10 μL. The quantitative PCR data were exported and analyzed using software (Gene Expression Analysis Software Environment) developed at the Neurocentre Magendie (Bordeaux, France). To determine the reference gene, the Genorm method was used.(25) Relative expression analysis was normalized using two reference genes. Ribosomal protein L13a (Rpl13a) and peptidyl propyl isomerase A (Ppia) genes were used as the reference genes. The relative level of expression was then calculated using the comparative (2−∆∆CT) method.(26) Primer sequences are provided in Supporting Table S1.
Digital PCR, in vitro analysis methods, enzyme-linked immunosorbent assay (ELISA), and proteomic analysis were performed as described in the Supporting Information.
Results
To determine whether shHCA and ASS1 overexpression in HCA superimposed or overlapped, we used UHCA cases of the Bordeaux cohort for performing molecular, immunopathological, and clinical analyses.
Molecular Classification
We searched for the focal deletions fusing the promoter of INHBE with GLI1, defining the shHCA. As described by Nault et al.,(18) we performed PCR on the cDNA of frozen T and corresponding NT tissues. We analyzed 19 tumors from 16 of 24 patients with UHCA diagnosis based on H&E and IHC criteria. For the other 8 patients, we did not have frozen tissue. We amplified the corresponding amplicons in 12 tumors, indicating the deletion. We had no amplification for seven tumors (Table 1 and Supporting Fig. S1).
| Case | Tumor | Detection of a Deletion Fusing the Promoter of INHBE With GLM Gene | mRNA Expression (T:NT Ratio) | mRNA Expression (T:NT Ratio) | |||
|---|---|---|---|---|---|---|---|
| GLI1 | PTCH1 | PTGDS | HHIP | ASS1 | |||
| 105 | Positive | 12,70 | 11,73 | 99,20 | 8,23 | 7,53 | |
| 178 | Positive | 8,42 | 4,58 | 0,03 | 0,50 | 7,91 | |
| 70 | Positive | 5,54 | 16,56 | 140,48 | 2,74 | 4,80 | |
| 168 | Negative | 66,65 | 1,98 | 290,71 | 2,23 | 11,07 | |
| 121 | Negative | 6,92 | 8,52 | 51,82 | 3,64 | 7,04 | |
| 37 | Negative | 1,89 | 2,06 | 9,41 | 0,89 | 2,71 | |
| 162 | T1 | Positive | 9,63 | 3,41 | 44,80 | 20,40 | 7,92 |
| 162 | T2 | Positive | 11,49 | 20,13 | 89,34 | 46,08 | 7,17 |
| 162 | T3 | Positive | 11,49 | 10,58 | 92,26 | 35,45 | 7,17 |
| 183 | Positive | 10,97 | only T | 1234,65 | 12,86 | 12,86 | |
| 176 | Negative | 26,58 | 5,51 | 187,05 | 2,20 | 10,00 | |
| 175 | Positive | 111,89 | 7,83 | 179,09 | 0,52 | 1,89 | |
| 209 | Positive | 4,26 | 7,19 | 39,31 | 22,11 | 17,41 | |
| 217 | Positive | 2,81 | 0,80 | 89,06 | only NT | 2,04 | |
| 242 | T1 | Positive | 6,84 | 30,26 | 1,29 | 5,71 | 2,73 |
| 242 | T2 | Negative | 10,96 | 22,32 | 2,26 | 2,49 | 2,60 |
| 237 | Positive | 7,81 | 87,97 | 3,52 | 13,90 | 2,72 | |
| 235 | Negative | 15,92 | 3,42 | 0,65 | 6,88 | 3,04 | |
| 244 | Negative | 0,06 | 0,02 | 0,43 | 0,31 | 0,49 | |
Notes:
- T:NT ratios were calculated from quantitative RT-PCR data. Results that identify a shHCA are highlighted: ratios between 2 and 5 are highlighted in light brown and ratios ≥5 are highlighted in dark brown. “only T” or “only NT” indicate that mRNA was detected only in liver T or NT, respectively.
Thus, to complete this approach, we also analyzed the mRNA expression of the shHCA gene signature (GLI, PTCH1, PTGDS, and HHIP)(18) from frozen tissues of the same 19 tumors by quantitative reverse-transcription PCR (RT-PCR). In three cases, the GLI cDNA quantity was insufficient for the NT part. For these cases, we performed digital PCR to assess the T:NT mRNA expression ratios. GLI mRNA overexpression was confirmed in the 12 tumors in which the focal deletions were detected, and more widely in 18 of 19 tumors. The other shHCA signature genes were not systematically associated to a GLI overexpression (16 of 19 tumors for PTCH1, 15 of 19 tumors for PTGDS, 14 of 19 tumors for HHIP, and 11 of 19 tumors positive for the four biomarkers of the shHCA signature) (Table 1).
In parallel, we analyzed the ASS1 mRNA expression in the same tumors. ASS1 was overexpressed in the 12 tumors for which the focal deletions were detected, and was more widely strictly associated with GLI overexpression (18 of 19 tumors) (Table 1).
Taken together, both GLI and ASS1 were overexpressed in shHCAs. Subsequently, we investigated whether GLI and ASS1 overexpression in shHCA was associated. To verify this hypothesis, we performed Shapiro and linear regression statistical tests. Residual values did not follow a normal distribution (P = 0.1278) (Supporting Fig. S2A). In the same way, the linear regression analysis did not demonstrate a significant association (Supporting Fig. S2B). PTGDS overexpression also was not significantly associated with GLI overexpression (P = 0.5938) (Supporting Fig. S2C,D).
We also investigated whether there was any functional link between GLI and ASS1. To do this, we first tested GLI expression levels in three HCC cell lines (Huh7, HepG2, and SNU398) and one hepatocyte cell line (THLE2). We observed significant variation in GLI expression. Among the three HCC cell lines, we first selected the SNU398 cells, which strongly expressed GLI (Supporting Fig. S3A), and we depleted GLI with siRNA without inducing any change in ASS1 expression (Supporting Fig. S3B). To mimic the overexpression of GLI in shHCAs, we overexpressed a hemagglutinin-tagged GLI by transient transfection of an expression plasmid in HUH7 (Supporting Fig. S3C) and SNU398 cells (Supporting Fig. S3D). As expected, GLI overexpression induced an up-regulation of one of its target vimentin(27) in both cell lines but without any change in ASS1 (Supporting Fig. S3C,D). We then selected HepG2 and SNU398, which expressed INHBE and showed that its depletion had no effect on ASS1 expression (Supporting Fig. S4A,B). Despite the fact that both GLI and ASS1 overexpressed in shHCA, we did not observe a direct molecular link between GLI and ASS1.
Specificity of ASS1 Overexpression for Identifying shHCA
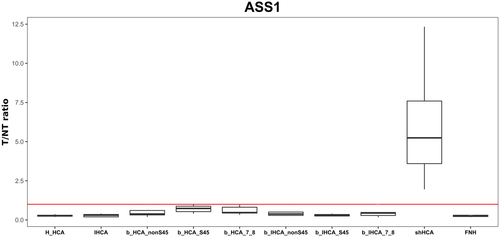
As already shown by IHC and western blot analyses of ASS1 on the different HCA subtypes,(20) it is possible to find a positivity of ASS1 in the tumor that must be differentiated from overexpression in the tumor compared with the NT liver, which is specific to shHCA. To further support this outcome, we quantified the T:NT ratio in the different HCA subgroups using mass spectrometry. We analyzed 41 HCAs representing all subtypes (9 shHCAs, 3 H-HCAs, 3 IHCAs, 5 b-HCA exon 3 non S45s, 6 b-HCA exon 3 S45s, 6 b-HCA exon 7/8s, 3 b-IHCA exon 3 non S45s, 3 b-IHCA exon 3 S45s, and 3 b-IHCA exon 7/8s) and three focal nodular hyperplasia (HNF). ASS1 is overexpressed in all cases of shHCAs and in none of the other subtypes of HCA or FNH (Fig. 1). These data confirmed that ASS1 overexpression in the tumor is a specific characteristic of shHCA.
Comparison of shHCA Identification Performance by ASS1 and PTGDS
Next, we compared the performance of ASS1 and PTGDS as immunomarkers. We performed ASS1 IHC on the 24 UHCA of the Bordeaux series. As described in Henriet et al.,(20) we evaluated the ASS1 overexpression in the tumor in comparison with adjacent NT liver. ASS1 was overexpressed in tumor in comparison with NT liver in 23 of 24 cases. The staining was diffuse (>80%) on the whole tumor in 13 cases or heterogeneous in 10 cases; however, in all cases the overexpression T:NT ratio was clear (Figs. 2-4). The last case was excluded from the diagnosis of shHCA, as ASS1 was strongly expressed in NT liver at the same level of the tumor (interpreted as noncontributory). It has to be underlined that this last case (case 244) was the same that was shHCA negative in molecular analysis (Table 1). Therefore, 23 of 24 (95.8%) of the UHCA Bordeaux cohort overexpressed ASS1 (Figs. 2B and 4A).
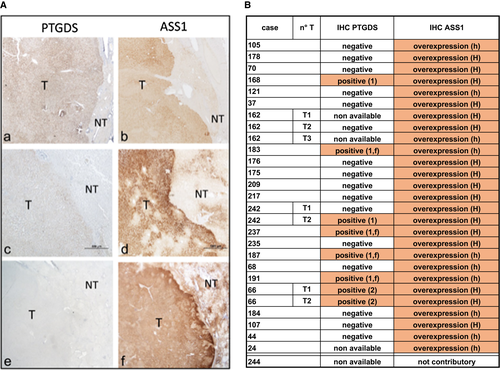
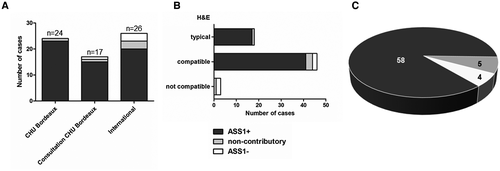
In parallel, PTGDS was performed in the Beaujon Reference Center (France) on 22 cases of the Bordeaux cohort (25 slides, as two different tumors were tested in the three cases that were all already positive for ASS1). Seven cases (31.8%) were interpreted as positive (8 of 25 tumors). Three cases (four tumors) were diffusely positive (mild or moderate intensity); in four additional cases, the staining was mild and focal. Fifteen cases (68.2%) already positive for ASS1 were PTGDS-negative (Fig. 2). Among the seven PTGDS-positive cases, five were demonstrated as shHCA by molecular analysis and two were not tested. Among the 15 PTGDS-negative cases, 13 were demonstrated as shHCA by molecular analysis and two were not tested (Table 1 and Fig. 2).
Finally, ASS1, strictly interpreted as an overexpression in comparison with NT liver, was the best immunomarker to identify shHCA. Due to the fact that the 23 cases were positive for ASS1 (and negative for other HCA biomarkers), in addition to the evidence collected by molecular and proteomic analyses, we classified these 23 cases as shHCA.
Pathological Features
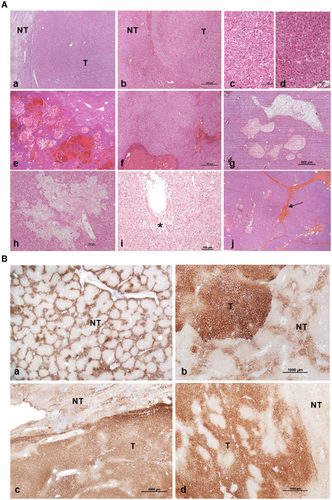
In the cohort of 24 Bordeaux shHCA cases, 23 shared the H&E characteristics already published as ASS1+HCA(20): well differentiated, nonencapsulated hepatocellular proliferation, with bland aspect and composed of clear cells often associated with hypereosinophilic and packed cells related to ischemia, defining a compatible aspect (Fig. 3). In 6 of the 23 cases, there were additional pathological features not described in the original paper, namely, blood cavities at different stages of degradation (i.e., from cavities filled of red blood cells or with fibrillar material to quasi empty holes) and vascular abnormalities with detachment of hepatocytes row from the vascular wall. These additional criteria, when present, help to classify shHCA.
Clinico-Pathological Criteria
Regarding the Bordeaux series, all 23 cases (Table 2A and Supporting Table S2) occurred in women with a mean age of 40, on long-term OCs , with a median BMI of 28.7. The tumor was single in 10 cases and multiple in 13 cases (2 adenomatosis). The mean size of the largest nodule was 7 cm; in 7 cases the size was less than 5 cm. One to several manifestations of the metabolic syndrome such as arterial hypertension, diabetes, dyslipidemia, and occasionally nonalcoholic steatohepatitis were observed in 11 cases, as a single manifestation in six cases or triple in five cases, respectively. Steatosis in the NT liver was observed in 17 of the 23 cases and was severe (over 60%) in seven cases. Reasons for admission to hospital varied (Supporting Table S2). In six cases, patients were admitted in emergency; in 11 cases they consulted for pain from mild to acute; and in six cases they were admitted for various conditions from check-up, such as raised gamma glutamine transferase to fortuitous discovery. There was no strict relationship between the mode of discovery and the observed liver damage, probably due in part to the delay between the detection of the nodule(s) and surgery (few days to close to 2 years) or autopsy in one case (few hours). For example, in the six cases discovered without pain, there was a small intratumoral hematoma in one case. The liver was close to normal in one case (178), with remnants of hemorrhagic areas in two cases (cases 173 and 184), hemorrhagic foci at different stages in five cases (cases 37, 68, 162, 237, 242), hematoma at different stages in eight cases (cases 44, 66, 121, 176, 187, 191, 217, and 235), hemorrhagic rupture in four cases (cases24, 70, 183, and 209), and with more or less extended areas of hemorrhagic necrosis in three cases (cases 105, 107, and 168).
| (A) 23 Cases (CHU BDX) | (B) 15 Cases (Consults CHU BDX) | (C) 20 Cases (International) | (D) 58 Cases (Total) | |
|---|---|---|---|---|
| Sex | All women | All women | All women | All women |
| Age, median (min-max) | 40 (23-57) | 40 (26-48) | 35 (24-54) | 37 (23-57) |
| OC: Available data | 23 of 23 | 6 of 15 | 7 of 20 | 36 of 58 |
| (n) median duration (min-max) | (14 of 23) 17.5 (1-30) | (4 of 6) 14 (3-24) | (3 of 7) 30 (20-30) | (21 of 36) 20 (1-30) |
| BMI (n available data) median (min-max) | (23 of 23) 28.7 (19.7-45.7) | (5 of 15) 39.3 (30-66.9) | (11 of 20) 34 (23.6-50) | (39 of 58) 32 (19.7-66.9) |
| <25 | (6) 21.6 (19.7-25) | 0 | (1) 23.6 | (7) 22.2 (19.7-25) |
| ≥25 <30 | (7) 28.1 (26.6-30) | 0 | (4) 26 (26-27.5) | (11) 27.7 (26-30) |
| ≥30 | (10) 37.9 (31.6-45.7) | (5) 39.3 (30-66.9) | (6) 35.5 (34-50) | (21) 37 (30-66.9) |
| Admission, n emergency; n pain; n others; (NA) | 6*; 11†; 6‡ | 0; 2; 1; (12) | 0; 4; 2; (14) | 6; 17; 9; (26) |
| Nodules | ||||
| Cases (n) solitary; multiple; adenomatosis; (NA) | 10; 11; 2; (0) | 7; 5; 2; (1) | 8; 7; 2; (3) | 25; 23; 6; (4) |
| Size (cm) of the largest nodule resected mean (min-max) | 7 (1.3-23) | 5 (2-12) | 5.9 (1.5-24); 1 NA | 6 (1.3-24); 1 NA |
| Cases (n) with main nodule <5 cm | 7 | 6 | 7; 1 NA | 20; 1 NA |
| Cases (n) with main nodule <5 cm and clinical manifestations (emergency/pain) | 5 | 1 | 0 | 6 |
| Cases (n) with arterial hypertension; diabetes; dyslipidemia; NASH | 6; 5; 5; 5 | 3; 3; 1; 4 | 3; 3; 0; 4 | 12; 11; 6; 13 |
| Number of associated pathologies (1; 2; 3) | 6; 0; 5 | 3; 2; 1 | 4; 3; 0 | 13; 5; 6 |
| Malignant transformation (borderline/wd HCC) | 3 | 1 | 0 | 4 |
| Cases (n) with steatosis in NT liver <10%; ≥10% <30%; ≥30% <60%; ≥60% | 6; 3; 7; 7 | 4; 2; 3; 6 | 7; 3; 7; 3 | 17; 8; 17; 16 |
- * Among the six cases there were one gr l, one gr 2, and four gr 3.
- † Among the 11 cases there were two gr 1 (one with acute pain) and two gr 2.
- ‡ Among the six cases there were five fortuitous cases (one gr 1).
- Abbreviations: gr, grade; NA, nonavailable data; NASH, nonalcoholic steatohepatitis; wd HOC, well-differentiated hepatocellular carcinoma.
In four cases with multiple nodules, there were worrisome criteria with areas of reticulin loss, cytological atypia, and presence of pseudo glands; this led to the diagnosis of “borderline” tumors with even areas of malignant transformation in two cases.
ASS1 Validation in a Large Cohort
To test more broadly the performance of ASS1 as an immunomarker, we increased the Bordeaux collection of UHCA from two different sources: CHU Bordeaux consultations (17 cases) and international cooperation study (26 cases) (Fig. 4A).
Considering all 67 cases, on H&E staining, 18 were typical, 46 were compatible, and 3 were not compatible with the shHCA diagnosis (Fig. 4B). In total, ASS1 was overexpressed in 58 of the 67 cases (86.6%); 4 of the 67 (6.0%) were ASS1 negative; and 5 of 67 (7.5%) were noncontributory (Fig. 4C). We performed an accuracy test that allowed us to estimate the sensitivity of ASS1 to 90.6%.
As illustrated in Table 2B,C, the global clinical data and the individual data in consultation and international cases (Supporting Table S3) were close to the data from CHU Bordeaux (Table 2A and Supporting Table S2).
UHCA and Unclassified Cases
One of 24, 2 of 17, and 6 of 26 cases from CHU Bordeaux, consultations and international study, respectively, were not identified as shHCA (Fig. 4A). H&E, ASS1 IHC, and clinical data are presented in Supporting Table S4. Of these nine cases, four were ASS1-negative, two were compatible, and two were not compatible on H&E with the diagnosis of shHCA. These four cases could be classified as “true” UHCA. Five other cases could not be classified because (1) ASS1 positivity was not different between T and NT liver in three cases (although H&E was in two cases compatible and even typical), (2) there was not enough T liver to correctly interpret H&E and ASS1 staining due to the presence of massive bleeding in another case, and (3) there was not enough NT tissue in the last case.
Diagnosis on Biopsies by IHC
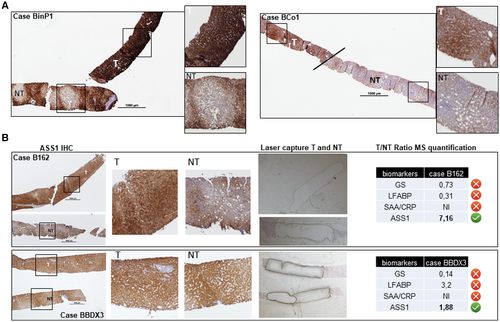
We selected biopsies that were negative for GS and CRP/SAA and with normal LFABP expression, in which we had enough T and NT tissue to reliably interpret H&E and ASS1 staining. There were 10 biopsy cases from the CHU Bordeaux: five before a resection (cases 121, 162, 178, 191, and 235] and five others (Supporting Table S5). We had five additional biopsies: one case from Bordeaux consultation and four from the international study not linked to surgical cases (one that we requested after reading a case report of UHCA that appeared to us as a candidate of shHCA(28)). Clinical information is presented in Supporting Table S5. In all of these biopsies (those preceding resections were read without this indication), there was an overexpression of ASS1 in T fragments, in comparison to NT liver (Fig. 5A).
Measurement of ASS1 Quantity in the Sera of Patients with HCA
We tested the possibility of identifying the shHCA subtype in a noninvasive manner. Using an ELISA strategy, we measured ASS1 quantity in the serum of patients corresponding to different HCA subtypes (13 IHCAs, 7 H-HCAs, 2 b-HCAs, 2 b-IHCAs, and 4 shHCAs) (Supporting Fig. S5). Surprisingly, high amounts (0.19-2.31 ng/mL) of ASS1 were measured in all patients’ sera. The amounts were no higher in patients with shHCA as compared with the other cohorts. Thus, quantification of the amount of ASS1 in serum is not an option to be considered.
Mass Spectrometry, an Innovative Tool to Complete Diagnosis of shHCA
As shown in Fig. 1, we were able to quantify the T and NT ASS1 expression ratios by proteomic analysis on fixed tissue.(20, 28) From there, we found that proteomic analysis by mass spectrometry could be an option to support shHCA diagnosis in case of uncertain interpretation of ASS1 overexpression, especially on biopsies. As a proof of concept, using the fixed tissue, a proteomic analysis process was set up in the laboratory,(20, 29) where we analyzed two biopsies: one typical and the other an ASS1 overexpression that was not clear-cut between T and NT tissue using IHC (Fig. 5B). In the latter case, the quantification of ASS1 T:NT ratio and reference biomarkers resolved any ambiguity to assess an ASS1 overexpression (Fig. 5B).
Discussion
Advantages and Limitations of Molecular Biology for shHCA Diagnosis
The molecular subgroup shHCA is defined by a focal deletion that fuses the promoter of INHBE with GLI1. This fusion can be detected either by amplification on the cDNA (retro transcription of mRNA) or by RNA-sequencing analysis or quantitative RT-PCR of a targeted signature of four genes.(18) Due to its position downstream of the microdeletion, GLI is the direct molecular marker of shHCA. Through molecular analysis of 20 patients with UHCA from the Bordeaux collection, we demonstrated a perfect concomitance between GLI1 and ASS1 overexpression, allowing us to conclude that ASS1 was a good marker to identify shHCA. However, it should be noted that detection of the deletion could only be confirmed in 12 cases of the 18 tumors overexpressing GLI1. Similarly, Nault et al. reported the detection of INHBE-GLI1 fusions in 15 of 20 shHCAs, despite a typical pattern of gene expression in all cases. It is possible that not all configurations of the focal deletions fused to the promoter of INHBE with GLI1 have been considered. We also demonstrated that PTGDS, part of the molecular signature that has been proposed,(18) is not strictly associated with shHCA.
In clinical routine, the diagnosis is essentially made by IHC with corresponding immunomarkers. Until now, the UHCA subgroup was defined by default, with all specific HCA markers being negative. The identification of two potential immunomarkers brought the possibility of a more robust diagnosis of a subgroup of UHCA. PTGDS was not sensitive enough. In other words, PTGDS negativity does not exclude the diagnosis of shHCA. The anti-ASS1 antibody appeared to be more powerful, allowing the identification of 23 shHCAs from our collection of 24 UHCAs.
Concerning our functional study, in light of our results and those previously shown,(19) the molecular link between ASS1 and GLI or INHBE is not direct but cannot be excluded. An in vitro model of HCA cells in culture would probably be more relevant for functional analysis and would be worth developing.
shHCA in the HCA Classification
Our goal was to use ASS1 overexpression as a marker to identify shHCA among UHCAs. Based on 58 cases representing the largest shHCA series, the characteristics of this HCA subgroup can be summarized as follows. It occurs essentially, if not exclusively, in women. Most are over 35 years old, on long-term OCs, overweight, with a steatotic liver, and often with clinical features of metabolic syndrome (e.g., arterial hypertension, diabetes, dyslipidemia). If the number of nodules as well as their size are not discriminant, the admission criteria are in part rather unique. Indeed, the admission rate for acute bleeding is particularly high (26% patients admitted in emergency for bleeding grade 1-3; 30% and 43.5% if we add patients with pain and bleeding grade 2 or 1, respectively). If the identification is made in daily routine based on the overexpression of ASS1 in T compared to NT liver, the H&E criteria are essential. It is a nonencapsulated, monotonous, “bland,” well-differentiated hepatocellular proliferation made of packed, often clear cells, often intermingled with areas of retracted hepatocytes with condensed nuclei, possibly related to ischemic suffering. The tumors are well vascularized by numerous isolated arteries and veins, often with the presence of hemorrhagic area, congestion, sometimes fibrotic bands, without noticeable inflammation, ductular reaction, or steatosis. The presence of cavities, often close to abnormal arteries and veins, of various sizes, solitary or grouped, with or without blood at different stages of degradation (peliosis, red blood cells ghosts, loose fibrosis) is quite frequent.(30) One important observation is the presence of bleeding (i.e., small hematoma) in small shHCAs (<5 cm), discovered in a resected specimen for large hemorrhagic shHCA.
ASS1 Implication in Clinical Practice
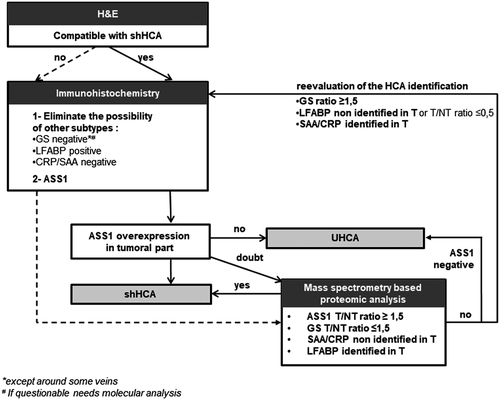
In most cases, HCAs are easily classified as H-HCA, IHCA, and b-HCA/b-IHCA. The different b-HCA/b-IHCA subtypes (exon 3 or exon 7/8) may require molecular analysis, possibly performed on formalin-fixed paraffin-embedded tissue (FFPET). If all HCA markers are negative, ASS1 IHC is mandatory.
shHCAs represent 10% of surgical cases at our institution, which is higher than the previously published multicentric French study (4%).(18)
The interpretation of the staining is not always clear-cut, like most immunomarkers, and the analysis requires experience and a strict comparison with NT liver; nonobservance of this rule may lead to misinterpretation of results. In a recent paper, ASS1 IHC positivity (without comparison to NT liver in 57% of cases) was not found to correlate with hemorrhage, whatever the HCA subtype.(21) It is quite obvious that all HCA subtypes can bleed. In this work, our purpose was to identify, using ASS1 overexpression, shHCA that are known to be at high risk of bleeding.(18, 20)
In four of five cases, ASS1 staining was noncontributory, although they were compatible on H&E with shHCA. First, it is important to be sure that the case is not a classified HCA subtype (H-HCA, IHCA, b-HCA, b-IHCA). As mentioned in our first study,(20) the expression of ASS1 is not restricted to shHCA. In contrast, the ASS1 overexpression in tumor, in comparison to the NT liver, is a hallmark of shHCA.
To rule out difficulties of interpretations, we recommend, if necessary, to perform ASS1 on several blocks as well as in the NT liver far away from the tumor. We must emphasize that in most cases, the diagnosis of shHCA is straightforward and reinforced by the clinico-pathological data.
Additional techniques such as DNA and RNA sequencing, and proteomic analyses, are necessary to resolve the difficulties of interpretation. Our experience on biopsy is limited and, although preliminary, the results are promising.
shHCA Management
This subgroup associated with high risk of significant clinical bleeding(18, 20) and presence of hemorrhagic pathological criteria requires careful analysis. These data will be useful to propose, in a defined clinical context (women, obesity/metabolic syndrome, age over 40, long-term OCs), the best options for management, to avoid emergency admission for acute severe HCA bleeding, independently of the tumor size (≤and ≥ 5 cm). In addition, it is possible to propose an algorithm to diagnose shHCA (Fig. 6).
UHCA Cases
Few cases were negative for all HCA markers, including ASS1. Interestingly, two of the four cases in our series that were compatible with shHCA on H&E were indeed ASS1-negative. This suggests that ASS1 is a mandatory marker to identify shHCA in daily practice, once the other HCA immunomarkers are established as negative. Again, it is crucial to eliminate other subtypes, particularly the b-HCA exon 7/8 mutated (in which GS staining can be very faint(30)), which can be wrongly interpreted as UHCA by an inexperienced pathologist requiring molecular analysis of b-catenin (possible on FFPET). If rare UHCA cases do exist, they remain a subject for further study.
Other Technical Options for Diagnosis
We tested the possibility of measuring ASS1 in patient’s sera as a noninvasive test. ASS1, a key protein in hepatic pathophysiology, is present in high quantity and is detectable in all patients, without any possibility of identifying shHCA cases. Therefore, we have excluded measuring serum ASS1 as a diagnostic tool.
In case of difficulty, it is recommended to perform proteomic analysis on paraffin sections or molecular analysis (if frozen material is available).
Proteomic analysis is particularly promising on biopsy, provided that NT liver is available for comparison. Based on the cases we analyzed by mass spectrometry, we set a threshold for overexpression as 1.5 or greater. In the future, imaging data combined with biopsy results will help to identify HCA subtypes before surgery.
In conclusion, ASS1 overexpression is an additional tool for HCA classification of shHCA, a subtype known to be at high risk of bleeding. This HCA subgroup with well-defined clinical and pathological characteristics represents 10% of all HCAs. Combining IHC and proteomic analysis, ASS1 will allow identification of shHCA in practice.
Author Contributions
A.A.R., F.S., C.B., and P.B.S. were responsible for the study concept and design, analysis and interpretation of data, and writing of the manuscript. A.A.R. and F.S. were responsible for obtaining funding. M.S., D.G., T.L.L., P.B.S., V. Paridas, N.D.S., S.D.T., J.W.D., and V. Pitard were responsible for the data acquisition. C.D. was responsible for the statistical analysis. V. Paridas, A.S., L.D.F., A.D.C., G.M., M.M.Y., S.T., C.S., A.S.H.G., A.Q., J. Han, J. Huan, C.F., J.C., Y.N., K.H., B.L.B., C.C., N.F., A.T., L.P., J.F.B., L.C., C.L., C.B., and P.B.S. were responsible for contributing to the HCA cohort.


