Genomic Analysis of Vascular Invasion in HCC Reveals Molecular Drivers and Predictive Biomarkers
Abstract
Background and Aims
Vascular invasion (VI) is a critical risk factor for HCC recurrence and poor survival. The molecular drivers of vascular invasion in HCC are open for investigation. Deciphering the molecular landscape of invasive HCC will help identify therapeutic targets and noninvasive biomarkers.
Approach and Results
To this end, we undertook this study to evaluate the genomic, transcriptomic, and proteomic profile of tumors with VI using the multiplatform cancer genome atlas (The Cancer Genome Atlas; TCGA) data (n = 373). In the TCGA Liver Hepatocellular Carcinoma cohort, macrovascular invasion was present in 5% (n = 17) of tumors and microvascular invasion in 25% (n = 94) of tumors. Functional pathway analysis revealed that the MYC oncogene was a common upstream regulator of the mRNA, miRNA, and proteomic changes in VI. We performed comparative proteomic analyses of invasive human HCC and MYC-driven murine HCC and identified fibronectin to be a proteomic biomarker of invasive HCC (mouse fibronectin 1 [Fn1], P = 1.7 × 10⁻¹¹; human FN1, P = 1.5 × 10⁻⁴) conserved across the two species. Mechanistically, we show that FN1 promotes the migratory and invasive phenotype of HCC cancer cells. We demonstrate tissue overexpression of fibronectin in human HCC using a large independent cohort of human HCC tissue microarray (n = 153; P < 0.001). Lastly, we showed that plasma fibronectin levels were significantly elevated in patients with HCC (n = 35; mean = 307.7 μg/mL; SEM = 35.9) when compared to cirrhosis (n = 10; mean = 41.8 μg/mL; SEM = 13.3; P < 0.0001).
Conclusions
Our study evaluates the molecular landscape of tumors with VI, identifying distinct transcriptional, epigenetic, and proteomic changes driven by the MYC oncogene. We show that MYC up-regulates fibronectin expression, which promotes HCC invasiveness. In addition, we identify fibronectin to be a promising noninvasive proteomic biomarker of VI in HCC.
Abbreviations
-
- AFP
-
- alpha-fetoprotein
-
- ATF4
-
- activating transcription factor 4
-
- CDKN2A
-
- cyclin-dependent kinase inhibitor 2A
-
- CREBZF
-
- CREB/ATF bZIP transcription factor
-
- CRISPRi
-
- CRISPR interference
-
- DOX
-
- doxycycline
-
- FDR
-
- false discovery rate
-
- FN1
-
- fibronectin 1
-
- HOXD13
-
- homeobox D13
-
- IHC
-
- immunohistochemistry
-
- IPA
-
- Ingenuity Pathway Analysis
-
- IRB
-
- institutional review board
-
- LC
-
- liquid chromatography
-
- LIHC
-
- Liver Hepatocellular Carcinoma
-
- miRNA
-
- microRNA
-
- MS
-
- mass spectrometry
-
- MYC
-
- MYC proto-oncogene, bHLH transcription factor
-
- PAI-1
-
- plasminogen activator inhibitor-1
-
- RB1
-
- RB transcriptional corepressor 1
-
- RNAi
-
- RNA interference
-
- scr
-
- scrambled
-
- siRNA
-
- small interfering RNA
-
- TCGA
-
- The Cancer Genome Atlas
-
- TMA
-
- tissue microarray
-
- TP53
-
- tumor protein p53
-
- VEGFR2
-
- vascular endothelial growth factor receptor 2
-
- VI
-
- vascular invasion
-
- ZBTB17
-
- zinc finger and BTB domain-containing 17
HCC is an aggressive malignancy with very high mortality.(1) The prognosis for advanced HCC is dismal, with 5-year survival of ~15%. For patients diagnosed with HCC at an early stage, surgeries like resection and transplantation offer the promise of a cure. But, unfortunately, recurrence after surgery is common, with the 5-year recurrence rate reaching up to 50% postresection and 10%-20% posttransplant.(2) Therefore, there is a critical need to understand the mechanisms that drive recurrence and identify those at high risk for recurrence to prevent the associated morbidity and mortality.
Vascular invasion (VI), which is present in 25%-50% of HCC,(3-5) is a major risk factor for recurrence and is associated with poor overall survival in HCC.(6-8) Existing plasma biomarkers, like alpha-fetoprotein (AFP) and des-carboxy prothrombin, have low sensitivity and are inadequate in determining tumor invasiveness.(9) To further complicate the problem, HCC is a unique malignancy in which a diagnosis can be established with a high level of confidence by its characteristic radiological features, foregoing the need for tissue biopsy. Thus, unfortunately, histological information about the presence of VI is not always available preoperatively, and selection of surgical patients often rely solely on radiological tests for tumor-size characteristics. Hence, there clearly is a large need for identification of biomarkers for the detection of invasive HCC to preoperatively risk stratify patients and optimize organ allocation. Moreover, discerning the molecular drivers of VI in HCC may help identify therapeutic targets and lead to improved patient outcomes.
Previous studies have evaluated clinical risk factors and gene signatures for VI in HCC,(10, 11) but predictive biomarkers are not yet part of current clinical practice. Although molecular mechanisms of HCC progression have been extensively studied,(12, 13) the specific driver genes and molecular pathways associated with vascular invasion remain poorly defined. Hence, we undertook this study to comprehensively analyze the genomic and proteomic landscape of HCC with VI. We harnessed the multiplatform genomic data from the TCGA (The Cancer Genome Atlas) study(14) to determine major pathways that are dysregulated in tumors with VI in HCC and identify fibronectin as a potential noninvasive biomarker for invasive HCC.
Materials and Methods
The Cancer Genome Atlas Data
In the TCGA study, surgical resection specimens were collected from patients with HCC who had not received previous treatment. Institutional review boards (IRBs) at each tissue source site (TSS) approved submission to the TCGA. Clinical and histopathological data, including data on VI, were submitted from each TSS after detailed pathology review of the entire tumor specimen. The TCGA biospecimen core subjected each tissue to independent pathology review to confirm the diagnosis of HCC. Complete details of the pathology review are available in the TCGA article on HCC.(14) The liver cancer (Liver Hepatocellular Carcinoma; LIHC) clinical data, processed genomic data, level 3 normalized RNA-sequencing (RNA-seq) data, level 3 microRNA (miRNA) data, and level 3 reverse-phase protein array data were downloaded from the Genomic Data Commons data portal https://portal.gdc.cancer.gov/.(15)
Differential expression and functional pathway analysis
Heatmaps were generated to show a visually interpretable overview of the mRNA, miRNA, and proteomic expression profile of HCC stratified by the presence of VI (Qlucore Omics Explorer, v. 2.2; Lund, Sweden). Differential expression analysis was performed using Qlucore Omics Explorer. Variance filtering was used to reduce noise and the projection score to set the filtering threshold. The “mean = 0, var = 1” setting was used to scale the data. QIAGEN’s Ingenuity Pathway Analysis (IPA; QIAGEN, Redwood City, CA; www.qiagen.com/ingenuity) software was used for pathway analysis and upstream regulatory analysis of differentially expressed genes, miRNAs, and proteins. Differential gene expression was compared against a proprietary gene interaction network database to estimate the probability that a given pathway would be differentially enriched. Upstream regulator analysis in IPA was used to predict upstream transcriptional regulators from the dataset based on the literature and compiled in the Ingenuity Knowledge Base. Significance (P value) and activation score (z-score) were computed by analyzing overlap between the differentially expressed genes in human HCC with microvascular invasion and known targets regulated by the transcriptional regulator. Graphic representations of the data were prepared using the IPA Canonical Pathways Molecular Activity Predictor tool and GraphPad Prism software (version 7; GraphPad Software Inc., La Jolla, CA).
For survival analysis of TCGA data, we derived tumor stratification based on fibronectin 1 (FN1) mRNA expression from cBioportal (https://www.cbioportal.org/) to identify tumors expressing fibronectin 2 times the relative expression (z-score) when compared to its expression distribution in all tumors.
Transgenic Mice
Liver-specific LAP-tTa/tet-o-MYC transgenic lines have been described.(16) Mice received 0.1 mg/mL of doxycycline (DOX; Sigma-Aldrich, St. Louis, MO) in drinking water until 4 weeks of age and then were taken off DOX. Age-matched control mice were of the same genotype, but remained on DOX continuously postbirth. All procedures and housing of animals were in accordance with Stanford’s Administrative Panel for Laboratory Animal Care protocols.
Liquid Chromatography/Mass Spectrometry Analysis
Frozen MYC-HCC and liver tissue samples were used for the assay. Three technical replicate liquid chromatography (LC) with tandem mass spectrometry (MS/MS) runs were performed on each sample. Sample preparation and proteomic quantification methods were based on standard pipelines as described.(17) The resulting MS raw files were searched using Byonic software (version 2.11.0; Protein Metrics, Cupertino, CA) with a Swiss-Prot database referencing mouse proteome (2017; 17,191 entries).
Tissue Microarray Analysis
Deidentified tissue microarray (TMA) slides were obtained from the Mayo Clinic Hepatobiliary SPORE. Slides contained HCC core tissue and matched nontumorous surrounding tissue from a total of 153 patients with HCC and 18 control samples from nonliver tissues. TMA slides were digitally scanned with the 20× objective (0.24-μm/pixel resolution) by a P1000 Pannoramic scanner (3DHistech Corporation, Budapest, Hungary). Quantitative digital image analysis was performed in HALO (Indica Labs, Albuquerque, NM). TMA cores were automatically recognized with the TMA add-on module. Blank cores, cores with <5% intact tissue, or cores with no morphologically recognizable tumor were excluded from analysis. H-scores were calculated with the bright-field area quantification that binned 3,3′-diaminobenzidine (DAB)-positive signals based on optical density for each core.
Immunohistochemistry
Paraffin-embedded tumor sections were deparaffinized by successive incubations in xylene, graded washes in ethanol, and PBS. Epitope unmasking was performed by steaming in 0.01 mol/L of citrate buffer (pH 6.0) for 45 minutes. Paraffin-embedded sections were immunostained with fibronectin (1:100, MAB1918; R&D Systems, Minneapolis, MN) or MYC proto-oncogene, bHLH transcription factor (MYC; 1:150, EP121; Epitomics, Burlingame, CA) overnight at 4°C. Tissue was washed with PBS and incubated with biotinylated antirabbit or antimouse for 30 minutes at room temperature (1:300, Vectastain ABC kit; Vector Labs, Burlingame, CA). Sections were developed using DAB, counterstained with hematoxylin, and mounted with Permount. Images were scanned using a Philips Digital scanner.
FN1 knockdown with Migration and Invasion Assays
Two human HCC cell lines (SK-Hep1 and SNU182) were purchased from ATCC (American Type Culture Collection, Manassas, VA) and maintained in complete DMEM media (Gibco) with 10% fetal bovine serum in a 37°C incubator. Scrambled (scr) small interfering RNA (siRNA; SR30004) and three unique FN1 siRNA duplexes (SR320193) were purchased from Origene, Inc. Trilencer-27 fluorescent-labeled transfection control (SR30002) was used to determine optimal transfection efficiency for each cell line. The siRNA duplex #1 was confirmed to have the highest efficacy of FN1 knockdown among the three unique duplexes. We used qPCR and immunofluorescence assays to confirm FN1 mRNA and protein knockdown, respectively.
Cell invasion across a basement membrane was assessed using a 24-well transwell chamber with 8-μm filter inserts (ab235882; Abcam, Cambridge, UK). We coated the cell insert with a basement membrane extract and seeded 2 × 10⁵ serum-starved SK-Hep1 or SNU182 cells transfected with scr siRNA or FN1 siRNA in the top chamber. Complete media was added to the bottom chamber. Cells invaded the basement membrane matrix and then migrated through a semipermeable membrane over 48 hours. Percentage of cell invasion could then be analyzed directly in a plate reader at 530/590 nm.
Cell migration was assessed using a wound-healing assay. We seeded 1 × 10⁶ SK-Hep1 cells transfected either with scr siRNA or FN1 siRNA per well in a six-well plate and cultured the cells overnight in culture medium. Thereafter, a scratch (wound) was introduced in the confluent cell layer using a yellow tip. Pictures of a defined wound spot were made with a Leica DM16000 microscope at t = 0, 24, 48, and 72 hours (Leica Microsystems). Area of the wound in the microscopic pictures was measured using ImageJ software (National Institutes of Health, Bethesda, MD). Percentage of wound healing was calculated relative to the total wound area at t = 0 hours of the same wound spot.
Clinical study
This study was approved by the IRB of Stanford University (IRB No.: 28374), and all patients provided informed consent before being enrolled in this study. We prospectively collected blood from patients with HCC or cirrhosis alone. Blood samples were obtained at the time of diagnosis of HCC before treatment initiation. Plasma was separated, aliquoted, and stored at −80°C. Clinical data were gathered from patient medical records. Plasma fibronectin, plasminogen activator inhibitor-1 (PAI-1), and vascular endothelial growth factor receptor 2 (VEGFR2) were measured using respective Quantikine ELISA kits from R&D Systems. The ELISA assay for fibronectin recognizes two large human fibronectin fragments—amino acid (aa) 32-1908 and aa 607-1265—and has high specificity. After samples and standards had been appropriately diluted, 50 uL of the appropriate standard or sample was added to each well in duplicates with some amount of assay diluent. After the appropriate time, each well was then washed with wash buffer solution and then the appropriate conjugate was added to each well. The solution was then washed again, and a substrate solution was added, after which a stop solution was added and the plate was read on a plate reader.
Statistical Analysis
Differences between groups were analyzed using the Student t test or one-way ANOVA. The chi-square test was used to compare categorical variables. Kaplan-Meier analysis with the log-rank test was performed for survival analysis. A P value of <0.05 was considered to be significant. All graphs are presented as the mean ± SEM. Analyses were performed with Prism (version 7; GraphPad Software, San Diego, CA).
Results
VI is a Prognostic Factor Associated With Recurrence in HCC
In the TCGA-LIHC cohort (n = 373), VI was present in 34.9% of tumors (n = 111)—macrovascular invasion in 5.8% (n = 17) and microvascular invasion in 29.1% (n = 94; Fig. 1A,B). Prevalence of VI was higher with more advanced tumor stage (14% in stage I, 64% in stage II, and 53% in stage III; P = 0.03; Fig. 1C), more advanced tumor grade (15% in low grade, 46% in moderate/high grade; P = 0.03), and higher serum alpha-fetoprotein (AFP; P = 0.02; Fig. 1C). Recurrence rates were higher in tumors with either microvascular (64%) or macrovascular invasion (65%) compared to those without VI (45%; P < 0.001; Fig. 1D). Presence of macrovascular invasion was associated with worse overall survival when compared to those without VI (3-year, 44% vs. 73%; P = 0.001; Fig. 1E). Presence of either microvascular or macrovascular invasion was associated with significantly worse recurrence-free survival than those without VI (24% vs. 33% vs. 47%; P = 0.001; Fig. 1E). Thus, we demonstrate that the presence of VI in HCC is strongly associated with aggressive tumor behavior and poor clinical outcomes.
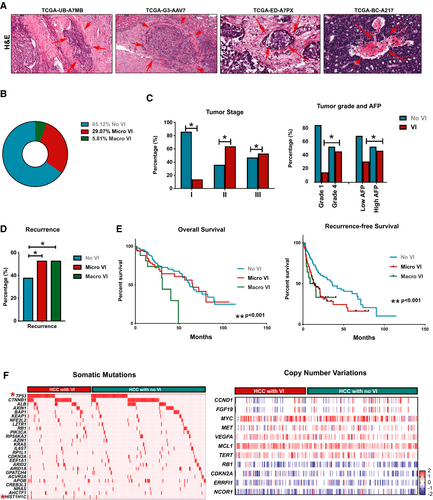
To identify the genetic events that drive VI in human HCC, we initially compared the mutational profile of tumors with or without VI (Fig. 1F). There was a higher incidence of tumor protein p53 (TP53) mutation in tumors with VI (37.5%) than in those without (25%; P = 0.03). Mutation in H1.2 linker histone, cluster member (HIST1H1C), a regulator of chromatin structure, was almost exclusively found in tumors with VI (4.8%) when compared to tumors without (0.5%; P = 0.01). Incidence of all other major somatic mutations was similar between the two groups (Supporting Table S1). Also, we did not find any significant differences in major somatic copy number variations between tumors with or without VI (Fig. 1F; Supporting Table S1). Thus, our data do not reveal a clear genotype-phenotype correlation in tumors with VI, prompting us to further study the transcriptomic and proteomic landscape.
Transcriptional Landscape of HCC With VI
We analyzed the transcriptional profile of HCC to identify genes and pathways dysregulated in tumors with VI. We identified 102 genes which were differentially expressed in tumors with VI, of which 92 genes were overexpressed and 10 genes were underexpressed (Fig. 2A; P < 0.001, fold change ≥ 2, false discovery rate [FDR] < 0.1; Supporting Table S2). Several genes, like cell division cycle 20 (CDC20),(18) exportin for tRNA (XPOT),(19) and sirtuin 7,(20) which are part of this signature, have been previously implicated in the pathogenesis of HCC. Other genes, like general transcription factor IIF subunit 2, endo-beta-N-acetylglucosaminidase, and RCC1 domain-containing 1, have not been previously associated with HCC, but have been implicated in other cancers. Upon comparison of the VI-related gene signature with multiple published prognostic gene signatures of HCC, we found enrichment of gene classes associated with poor outcome in HCC, such as Hoshida subclass S1,(21) Boyault G3 subclass,(22) and Woo liver cancer recurrence signature(23) (Fig. 2B). Next, we performed upstream regulator pathway analysis to identify genetic drivers of the global transcriptional changes. We identified MYC (P = 9.8 × 10⁻⁴), CREB/ATF bZIP transcription factor (CREBZF; P = 2.0 × 10⁻³), homeobox D13 (HOXD13; 4.2 × 10⁻³), activating transcription factor 4 (ATF4; 5.0 × 10⁻³), and zinc finger and BTB domain-containing 17 (ZBTB17; 5.02 × 10⁻³) to be the most significant upstream regulators of the VI-related transcriptome (Fig. 2C,D). We further confirmed that MYC is an important transcriptional regulator of this phenotype by demonstrating that the VI-related gene signature significantly overlapped with several other reported MYC gene signatures (Fig. 2C).
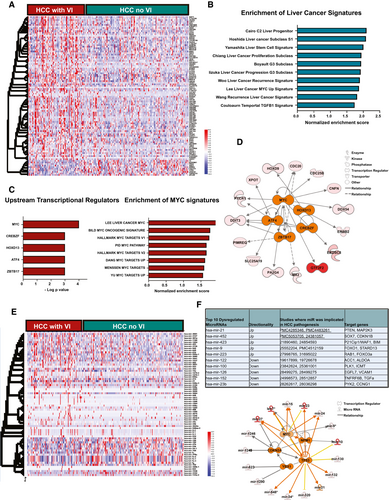
We next identified 70 miRNAs, which were differentially expressed in tumors with VI, of which 23 were overexpressed and 47 were underexpressed (P < 0.001; fold change ≥ 2; FDR < 0.1; Fig. 2E; Supporting Table S2). The top 10 miRNAs and their target genes are shown in Fig. 2F. Some of these miRNAs, like mir-122, mir-21 and mir-100, have been implicated in HCC pathogenesis, but not specifically in promoting VI (Fig. 2F). Target genes of the up-regulated miRNAs, like phosphatase and tensin homolog (PTEN), cyclin-dependent kinase inhibitor 1B (CDKN1B), and cyclin-dependent kinase inhibitor 1A, are known tumor suppressors, whereas gene targets of the suppressed miRNAs, like transforming growth factor alpha (TGFA), vascular cell adhesion molecule 1 (VCAM1), and acetyl-CoA carboxylase 1 (ACC1), have known tumor-promoting roles. These data thus demonstrate how miRNAs can potentially enable the tumor to switch to a more invasive phenotype. We performed upstream regulator analysis and identified TP53 (P = 1.4 × 10⁻¹⁰), MYC (3.4 × 10⁻⁵), cyclin-dependent kinase inhibitor 2A (CDKN2A; P = 1.7 × 10⁻⁴), nucleophosmin 1 (NPM1; P = 1.3 × 10⁻⁴), and Y-box-binding protein 1 (YBX1; P = 9.7 × 10⁻⁴) to be the top five transcriptional regulators of the differentially expressed VI-related miRNAs (Fig. 2F). Thus, our analysis of the transcriptional profile of tumors with VI reveals enrichment of genes and pathways to be associated with an aggressive phenotype and identifies, among others, the MYC oncogene as a common driver of VI in HCC.
Functional Evaluation of the Proteomic Changes in HCC With VI
To understand the functional implications of the genomic and transcriptomic changes, we analyzed the proteomic landscape of tumors with VI given that proteins are ultimately the effectors of cellular function. We compared the expression of 219 proteins between tumors with and without VI and identified 87 proteins to be differentially expressed (Fig. 3A; n = 130, P < 0.001; FDR < 0.1; Supporting Table S3). The top 10 differentially expressed proteins in tumors with VI were noted to be involved in multiple cellular functions, including cell adhesiveness, apoptosis, and metabolism (Fig. 3B). The top VI-related proteins, like fibronectin, PAI-1, and phospho-proliferation and apoptosis adaptor protein 15, have been reported to promote cellular migration in other cancers, but not directly in VI in HCC.(24-26)
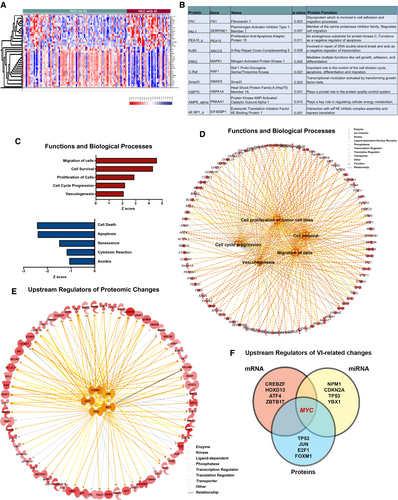
Functional pathway analysis of proteomic changes revealed that biological processes, like cellular viability (P = 6.4 × 10−39), cell migration (P = 4.1 × 10⁻³¹), proliferation (P = 1.5 × 10−49), and angiogenesis (P = 3.5 × 10⁻¹⁴), were significantly up-regulated in tumors with VI, whereas pathways involving apoptosis (3.1 × 10−54) and senescence (7.7 × 10⁻¹⁵) were significantly down-regulated (Fig. 3C,D). We evaluated the upstream transcriptional regulators of the proteomic changes observed. The top five regulators were TP53 (P = 1.4 × 10−37), MYC (P = 8.7 × 10⁻²⁴), Jun proto-oncogene, AP-1 transcription factor subunit (JUN; P = 5.3 × 10⁻²³), E2F transcription factor 1 (E2F1; P = 4.3 × 10⁻²²), and forkhead box M1 (FOXM1; (P = 1.7 × 10⁻¹⁹; Fig. 3E). Meanwhile, tumor-suppressor–regulated pathways, like the RB transcriptional corepressor 1 (RB1) pathway and von-Hippel Lindau pathway, were significantly down-regulated in tumors with VI (Supporting Fig. S1). Thus, the functional analysis of the global proteomic changes associated with VI in HCC clearly portray features of an aggressive tumor phenotype.
Cross-Species Comparative Proteomic Profiling Identifies Fibronectin as a Conserved Biomarker of Invasive HCC
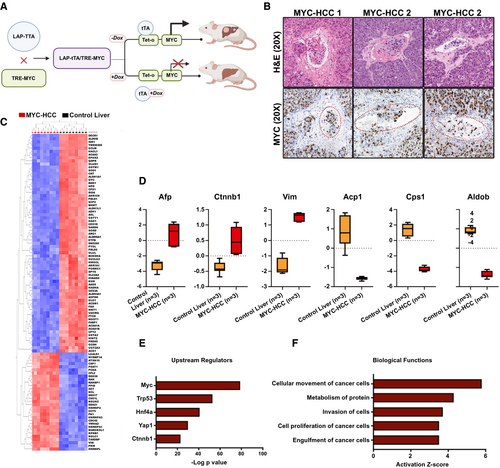
Our data show that MYC oncogene is a consistent upstream regulator of the VI-related mRNA, miRNA, and proteomic changes in HCC (Fig. 3F). This prompted us to further explore vascular invasion in HCC using the murine autochthonous transgenic model of MYC-driven HCC (LAP-tTA/tet-O-MYC; Fig. 4A). We found that VI was a highly prevalent feature of murine MYC-HCC (75%; n = 15 of 20 tumors; Fig. 4B). We evaluated the global proteomic changes associated with MYC-HCC using LC-MS. A total of 392 proteins were overexpressed and 360 proteins were underexpressed in HCC tumor tissue (n = 3) when compared to control mouse liver (n = 3; P < 0.05; FDR < 0.05; fold change ± 2.0; Fig. 4C). We confirmed that proteins like AFP, β-catenin, and vimentin, which are known to be elevated in human HCC, were indeed higher in MYC-HCC, and proteins like carbamoyl-phosphate synthetase 1, acid phosphatase 1, and aldolase B, which are suppressed in human HCC, were lower in MYC-HCC (Fig. 4D). The top upstream regulator of proteomic changes was confirmed to be MYC (P = 8.2 × 10−79), but other genetic drivers of human HCC, like transformation-related protein 53 (Trp53; 4.1 × 10−53) and β-catenin (4.2 × 10⁻²³), were also found to be significant upstream regulators of proteomic changes in MYC-HCC (Fig. 4E). Biological functions, like cancer cell migration (P = 6.9 × 10⁻⁸) and invasiveness (1.4 × 10⁻⁷), were activated in murine MYC-HCC, thus confirming that these tumors have an invasive phenotype (Fig. 4F). Overall, the above analysis demonstrates the robustness of the mouse model and its relevance to VI in human HCC.
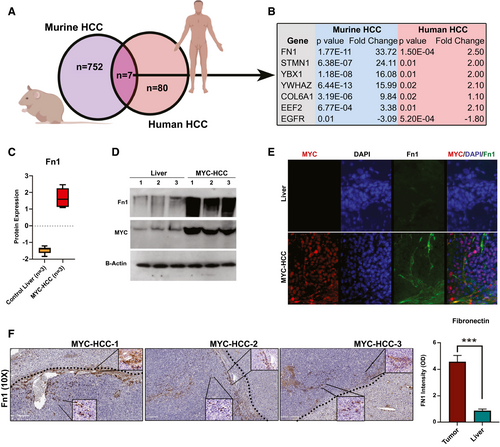
We performed cross-species comparative analyses to identify conserved proteins that are enriched in both MYC-driven murine HCC (n = 759) and human HCC with VI (n = 87). We found seven proteins that overlapped between the two groups (Fig. 5A,B). Among them, fibronectin was the most highly overexpressed protein in both cohorts (mouse Fn1, P = 1.7 × 10⁻¹¹; human FN1, P = 1.5 × 10⁻⁴; Fig. 5C and Supporting Fig. S2). We further confirmed the overexpression of fibronectin in murine MYC-driven HCC by immunoblotting (Fig. 5D). Immunofluorescence staining of primary tumors showed that fibronectin was observed to be overexpressed both in cancer cells and also in tumor stroma of MYC-HCC (Fig. 5E). Moreover, stromal Fn1 expression was found predominantly in perivascular and peritumoral locations, with 10% of cancer cells themselves expressing Fn1 on immunohistochemistry (IHC) staining of MYC-HCC (Fig. 5F).
We have shown that Fn1 is overexpressed in MYC-HCC. We found further mechanistic evidence that MYC promotes the transcription of fibronectin. First, a meta-analysis of chromatin immunoprecipitation sequencing experiments showed multiple instances of MYC binding upstream of the human FN1 gene in the Gene Transcription Regulation Database (GTRD)(27) (Supporting Fig. S3A). Second, motif finding analysis identified multiple MYC-binding sites in the promoter region of FN1 in the data from the Eukaryotic Promoter Database (EPD)(28) (Supporting Fig. S3B). Third, using the Encyclopedia of DNA Elements (ENCODE) database, we identified FN1 to be a transcriptional target gene of MYC based on the presence of the MYC-binding site near the transcription start site of FN1.(29) Last, we have found that MYC levels positively and significantly correlated with FN1 levels in 13 solid tumors in the TCGA pan-cancer database, including HCC (Supporting Fig. S3C). Taken together, these data show that MYC transcriptionally regulates expression of FN1 in cancer cells.
Fibronectin Promotes Human HCC Cancer-Cell Invasiveness and Migration
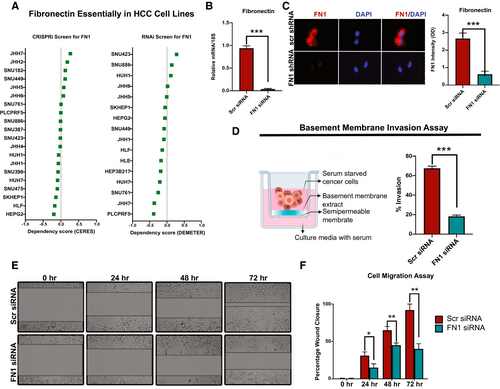
We evaluated the functional role of fibronectin in human HCC. We analyzed data from the cancer-dependency map data on genome-wide CRISPR interference (CRISPRi) and RNA interference (RNAi) screens to evaluate whether fibronectin-knockout impacted HCC cell-line survival or viability.(30-32) Of the 20 HCC cell lines, none of them showed a low-dependency score either on CRISPRi or RNAi screens, indicating that FN1 was not essential for HCC cancer-cell viability or proliferation (Fig. 6A). To evaluate the functional role of FN1 in HCC, we knocked down FN1 expression in two HCC cell lines (SKHep1 and SNU182), both of which had neutral dependency scores, using dicer-substrate 27mer duplex siRNAs. We confirmed FN1 mRNA and protein knockdown using qPCR and immunofluorescence, respectively (Fig. 6B,C and Supporting Fig. S4A). Given that FN1 was found to be associated with VI in human HCC, we evaluated whether it played a role in cancer cell invasiveness using a basement membrane invasion assay. Cells with FN1 knockdown had decreased ability to invade through a layer of basement membrane extract in the Boyden chamber assay (mean percent invaded cells, 18.3% vs. 64.5%; P < 0.0001; Fig. 6D and Supporting Fig. S4B) compared to control cells. We also showed that SKHep1 cells with FN1 knockdown had decreased migratory capacity, in the wound-healing assay, when compared to control cells (mean percent wound closure at 72 hours, 40% vs. 92%; P = 0.0004; Fig. 6E,F). Thus, FN1 promotes the invasive and migratory capacity of HCC cancer cells.
Validation of Fibronectin Tissue Expression in Human HCC
Our exploratory cross-species proteomic analysis identifies fibronectin to be a conserved protein associated with invasive HCC. In the TCGA cohort, fibronectin protein expression in the tumor correlated not just with vascular invasion, but also with more advanced tumor stage (P = 0.01) and higher tumor grade (P = 0.08; Supporting Fig. S5A). Moreover, higher FN1 mRNA expression was associated with poor recurrence-free survival (high FN1 7.4 months vs. low FN1 21.6 months; P = 0.001; HR, 2.4; Supporting Fig. S5B).
In order to further validate these findings, we used an independent cohort of patients from whom paired samples of HCC and surrounding nontumorous cirrhotic tissue (n = 153) were available in a TMA. We compared the expression of FN1 in HCC against expression in control/nonliver tissue (n = 18) or peritumoral cirrhotic liver (n = 153). FN1 expression was significantly higher in HCC tumor tissue compared to nontumorous surrounding cirrhotic tissue (staining intensity score, H = 27.8 vs. H = 17.5; P = 0.0007) and also nonliver control tissue (staining intensity score, H = 27.8 vs. H = 8.7; P = 0.007; Fig. 7A,B). The percentage of cells which were positive for FN1 expression in HCC was higher than in cirrhosis without HCC (25.3% vs. 17%; P = 0.002) or control nonliver tissue (25.3% vs. 8.9%; P = 0.01). Overall, 28% of the HCCs had low FN1 expression, and 72% had moderate-to-high FN1 expression. Additionally, we evaluated protein expression data for fibronectin from the Human Pathology Protein Atlas (HCPA) database of the public repository of liver cancer samples (n = 12).(33) Consistent with our TMA findings, fibronectin was expressed in all HCC tumors, and a majority (75%; n = 9) had moderate-to-high expression of fibronectin with 25% having low expression (Supporting Fig. S6). These data confirm that fibronectin is significantly overexpressed in human HCC compared to noncancerous cirrhosis tissue.
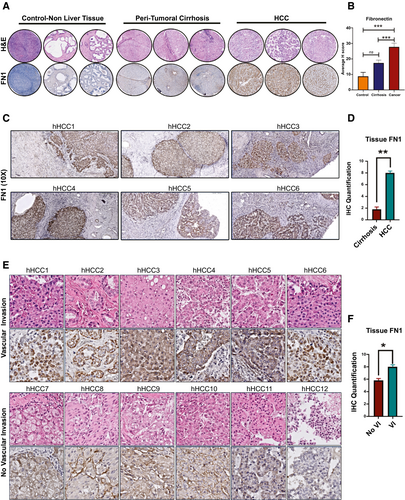
To validate the association between FN1 expression and VI in HCC, we analyzed the expression of FN1 in a separate cohort of archived human HCC whole-slide tissues (n = 12) and compared tumors with known VI (n = 6) and those without (n = 6). The two groups were matched for primary tumor stage and etiology of cirrhosis. Consistent with TMA findings, HCC tissue showed higher levels of FN1 expression compared to surrounding nontumorous liver tissue (H score, 8.0 vs. 1.8; P < 0.001; Fig. 7C,D). Furthermore, we observed that FN1 expression was higher in tumors with microvascular invasion than in those without (H score, 8.2 vs. 5.8; P = 0.001; Fig. 7E,F). Interestingly, we additionally found that fibronectin was consistently overexpressed in tumor emboli within the microvasculature of tumors with VI (Supporting Fig. S7). These data validate that tumor FN1 expression is associated with VI in human HCC.
Fibronectin as a Noninvasive Biomarker of Advanced HCC
Last, we evaluated whether fibronectin can serve as a noninvasive plasma biomarker of HCC. To do this, we performed a pilot case-control study by prospectively recruiting patients with HCC (n = 35) and those with cirrhosis without HCC (n = 10) who were matched for age, sex, ethnicity, and etiology of cirrhosis (Fig. 8A). Plasma fibronectin levels were significantly elevated in patients with HCC (mean = 307.7 μg/mL; SEM = 39.9) compared to non-HCC controls with cirrhosis (mean = 41.8 μg/mL; SEM = 13.3; P = 0.0003; Fig. 8B). In contrast, plasma levels of PAI-1 and VEGFR2, two other proteins that were elevated in HCC tissue in the TCGA cohort, were not elevated in plasma of patients with HCC—patients with cirrhosis alone did not have a higher plasma PAI-1 (mean = 4.1 μg/mL; SEM = 7.1) or VEGFR2 (mean = 13.20 μg/mL; SEM = 3.81) compared to patients with HCC-PAI-1 (mean = 4.3 μg/mL; SEM = 4.2; P = 0.81) and VEGFR2 (mean = 17.31 μg/mL; SEM = 4.71; P = 0.55; Fig. 8B). AFP, an established biomarker of HCC, was elevated, but was not significantly different, between patients with cirrhosis (mean = 5.5 ng/mL; SEM = 1.0) and HCC (mean = 3,446.9 μg/mL; SEM = 2,277.5; P = 0.196).
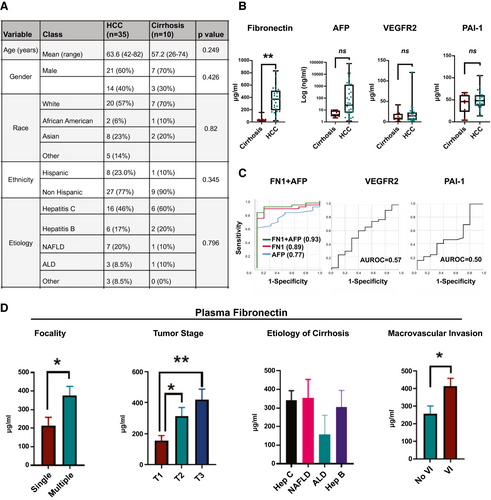
Sensitivity of FN1 in diagnosing HCC was 92% and specificity 88% with an FN1 cutoff of 100 μg/mL. When the cutoff was increased to 160 μg/mL, sensitivity fell to 88% and specificity increased to 100%. AFP had a sensitivity of 88% and specificity of 40%, with a cut-off value of 4 ng/mL. Combining AFP and FN1 (combined AUC, 0.93 [0.84-1.00]) improved AUC more than either FN1 (AUC, 0.89 [0.79-0.99]) or AFP alone (AUC, 0.77 [0.63-0.90]; Fig. 8C). AUCs for PAI-1 (0.56; 95% CI, 0.35-0.78; P = 0.535) and VEGFR2 (0.57; 95% CI, 0.35-0.78; P = 0.596) were poor (Fig. 8C). FN1 levels were statistically higher in patients with multifocal HCC (mean, 377 vs. 214 μg/mL: P = 0.02) and in the advanced stage of HCC (mean, T1 [n = 9] = 154 vs. T2 [n = 14] = 312 vs. T3 (n = 11) = 419 μg/mL; P < 0.05; Fig. 8D). FN1 levels did not vary based on etiology of liver disease (Fig. 8D). Last, consistent with tissue fibronectin expression, plasma FN1 was higher in patients whose tumors had VI (mean, 414 μg/mL) versus those who did not (mean, 258 μg/mL; P = 0.04; Fig. 8D). In contrast, serum AFP levels were not predictive of tumor stage (P = 0.482) or VI (0.415). Thus, fibronectin is a promising noninvasive plasma proteomic biomarker of invasive HCC.
Discussion
Presence of VI portends aggressive tumor behavior and poor clinical outcome in HCC. Our study evaluates the proteogenomic topography of tumors with VI to elucidate the key molecular drivers of this phenotype. Functional pathway analysis of transcriptomic and proteomic changes reveals up-regulation of multiple pathways and processes that promote invasiveness, thus demonstrating the coordinated impact of these changes. We found that the MYC oncogene was a consistent upstream regulator of significant changes in VI-related mRNAs, miRNA, and proteins. We performed a cross-species comprehensive proteomic analysis comparing proteomic changes in MYC-driven murine HCC and human HCC with VI and identified fibronectin as a biomarker conserved across both species. We demonstrate that fibronectin mechanistically promotes HCC cancer-cell migration and invasiveness. Moreover, we validate the role of fibronectin as a tissue and plasma biomarker of VI in HCC using two independent clinical cohorts. Thus, we perform a multiplatform functional analysis of HCC, identifying MYC as a major genetic driver of VI and fibronectin as a potential biomarker.
Our functional analysis of the molecular landscape of HCC reveals pathways involved in cellular migration, invasion, and angiogenesis to be enriched in tumors with VI, whereas antitumor pathways involving apoptosis and senescence were suppressed. These global genetic and epigenetic changes thus appear to promote VI in a coordinated fashion. Previous studies have generally focused on individual genes or proteins associated with VI, but the precise causal drivers of this phenotype are open for investigation. We performed upstream regulatory pathway analysis of mRNA, miRNA, and proteomic changes to identify the driver mechanisms. The transcription factor, MYC, was consistently found to be an upstream regulator of the changes in all three platforms—mRNA, miRNA, and proteomics. The MYC oncogene is frequently genetically amplified or transcriptionally overexpressed in HCC.(14, 34) MYC has been shown to promote angiogenesis and invasiveness in other cancers,(35, 36) but has not been shown to play a causal role in VI in HCC. We did not find that MYC amplifications or MYC mRNA-expression levels directly predicted VI. However, the VI-related gene signature strongly overlapped with multiple MYC signatures, suggesting that the downstream transcriptional effects of MYC drive VI. Consistent with this finding, our analysis of MYC-driven murine HCC demonstrated a high prevalence of VI. In addition, we present evidence that MYC up-regulates transcription of fibronectin, which in turn promotes cancer-cell migration and invasiveness, thus providing a mechanistic link between MYC, fibronectin, and invasive HCC. There has been significant recent progress in developing direct or indirect anti-MYC therapeutics, which in the future can potentially be used to target tumors with VI.(37-40)
We adopted a cross-species comparative approach to identify proteins predictive of VI that were conserved across species and hence more likely to have translational relevance. This approach allowed us to determine fibronectin as a promising predictive biomarker of VI in HCC. Transcriptome-based analysis of tissues with VI has previously identified multiple predictive gene signatures.(10, 41) However, difficulty in obtaining tissue samples for validation, lack of tractable assays, and intertest variability are challenges in translating these microarray- or RNA-seq-based gene signatures to the bedside. Conversely, proteins have been successfully used, both for early detection and risk stratification, in multiple cancers. Fibronectin, a glycoprotein that modulates interactions with the extracellular matrix, has been shown to be overexpressed in HCC tissue(42, 43) and also identified as a potential plasma biomarker of HCC in an Asian cohort of predominantly hepatitis B patients.(44, 45) We here show that fibronectin has the potential to serve as a noninvasive biomarker of VI, especially in combination with AFP. We validated the overexpression of fibronectin in independent cohorts of human HCC tissue and also in plasma of patients with HCC. Further evaluation of FN1 as a biomarker of VI will require a large, rigorous, prospective study, which we plan to pursue next. Fibronectin-targeting MR contrast agents have been developed and used successfully to detect breast-cancer micrometastases(46) and can potentially be used as an imaging biomarker of VI in HCC.
In conclusion, the current study highlights the distinct molecular profile of tumors with VI, thus advancing our understanding of this clinically relevant, aggressive subtype of HCC. We identify the MYC oncogene as a major driver of this phenotype and propose that fibronectin is a promising predictor of invasive HCC.
Acknowledgment
R.D. was supported by National Institutes of Health (NIH) grant CA222676 from the National Cancer Institute (NCI), American College of Gastroenterology Junior Faculty Career Development Grant. D.F. was supported by NIH grant CA208735, NIH R01 CA184384, and NIH U01 CA188383 from the NCI. Pauline Chu is acknowledged for tissue processing and Ivanshi Ahuja for image analysis. This project was supported by Award Number P50 CA210964 (Mayo Clinic Hepatobiliary SPORE) from the National Cancer Institute. The content is solely the responsibility of the authors of this article and does not necessarily represent the official views of the NCI or the NIH.
Author Contributions
M.K.: data curation, formal analysis, validation, visualization, and writing (original draft); A.R.: data curation, formal analysis, and visualization; V.A.: data curation, methodology, and formal analysis; J.P.: data curation, methodology, and formal analysis; F.M.: data curation, methodology, and formal analysis; A.B.: data curation, methodology, and formal analysis; O.G.: data curation, methodology, and formal analysis; D.H.: data curation, resources; J.Y.: formal analysis, resources; M.N.: resources, writing-review and editing; N.K.: resources, formal analysis, and writing-review and editing; S.P.: resources, formal analysis, and writing-review and editing; D.F.: resources, writing-review and editing; and R.D.: conceptualization, formal analysis, funding acquisition, supervision, visualization, and writing-review and editing.


