HepatoScore-14: Measures of Biological Heterogeneity Significantly Improve Prediction of Hepatocellular Carcinoma Risk
Abstract
Background and Aims
Therapeutic, clinical trial entry and stratification decisions for hepatocellular carcinoma (HCC) are made based on prognostic assessments, using clinical staging systems based on small numbers of empirically selected variables that insufficiently account for differences in biological characteristics of individual patients’ disease.
Approach and Results
We propose an approach for constructing risk scores from circulating biomarkers that produce a global biological characterization of individual patient’s disease. Plasma samples were collected prospectively from 767 patients with HCC and 200 controls, and 317 proteins were quantified in a Clinical Laboratory Improvement Amendments–certified biomarker testing laboratory. We constructed a circulating biomarker aberration score for each patient, a score between 0 and 1 that measures the degree of aberration of his or her biomarker panel relative to normal, which we call HepatoScore. We used log-rank tests to assess its ability to substratify patients within existing staging systems/prognostic factors. To enhance clinical application, we constructed a single-sample score, HepatoScore-14, which requires only a subset of 14 representative proteins encompassing the global biological effects. Patients with HCC were split into three distinct groups (low, medium, and high HepatoScore) with vastly different prognoses (medial overall survival 38.2/18.3/7.1 months; P < 0.0001). Furthermore, HepatoScore accurately substratified patients within levels of existing prognostic factors and staging systems (P < 0.0001 for nearly all), providing substantial and sometimes dramatic refinement of expected patient outcomes with strong therapeutic implications. These results were recapitulated by HepatoScore-14, rigorously validated in repeated training/test splits, concordant across Myriad RBM (Austin, TX) and enzyme-linked immunosorbent assay kits, and established as an independent prognostic factor.
Conclusions
HepatoScore-14 augments existing HCC staging systems, dramatically refining patient prognostic assessments and therapeutic decision making and enrollment in clinical trials. The underlying strategy provides a global biological characterization of disease, and can be applied broadly to other disease settings and biological media.
Abbreviations
-
- AFP
-
- alpha-fetoprotein
-
- BCLC
-
- Barcelona Clinic Liver Cancer
-
- CI
-
- confidence interval
-
- CLIP
-
- Cancer of the Liver Italian Program
-
- CTP
-
- Child-Turcotte-Pugh
-
- ECOG
-
- Eastern Cooperative Oncology Group
-
- ELISA
-
- enzyme-linked immunosorbent assay
-
- HBV
-
- hepatitis B virus
-
- HCC
-
- hepatocellular carcinoma
-
- HR
-
- hazard ratio
-
- IGF
-
- insulin-like growth factor
-
- mOS
-
- median overall survival
-
- NA
-
- not available
-
- OS
-
- overall survival
-
- TNM
-
- tumor-node-metastasis
Hepatocellular carcinoma (HCC) is the fifth most common cancer worldwide and the third-leading cause of cancer-related deaths. In addition, its incidence is increasing in developing countries, and is the fastest growing cause of cancer-related mortality in men in the United States. We previously reported on the effect of multiple factors (hepatitis viral infection, smoking, alcohol consumption, hormonal intake, occupational exposure, chronic medical conditions, and obesity) on HCC diagnosis and prognosis,(1-6) which contribute to heterogeneity in tumor biology and clinical outcomes. Additionally, more than 80% of patients present with advanced disease and underlying cirrhosis,(7) preventing curative treatment options, with surgical treatment only available to a small population of patients in whom HCC is diagnosed at an early stage.(8) Although a number of systemic therapy options became available for patients with advanced HCC recently, the prognosis for HCC is poor, with an estimated 5-year survival rate of less than 10%. This is at least partly due to the lack of validated biomarkers and staging systems to better select candidates for therapy and predict clinical outcomes.
A number of staging systems for HCC exist, including several that include individual tumor parameters, molecular markers, and factors to assess the severity of underlying cirrhosis. These include the Cancer of the Liver Italian Program (CLIP)(9) and Barcelona Clinic Liver Cancer (BCLC) systems.(10) These, along with liver scoring systems like the Child-Turcotte-Pugh (CTP) score(11, 12) and recent modifications including the insulin-like growth factor (IGF)-1(13-15) and albumin-bilirubin(16) scores, are used to predict treatment outcome and guide therapeutic decisions for patients with HCC.
Although their use is standard in clinical practice and trials stratification, these systems are limited in scope, as they look at a small number of clinical parameters, and alpha-fetoprotein (AFP) is the only tumor-related biomarker. Therefore, these systems do not capture the interpatient biological heterogeneity that is a key hallmark of cancer, and this is evident in the marked heterogeneity remaining within levels of existing staging systems. We hypothesized that this heterogeneity can be further explained using plasma measurements of proteins in a broad panel of biomarkers encompassing a vast array of biological activities in numerous HCC-relevant molecular pathways.
Instead of using the conventional approach of building a supervised prognostic signature by selecting a subset of clinical factors and biomarkers associated with patient survival or other clinical factors, we developed an unsupervised approach. Hypothesizing that the heterogeneity in patients with HCC can be explained by quantifying the degree of aberration in their global circulating protein profiles relative to those of normal controls, we repurposed deconvolution algorithms designed for estimating solid tumor purity to construct a circulating biomarker aberration score using a broad panel of circulating biomarkers and assessed the ability of this scoring system to explain interpatient heterogeneity in HCC.
Patients and Methods
Study Design and Sample Collection
This investigation was part of an active hospital-based case-control study approved by the University of Texas MD Anderson Cancer Center Institutional Review Board in 2000. Written informed consent was obtained from each participant. They were required to have a pathologically or radiologically confirmed diagnosis of HCC and US residency. Exclusion criteria included the presence of other types of primary liver cancer, unknown primary tumors, and concurrent or past history of cancer at another organ site. Control subjects were healthy, genetically unrelated family members (e.g., spouses) of patients at MD Anderson with cancers other than liver, gastrointestinal, lung, or head and neck cancer. Detailed clinical variables at the time of blood draw were collected (Supporting Table S1). In total, 767 patients with HCC and 200 healthy controls were included in this investigation.
Measuring Circulating Protein Concentration
Plasma protein concentrations were measured by Myriad RBM (Austin, TX), a Clinical Laboratory Improvement Amendments–certified biomarker testing laboratory. A multiplexed immunoassay panel containing 317 biomarkers (DiscoveryMAP v.3.3; Myriad RBM) was used to quantitate plasma proteins on an automated, Luminex xMAP-based platform (Austin, TX). Sample handling and processing details are found in the Supporting Information. For a subset of 110 patients with HCC, the 14 proteins comprising the HepatoScore-14 were measured by gold-standard methods (i.e., enzyme-linked immunosorbent assay [ELISA]), to validate HepatoScore-14 and show robustness to measurement platform.
Statistical Methods
 represent the abundance of protein
  from a plasma sample for patient
  for a set of proteins
  on the Myriad RBM panel, and let
  represent the protein abundance for healthy controls
  , for the same set of proteins. The protein intensities for the control samples are assumed to follow log-normal distributions,
 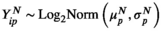 , characterizing the normal circulating protein profile for healthy controls. Assuming the circulating protein profile for each patient with HCC has a normal component and an aberrant component that is induced by the HCC, the distribution of protein intensities for the patients with HCC is modeled as an additive mixture of these components using the model
 ()
()where 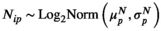 represents the normal component for circulating protein
  , and
, and 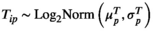 represents the corresponding aberrant component. The patient-specific mixing proportion
  is the HepatoScore, with
  indicating that patient
  has an essentially normal circulating protein biomarker profile,
  of near 1 indicating that patient
  has an extremely aberrant profile, and
  in between the two indicating a moderately aberrant profile. The HepatoScore is an aggregate patient-level score computed using all measured circulating protein biomarkers, making it a global score that encompasses information across the numerous HCC-relevant molecular pathways represented in the protein biomarker panel. Model 1 was first introduced to estimate the proportion normal contamination in solid tumors using the method DeMixT,(17) and here was repurposed for use with blood samples. The model fit uses an iterated conditional mode algorithm that provides simultaneous estimates of the location/scale parameters of the aberrant distribution for each protein (
 and
and  ) and the patient-specific HepatoScore (
 ). In principle, alternative deconvolution algorithms or mixture models could be used to construct such a score, but we choose DeMixT, given its outstanding performance in solid tumor settings.(17)
Statistical Analysis of Prognostic Factors
After viewing the distribution of HepatoScores in the patients with HCC (Fig. 1), they were grouped into three clusters: low ( ), medium (
 , and high (
 ) HepatoScore. The groups were compared using log-rank tests. To determine whether the HepatoScore explains additional heterogeneity within the patient subgroups defined using existing prognostic factors and staging systems, survival differences across the three HepatoScore groups were also assessed within each subgroup. To assess the prognostic separability provided by the single sample HepatoScore-14 (see subsequently), we fit Cox regression models and computed C-index(18) and the corresponding 95% confidence intervals(19) for HepatoScore-14 and compared them with existing prognostic systems (CLIP, BCLC, CTP score), and to assess its independent prognostic ability over and above existing systems and factors, we fit Cox regression models including HepatoScore-14 and one of the existing prognostic systems (CLIP, BCLC, or CTP score) or a set of clinical prognostic factors (performance status, portal vein thrombosis, tumor morphology, and metastasis).

Algorithm For Single-Sample Calculation of the Hepatoscore-14 For Clinical Use
The HepatoScore for each patient was obtained by joint fitting of model (1), which is not feasible for clinical application with future patient plasma samples, and requires a large number of proteins. Thus, a model was constructed to recapitulate the HepatoScore using only a small subset of representative proteins that could be applied to a single patient’s plasma sample (HepatoScore-14). Splitting the patient samples into a training cohort of 500 samples and a test cohort of 267 samples, we assessed a number of different statistical modeling strategies to predict the global HepatoScore from a subset of proteins selected using one of a number of different variable selection techniques. The best method was selected in the training cohort using five-fold cross validation as the HepatoScore-14, and then its performance in recapitulating the global HepatoScore was assessed in the test cohort. Details are provided in the Supporting Information.
Validation and Reproducibility of Results
Note that HepatoScore was not constructed using overall survival (OS) or known clinical factors, so the survival results we present serve as validation of its use as a risk score. However, to rigorously validate and demonstrate the reproducibility of our results, we randomly split the patients into training and test cohorts of 383 samples each, repeated the entire analytical process underlying the construction of HepatoScore and HepatoScore-14 models in samples in the training cohort plus control group, and then applied the resulting score onto the test cohort and compared the median OS among low/medium/high groups overall and within each prognostic subgroup. We repeated this process for 100 random splits and summarized results. We also applied HepatoScore-14 to a subset of 110 patient blood samples, adapting the model using ELISA to measure the HepatoScore-14 proteins for additional validation and assessment of platform robustness. Details are found in the Supporting Information.
Results
HepatoScore Explains Substantial Interpatient Heterogeneity
Supporting Table S2 summarizes the demographic and clinical characteristics of the patients with HCC and control subjects. The HepatoScore distribution in patients with HCC (Fig. 1) reveals three clusters: one with a HepatoScore of about 0 having normal-like proteomic profiles, another with a HepatoScore of about 1, and a third with a HepatoScore in between. We found that 17.5% of the patients had a low HepatoScore (<0.3), 51.4% had a high HepatoScore (>0.8), and 31.1% had a medium HepatoScore (0.3-0.8).
Figure 2 is a heat map of the normalized circulating biomarker log-intensities, with the patients ordered according to HepatoScore and the normal and aberrant location parameters  and
and  in the left and right margins, respectively. Visually evident in the heat map is that patients with a low HepatoScore had normal-like profiles, patients with an increasing HepatoScore had increasingly aberrant profiles, and that the HepatoScore captures a global pattern evident in the entire circulating proteome, encompassing many hallmarks of cancer, not just a select few biomarkers.

Although determined from circulating biomarkers without using any clinical outcomes, the patients in the three groups had vastly different OS distributions (P < 0.0001) (Table 1, Fig. 3, and Supporting Table S3). Specifically, patients with a low HepatoScore had the best prognosis (median OS [mOS], 38.2 months [95% confidence interval (CI), 28.9-67.3]), those with a high HepatoScore had the worst prognosis (mOS, 7.1 months [95% CI, 5.9-8.9]), and those with a medium HepatoScore had a moderate prognosis (mOS, 18.3 months [95% CI, 15.7-23.0]).
| Factor | Overall | Number (%) and Median OS Duration (95% CI) | P Value | ||
|---|---|---|---|---|---|
| Low HepatoScore | Medium HepatoScore | High HepatoScore | |||
| All patients | 766 | 134 (17.4) | 238 (31.1) | 394 (51.4) | <0.0001 |
| 14.2 (12.0-16.1) | 38.2 (28.9-67.3) | 18.3 (15.7-23.0) | 7.1 (5.9-8.9) | ||
| Metastasis | |||||
| No | 575 | 107 (18.6) | 190 (33.0) | 278 (48.4) | <0.0001 |
| 17.4 (15.0-20.5) | 62.4 (33.8-NA) | 20.4 (16.9-25.1) | 9.4 (7.5-12.0) | ||
| Yes | 189 | 27 (14.3) | 47 (24.9) | 115 (60.9) | <0.0001 |
| 6.4 (5.3-9.2) | 22.0 (14.9-46.1) | 10.1 (6.8-18.4) | 3.9 (3.1-5.7) | ||
| Lymph node involvement | |||||
| No | 608 | 110 (18.1) | 196 (32.2) | 302 (49.7) | <0.0001 |
| 16.4 (14.3-18.4) | 42.8 (30.3-71.5) | 20.3 (16.9-25.1) | 8.9 (7.06-11.6) | ||
| Yes | 156 | 24 (15.4) | 41 (26.3) | 91 (58.3) | <0.0001 |
| 6.8 (5.1-9.8) | 25.8 (19.5-NA) | 9.8 (6.8-20.4) | 4.0 (3.2-5.2) | ||
| ECOG score | |||||
| 0 | 321 | 91 (28.3) | 105 (32.7) | 125 (38.9) | <0.0001 |
| 22.7 (18.3-27.8) | 50.6 (30.3-NA) | 21.9 (16.1-30.3) | 12.7 (9.4-18.5) | ||
| 1 | 343 | 34 (9.9) | 115 (33.5) | 194 (56.6) | <0.0001 |
| 12.1 (9.7-15.0) | 33.8 (17.9-92.1) | 17.9 (14.8-23.0) | 7.4 (6.1-10.1) | ||
| 2+ | 102 | 9 (8.9) | 18 (17.7) | 75 (73.5) | <0.0001 |
| 4.7 (3.5-5.8) | 22.6 (12.7-NA) | 5.3 (4.6-NA) | 3.4 (2.0-5.1) | ||
| Vascular invasion | |||||
| No | 523 | 119 (22.8) | 168 (32.1) | 236 (45.1) | <0.0001 |
| 19.2 (17.0-22.0) | 46.1 (30.3-92.1) | 23.0 (17.5-27.7) | 10.6 (8.6-14.2) | ||
| Yes | 241 | 15 (6.2) | 69 (28.6) | 157 (65.2) | <0.0001 |
| 5.8 (5.2-7.1) | 11.1 (5.9-NA) | 9.5 (6.3-17.9) | 4.8 (3.9-5.7) | ||
| Pathology | |||||
| Well | 192 | 40 (20.8) | 66 (34.4) | 86 (44.8) | <0.0001 |
| Differentiated | 18.9 (15.7-25.1) | 62.4 (33.8-NA) | 25.1 (17.0-33.7) | 9.7 (5.4-16.5) | |
| Moderately differentiated | 211 | 44 (20.9) | 69 (32.7) | 98 (46.4) | <0.0001 |
| 14.7 (11.6-19.6) | 38.2 (24.4-NA) | 20.4 (15.5-20.1) | 6.7 (5.8-10.9) | ||
| Poorly differentiated | 120 | 17 (14.2) | 38 (31.7) | 65 (54.2) | <0.0001 |
| 8.2 (6.4-12.2) | 30.3 (12.4-NA) | 11.6 (7.6-23.0) | 5.4 (4.0-7.6) | ||
| AFP level | |||||
| ≤400 | 515 | 111 (21.6) | 161 (31.3) | 243 (47.2) | <0.0001 |
| 21.3 (17.9-23.5) | 62.4 (35.4-NA) | 23.5 (19.7-29.2) | 12.4 (9.0-15.3) | ||
| >400 | 251 | 23 (9.2) | 77 (30.7) | 151 (60.2) | <0.0001 |
| 5.8 (5.1-7.1) | 16.7 (7.1-30.3) | 9.4 (7.6-14.7) | 4.2 (3.5-5.3) | ||
| IGF-1 level | |||||
| ≥2 6 | 518 | 112 (21.6) | 186 (35.9) | 220 (42.5) | <0.0001 |
| 18.4 (16.2-21.6) | 50.6 (31.6-92.1) | 19.7 (16.2-25.1) | 10.6 (8.6-14.5) | ||
| <26 | 87 | 0 (0.0) | 8 (9.2) | 79 (90.8) | 0.017 |
| 4.3 (3.3-7.2) | 22.5 (17.4-NA) | 3.7 (3.1-6.7) | |||
| TNM stage | |||||
| 1 | 107 | 40 (37.3) | 33 (30.8) | 34 (31.8) | <0.0001 |
| 36.4 (30.8-47.0) | 92.1 (36.7-NA) | 36.6 (28.8-NA) | 19.2 (13.7-38.9) | ||
| 2 | 145 | 26 (17.9) | 50 (34.5) | 69 (47.6) | 0.003 |
| 25.1 (12.5-32.3) | 42.8 (22.7-NA) | 29.6 (21.3-41.9) | 21.5 (17.4-29.1) | ||
| 3 | 234 | 22 (9.4) | 81 (34.6) | 131 (56.0) | <0.0001 |
| 9.0 (7.4-11.8) | 17.9 (11.1-NA) | 11.7 (9.0-16.4) | 6.5 (5.4-9.0) | ||
| 4 | 257 | 39 (15.2) | 69 (26.8) | 149 (58.0) | <0.0001 |
| 7.1 (5.8-9.8) | 22.6 (17.1-NA) | 10.9 (8.8-19.2) | 4.2 (3.6-5.2) | ||
| Okuda stage | |||||
| 1 | 384 | 102 (26.6) | 147 (38.3) | 135 (35.2) | <0.0001 |
| 21.4 (18.5-24.8) | 42.8 (28.9-107.1) | 20.4 (17.5-24.8) | 15.3 (12.4-19.7) | ||
| 2 | 328 | 24 (7.3) | 87 (26.5) | 217 (66.2) | <0.0001 |
| 7.2 (5.9-9.0) | 24.8 (19.5-NA) | 12.2 (9-23.2) | 5.3 (4.7-6.5) | ||
| 3 | 29 | 0 (0.0) | 1 (3.4) | 28 (96.6) | 0.57 |
| 1.7 (0.9-2.9) | 1.1 (NA-NA) | 1.9 (0.9-3.1) | |||
| CTP score | |||||
| A | 411 | 105 (25.6) | 159 (38.7) | 147 (35.8) | <0.0001 |
| 17.4 (15.1-21.8) | 36.7 (25.9-67.3) | 19.6 (16.1-25.1) | 9.9 (7.7-13.7) | ||
| B | 299 | 29 (9.7) | 78 (26.1) | 192 (64.2) | <0.0001 |
| 10.9 (8.3-15.6) | 107.2 (21.1-NA) | 17.4 (9.8-25.6) | 7.2 (5.8-10.0) | ||
| C | 56 | 0 (0.0) | 1 (1.8) | 55 (98.2) | 0.225 |
| 2.8 (2.0-3.9) | 1.1 (NA-NA) | 2.8 (2.0-3.9) | |||
| IGF-CTP score | |||||
| A | 390 | 112 (28.7) | 158 (40.5) | 120 (30.8) | <0.0001 |
| 21.8 (18.4-25.6) | 50.6 (31.6-92.1) | 19.7 (16.4-25.1) | 14.2 (9.9-18.9) | ||
| B | 151 | 0 (0.0) | 35 (23.2) | 116 (76.8) | 0.002 |
| 9.8 (6.6-16.2) | 20.4 (11.8-37.8) | 7.2 (5.6-11.8) | |||
| C | 57 | 0 (0.0) | 0 (0.0) | 57 (100) | NA |
| 3.1 (2.0-4.7) | 3.1 (2.0-4.7) | ||||
| BCLC stage | |||||
| 0-A | 50 | 23 (46.0) | 14 (28.0) | 13 (26.0) | 0.011 |
| 41.6 (36.2-69.7) | NA (31.6-NA) | 41.6 (36.6-NA) | 34.4 (23.7-NA) | ||
| B | 122 | 32 (26.2) | 44 (36.1) | 46 (37.7) | <0.0001 |
| 25.6 (19.8-31.7) | 42.8 (30.3-NA) | 25.6 (16.9-45.7) | 18.9 (14.5-29.1) | ||
| C | 550 | 75 (13.6) | 172 (31.3) | 303 (55.1) | <0.0001 |
| 10.6 (9.0-12.3) | 28.9 (17.9-58.4) | 16.1 (11.7-20.3) | 6.6 (5.7-8.2) | ||
| D | 37 | 0 (0.0) | 7 (18.9) | 30 (81.1) | 0.028 |
| 2.4 (0.5-4.2) | 5.0 (1.05-NA) | 2.3 (1.5-3.4) | |||
| BCLC B and CTP A | |||||
| 75 | 23 (30.7) | 28 (37.3) | 24 (32.0) | <0.0001 | |
| 27.5 (19.8-40.2) | 89.6 (36.7-NA) | 27.5 (14.9-62.4) | 17.4 (11-28.2) | ||
| BCLC C and CTP A | |||||
| 286 | 62 (21.7) | 115 (40.2) | 109 (38.1) | <0.0001 | |
| 13.3 (11.1-16.4) | 22.6 (15.1-50.6) | 17.4 (12.2-23) | 8.6 (6.6-10.7) | ||
| CLIP score | |||||
| 0 | 102 | 42 (41.2) | 36 (35.3) | 24 (23.5) | 0.001 |
| 36.4 (30.3-50.6) | 92.1 (46.1-NA) | 28.9 (24.7-39.5) | 34.0 (15.0-44.1) | ||
| 1 | 171 | 41 (24.0) | 66 (38.6) | 64 (37.4) | <0.0001 |
| 20.4 (18.4-25.7) | 31.6 (25.9-NA) | 23.5 (19.2-36.5) | 16.3 (13.3-19.6) | ||
| 2 | 211 | 38 (18.0) | 74 (35.1) | 99 (46.9) | 0.006 |
| 16.4 (13.7-19.6) | 22.6 (17.9-NA) | 16.4 (12.1-23.0) | 9.9 (7.4-20.5) | ||
| 3 | 147 | 4 (2.7) | 40 (27.2) | 103 (70.1) | 0.083 |
| 5.9 (5.0-8.1) | 24.8 (4.1-NA) | 7.9 (5.6-12.3) | 5.0 (4.0-7.7) | ||
| 4 | 109 | 1 (1.0) | 19 (17.4) | 89 (81.7) | 0.004 |
| 3.1 (2.3-3.8) | 5.6 (NA-NA) | 8.8 (3.1-NA) | 2.6 (2.0-3.2) | ||
| Viral status | |||||
| HBV | 88 | 13 (14.8) | 23 (26.1) | 52 (59.1) | <0.0001 |
| 7.0 (5.3-12.7) | 31.6 (16.4-NA) | 17.5 (7.7-62.3) | 4.1 (3.2-6.1) | ||
| HCV | 190 | 12 (6.3) | 54 (28.4) | 124 (65.2) | <0.0001 |
| 12.3 (9.5-16.4) | NA (35.4-NA) | 21.9 (12.3-32.3) | 9.5 (7.4-13.2) | ||
| No virus | 377 | 105 (27.8) | 128 (34.0) | 144 (38.2) | <0.0001 |
| 17.4 (15.1-20.5) | 36.7 (25.9-67.3) | 17.4 (14.7-23.4) | 6.2 (5.1-9.8) | ||
| Cirrhosis | |||||
| No | 277 | 83 (30.0) | 89 (32.1) | 105 (37.9) | <0.0001 |
| 17.9 (14.9-22.1) | 46.1 (30.3-107.2) | 15.5 (11.5-23.2) | 9.5 (7.1-13.7) | ||
| Yes | 489 | 51 (10.4) | n = 149 (30.5) | n = 289 (59.1) | <0.0001 |
| 11.5 (9.3-14.3) | 30.3 (21.8-92.1) | 19.7 (16.4-25.6) | 6.3 (5.3-8.2) | ||
Note:
- The table demonstrates how the HepatoScore substratifies patients within subgroups defined by levels of existing prognostic factors and staging systems into heterogeneous groups with good, moderate, and poor prognoses.
- Abbreviation: HCV, hepatitis C virus.

HepatoScore Substratifies Patients Within Existing Prognostic Subgroups
Further partitioning of patients in subgroups defined by existing clinical factors into low, medium, and high HepatoScore subgroups explained a significant amount of remaining interpatient heterogeneity (Table 1, Fig. 3, and Supporting Table S3), with significant survival differences within subgroups defined by metastasis, lymph node involvement, Eastern Cooperative Oncology Group (ECOG) score, vascular invasion, pathology, AFP level, viral status, cirrhosis status, and high IGF-1 level (P < 0.0001 for all variables) as well as for low IGF-1 level (P = 0.017), leading to dramatically improved patient stratification. Notably, 38.9% of patients with an ECOG score of 0 had a high HepatoScore (mOS, 12.7 months [95% CI, 9.4-18.5]), and they had a considerably worse prognosis than did patients with a low HepatoScore but an ECOG score of 1 (mOS, 33.8 months [95% CI, 17.9-92.1]) or 2+ (mOS, 22.6 months [95% CI, 12.7-not available (NA)]). Remarkably, patients with metastatic HCC and a low HepatoScore had significantly better prognoses (mOS, 22.0 months [95% CI, 14.9-46.1]) than did those with nonmetastatic HCC and a high HepatoScore (mOS, 9.4 months [95% CI, 7.5-12.0]). Furthermore, we previously reported the prognostic value of IGF-1 level in patients with HCC patients.(13-15) In the present study, the HepatoScore partitioned patients with a high IGF-1 (>26) into three heterogeneous groups with respective median OS of 50.6 months (95% CI, 31.6-92.1), 19.7 months (95% CI, 16.2-25.1), and 10.6 months (95% CI, 8.6-14.5).
HepatoScore Substantially Refines Patient Outcomes Within Existing Staging Systems
Subdividing the categories within the existing HCC staging system according to low, medium, and high HepatoScore (Table 1, Fig. 3, and Supporting Table S4), we found OS differences within subgroups according to tumor-node-metastasis (TNM) stage, Okuda stage, CTP score, IGF-CTP score, BCLC stage, and CLIP score, with nearly all of the differences highly statistically significant (P < 0.0001) except for the most advanced Okuda stage (3; P = 0.57), CTP score (C; P = 0.225), IGF-CTP score (C; P = NA), BCLC stage (D; P = 0.028), and CLIP score (4+; P = 0.004), for which nearly all patients had high HepatoScore, and others with less dramatic statistical differences (IGF-CTP score B, P = 0.002; BCLC stage 0-A, P = 0.011; CLIP score B, P = 0.006, CLIP score C, P = 0.083). Remarkably, patients with TNM stage 1 HCC with a high HepatoScore (mOS, 23.3 months [95% CI, 15.0-36.4]) had outcomes similar to those of patients with TNM stage 4 HCC with a low HepatoScore (mOS, 22.8 months [95% CI, 16.0-56.6]). Notably, patients with CTP-B HCC with a low (mOS, 107.2 months [95% CI, 21.1-NA]) or medium (mOS, 17.4 months [95% CI, 9.8-25.6]) HepatoScore had considerably better outcomes than did patients with CTP-A HCC with a high HepatoScore (mOS, 9.9 months [95% CI, 7.7-13.7]). Importantly, HepatoScore partitioned patients with BCLC-C disease, the standard group for systemic therapy for HCC, into three heterogeneous subgroups with mOS rates of 28.9 months (95% CI, 17.9-58.4), 16.1 months (95% CI, 11.7-20.3), and 6.6 months (95% CI, 5.7-8.2) for a low, medium, and high HepatoScore, respectively. Also, patients with CTP-A and BCLC-C disease, the classic entry criteria for HCC systemic therapy trials, also had considerable interpatient heterogeneity explained by low, medium, and high HepatoScore, with mOS rates of 22.6 months (95% CI, 15.1-50.6), 17.4 months (95% CI, 12.2-23.0), and 8.6 months (95% CI, 6.6-10.7), respectively. We observed the same for patients with CTP-B and BCLC-C disease, a subgroup chosen for local HCC therapy, with mOS rates of 89.6 months (95% CI, 36.7-NA), 27.5 months (95% CI, 24.9-62.4), and 17.4 months (95% CI, 11.0-28.2), respectively. We previously demonstrated the value of supplementing the CTP score with IGF-1.(15) Of note, the HepatoScore tracked well with the IGF-CTP score, with all patients with low HepatoScore having IGF-CTP-A HCC and all of those with IGF-CTP-C disease having a high HepatoScore, but with HepatoScore clearly providing additional substratification (e.g., identifying subsets of patients with IGF-CTP-A HCC having much worse prognoses than others).
Single-Sample Scoring System Using 14 Proteins Recapitulates Global Effects
The HepatoScore for each patient was obtained by jointly fitting model 1, which is not feasible to do for future patient plasma samples, as required for clinical application. Thus, we built a single-sample random forest algorithm that accurately encapsulates the global signal captured by the HepatoScore using a representative subset of 14 proteins selected using the lariat,(20) called the HepatoScore-14 (details in Supporting Tables S4 and S5). Although computed using just 14 proteins, the HepatoScore-14 captures the same global structure evident in the circulating protein profiles as the HepatoScore based on the entire protein panel (Fig. 1 and Supporting Figs. S1 and S2) and provides commensurate interpatient stratification and prognostic differences (Supporting Tables S6 and S7) that in fact tend to be even more dramatic than those provided by HepatoScore. These 14 proteins (Table 2) encompass numerous HCC-relevant pathways spanning various cancer hallmarks, including apoptosis, angiogenesis, cell migration, proliferation, immune response, and inflammation.(21) The density plots in Supporting Fig. S3 show their distributions in healthy controls and patients with HCC.
| Symbol | Full Protein Name | Importance Score* | Function | Characteristics |
|---|---|---|---|---|
| VCAM1 | Vascular cell adhesion molecule 1 | 1.00 | Inflammation | Up-regulated by TNF-α/IL-1; co-localizes with CD151 in chronic inflammation(22) |
| CATHD | Cathepsin D | 0.96 | Apoptosis | Interferes with lysosome biogenesis,(23) leading to lysosomal membrane destabilization(24) and facilitating invasiveness and metastasis(25) |
| YKL40 | Chitinase-3-like protein 1, CHI3L1 | 0.95 | Inflammation, immune response | Secretes glycoprotein associated with fatty liver disease and fibrosis(26); controlled by STAT3(27) |
| GELSL | Gelsolin | 0.83 | Apoptosis | Key inhibitor of actin filament assembly/disassembly; down-regulated in patients with HBV(28); can inhibit apoptosis by destabilizing mitochondria(29) |
| TIMP1 | Tissue inhibitor of metalloproteinases 1 | 0.76 | Apoptosis | Glycoprotein MMP inhibitor involved in extracellular matrix degradation(30) |
| TNFR2 | Tumor necrosis factor receptor 2, CD120b | 0.68 | Inflammation, Apoptosis | Mediates mitochondrial uncoupling and enhances ROS-dependent cell migration via NF-κB activation in liver cells(31) |
| VEGFR2 | Vascular endothelial growth factor receptor 2 | 0.56 | Angiogenesis | Angiogenesis factor targeted by anti-angiogenesis therapies |
| CgA | Chromogranin A | 0.51 | Inflammation | Increased by proinflammatory cytokines TNF-α and IFN-α |
| CD163 | Cluster of differentiation 163 | 0.49 | Inflammation, immune response, angiogenesis | Marker of alternatively activated M2 macrophages; pivotal role in progression of inflammation-related cancer; promotes angiogenesis, metastasis, and suppression of adaptive immunity, with tumor and macrophage cross-talk partially regulated by the NF-κB, STAT3, and HIF-1 signaling pathways(32) |
| OPG | Osteoprotegerin | 0.47 | Inflammation | TNF family member, up-regulated by alcohol-associated liver cirrhosis(33); target of NF-κB signaling(34) |
| GDF15 | Growth differentiation factor 15 | 0.46 | Apoptosis, inflammation, angiogenesis | TGF-β family member; key role in inflammatory and apoptotic pathways promoting invasion, migration, and angiogenesis in cell lines(35) |
| Factor VII | Blood coagulation factor VII | 0.33 | Vascular invasion | Activates ERK-TSC signaling through PAR2,(36) promoting HCC progression, vascular invasion, cell migration, and metastasis(37) |
| GH | Growth hormone | 0.31 | Proliferation, apoptosis | Activates STAT3(38) via JAK(39) and promotes cancer stem cell–like behavior of HCC through STAT3-dependent inhibition of claudin-1 expression(40) |
| IL2RA | Cluster of differentiation 25, CD25 | 0.16 | Immune response | Increases blunted effector T-cell response(41) |
- * Measure of the selection stability, defined as the proportion of times this protein was selected by the lariat when repeating the entire analytical procedure for 100 random 50%/50% training and test cohort splits.
- Abbreviations: ERK, extracellular signal-regulated kinase; HIF, hypoxia-inducible factor; IFN, interferon; JAK, Janus kinase; MMP, matrix metalloproteinase; NF-κB, nuclear factor kappa B; ROS, reactive oxygen species; STAT3, signal transducer and activator of transcription 3; TGF, transforming growth factor; TNF, tumor necrosis factor; TSC, tuberous sclerosis protein.
HepatoScore-14 Is an Independent Biological Prognostic Factor
HepatoScore-14, although unsupervised with respect to survival and based only on plasma biomarkers, resulted in similar prognostic value (C-index = 0.70 [95% CI, 0.67-0.72]) as CLIP (C-index = 0.70 [95% CI, 0.67-0.73]), BCLC (C-index = 0.62 [95% CI, 0.60-0.64]), or CTP score (C-index = 0.60 [95% CI, 0.57-0.62]). HepatoScore-14 was an independent prognostic factor when included in the same Cox regression model with CLIP (hazard ratio [HR] = 4.62 [95% CI, 3.23-6.62], P < 0.0001), BCLC (HR = 6.07 [95% CI, 4.27-8.63], P < 0.0001), CTP score (HR = 6.46 [95% CI, 4.53-9.21], P < 0.0001), or clinical factors performance status, portal vein thrombosis, tumor morphology, and metastasis (HR = 5.62 [95% CI, 3.90-8.10], P < 0.0001).
Reproducibility of Results
Rigorous cross validation using 100 random training and test patient cohort splits demonstrated that our entire underlying analytical approach applied to the training data reproduced nearly identical highly statistically significant effects, explaining interpatient heterogeneity within each prognostic cohort and staging system in the test splits (Supporting Tables S8 and S9). HepatoScore-14 was highly concordant with proteins measured using ELISA or Myriad RBM (r = 0.84, P < 0.0001; Supporting Fig. S4A), with equivalent prognostic separability (n = 110 samples; using Myriad RBM, mOS is 67.3/29.2/7.4 months [P < 0.0001] for HepatoScore-14 low/medium/high; and using ELISA, mOS is 62.4/33.6/6.8 months [P < 0.0001]; Supporting Fig. S4B).
Discussion
We introduced an analytical strategy for constructing an unsupervised circulating biomarker score, HepatoScore, which can serve as a biological supplement to existing prognostic factors and staging systems that adds independent prognostic information. Applied to an enormous HCC data set, the HepatoScore proved to be strongly predictive of long-term clinical outcome of HCC and provided a significantly refined prognostic stratification of patients that dramatically alters the status quo regarding patient outcome determination for many patients. This suggests a change in patient selection for therapies and clinical trials, and introduces an important stratification factor to ensure balance among treatment arms in randomized clinical trials.
A number of examples illustrate the immediate clinical utility of the HepatoScore. For example, HepatoScore’s ability to significantly substratify ECOG performance status categories is remarkable, given that ECOG has become a main stratification criterion for patients in randomized trials in HCC. Similarly, phase 3 trials of systemic therapy for HCC typically exclude patients with CTP-B score, whereas our results suggest that such patients with a low or medium HepatoScore have better prognoses than do patients with HCC with CTP-A and a high HepatoScore, so they may be considered for such trials. Additionally, standard entry criteria for systemic and local therapy trials for HCC are often restricted to CTP-A and BCLC-C or BCLC-B disease, respectively. The HepatoScore’s remarkable stratification ability suggests that it can be used as a stratification factor in trials and possibly expand standard cohorts to include patients with CTP-B HCC and a low or medium HepatoScore. The HepatoScore also explains a great deal of interpatient heterogeneity remaining within these commonly used prognostic subgroups. Similarly, patients with HCC with macrovascular invasion are often excluded from clinical trials because of a poor prognosis, such as most recently reported for a phase 3 study of lenvatinib versus sorafenib(42) that excluded those with main portal vein invasion. However, based on our results, patients with HCC with macrovascular invasion having a low or medium HepatoScore have better prognoses than some patients without macrovascular invasion, and may be included in such studies.
In the HepatoScore, we introduce to the biomedical literature a deconvolution-based strategy for computing risk scores using circulating biomarkers that challenge the status quo. The typical approach of constructing a supervised signature using a few preselected biological and clinical factors may not be the best one for extracting global information from available big data sets in modern biomedical research. As an alternative, we built a plasma-based aberration score using deconvolution methods that measure the degree of aberration in biomarker profiles in patients with HCC relative to those in healthy controls. Importantly, the global nature of the HepatoScore enables it to capture biological effects from a variety of molecular pathways included in our broad protein biomarker panel, yet can be computed using a small subset of representative markers comprising HepatoScore-14. Although working especially well for HCC given the liver’s extensive cytokine activity, immunogenic environment, and hypervascularity, this strategy also has the potential to work for other cancers and diseases, especially at sites with ready access to the bloodstream and high degrees of cytokine activity. Furthermore, our approach has the potential to be used with biomarkers other than proteins and readily accessible media other than plasma, such as urine, saliva, stool, and nipple aspirate fluid. Future studies will assess these possibilities.
The HepatoScore is unsupervised with respect to clinical outcome. However, it provided outstanding prognostic separability in our large cohort of 767 patients with HCC and explained significant interpatient heterogeneity not captured by existing staging system or prognostic factors. The HepatoScore-14 encapsulates the global signal evident in the HepatoScore using a representative small panel of 14 proteins, and yields even stronger substratification than the full HepatoScore. It can be easily assessed in a single-sample clinical setting, and can be computed using measurements obtained by the Myriad RBM DiscoveryMAP panel or from ELISA. Given that only 110 samples were evaluated on ELISA, further studies to validate HepatoScore-14 using ELISA are warranted. HepatoScore and HepatoScore-14 both accurately substratify patients with HCC with any etiological subgroup, with hepatitis B virus (HBV), hepatitis C virus, or no hepatitis, patients with cirrhosis or without cirrhosis, so it can be used in any cohort of patients with HCC. Although this paper focuses primarily on categorizing patients into low, medium, and high HepatoScore groups, our analyses suggest that the HepatoScore or HepatoScore-14 values, between 0 and 1, can themselves be used as a continuous prognostic factor (see Table 3). Repeated calculation and testing of the HepatoScore-14 in training and test cohorts rigorously demonstrated the reproducibility and stability of these results, strongly validating the scoring system. An affordable panel containing these proteins can lead to rapid incorporation of the HepatoScore-14 in the clinic, which can be used to guide treatment decisions and clinical trial enrollment and stratification for HCC.
| Factor | HR (95% CI) | P Value | C-Index (95% CI) |
|---|---|---|---|
| HepatoScore-14 | 7.69 (5.44, 10.87) | <0.0001 | 0.70 (0.67, 0.72) |
| CLIP | 1.67 (1.57, 1.80) | <0.0001 | 0.70 (0.67, 0.73) |
| BCLC (A, B, C, D vs. 0) | 0.62 (0.60, 0.64) | ||
| A vs. 0 | 2.57 (0.78, 8.54) | 0.1220 | |
| B vs. 0 | 3.54 (1.12, 11.21) | 0.0320 | |
| C vs. 0 | 6.62 (2.12, 20.67) | 0.0010 | |
| D vs. 0 | 21.75 (6.64, 71.30) | <0.0001 | |
| CTP (B, C vs. A) | 0.60 (0.57, 0.62) | ||
| B vs. A | 1.38 (1.15, 1.65) | 0.0004 | |
| C vs. A | 5.05 (3.68, 6.92) | <0.0001 | |
| CLIP + HepatoScore-14 | 0.73 (0.71, 0.76) | ||
| CLIP | 1.51 (1.41, 1.62) | <0.0001 | |
| HepatoScore-14 | 4.62 (3.225, 6.620) | <0.0001 | |
| BCLC + HepatoScore-14 | 0.72 (0.69, 0.74) | ||
| A vs. 0 | 2.09 (0.63, 6.94) | 0.2283 | |
| B vs. 0 | 2.50 (0.79, 7.94) | 0.1197 | |
| C vs. 0 | 4.15 (1.32, 13.00) | 0.0146 | |
| D vs. 0 | 10.38 (3.15, 34.22) | <0.0001 | |
| HepatoScore-14 | 6.07 (4.27, 8.63) | <0.0001 | |
| CTP + HepatoScore-14 | 0.70 (0.67, 0.73) | ||
| B vs. A | 1.06 (0.89, 1.28) | 0.5086 | |
| C vs. A | 2.99 (2.16, 4.13) | <0.0001 | |
| HepatoScore-14 | 6.46 (4.53, 9.21) | <0.0001 | |
| Clinical + HepatoScore-14 | 0.73 (0.71, 0.76) | ||
| Performance status | |||
| PS1 vs. PS0 | 1.22 (1.02, 1.47) | 0.0332 | |
| PS2 vs. PS0 | 2.00 (1.50, 2.68) | <0.0001 | |
| PS34 vs. PS0 | 3.38 (2.17, 5.27) | <0.0001 | |
| Portal vein thrombosis (yes vs. no) | 1.69 (1.40, 2.06) | <0.0001 | |
| Tumor morphology | |||
| Multinodular/≤50% vs. uninodular/≤50% | 1.37 (1.11, 1.69) | 0.0031 | |
| Massive or ext >50% vs. uninodular/≤50% | 2.08 (1.66, 2.62) | <0.0001 | |
| Metastatic (yes vs. no) | 1.80 (1.49, 2.18) | <0.0001 | |
| HepatoScore-14 | 5.62 (3.90, 8.10) | <0.0001 |
The HepatoScore clearly captures a great degree of useful clinical information about a patient’s HCC tumor from the circulating proteome. Although this report focuses on its prognostic value, the HepatoScore may also provide information useful for determination of precision therapy or adaptive therapeutic regimens. If the HepatoScore tends to decrease when a patient’s disease begins to respond to therapy or increase when disease begins to progress, it may be used as a longitudinal marker of therapeutic benefit that is part of an adaptive therapeutic regimen. Serial samples must be evaluated to assess this possibility. In addition, for each patient with a high HepatoScore, a set of influence scores indicating which HepatoScore-based molecular pathways appear to be driving poor prognosis can be computed and may have value for choosing patients for precision therapeutics targeting these pathways. This possibility will be assessed in future work.
Author Contributions
J.S.M. was responsible for the study concept. J.S.M., M.M.H., H.M.A., A.O.K., D.L., and K.L.B. were responsible for the study design. M.M.H. and A.O.K. were responsible for the data collection. H.M.A., M.M.H., A.H., and K.L.B. were responsible for the laboratory measurements. J.S.M., Y.E.Z., Z.W., G.A., M.W., and W.W. were responsible for the methodological development. J.S.M., Y.E.Z., Z.W., L.X., and L.L. were responsible for the data analysis. A.O.K., J.S.M., M.M.H., H.M.A., A.R., A.H., Y.A.H., R.A. Wolff, R.A. Wahab, B.G., K.R., J.Y., and H.M.A. were responsible for the data interpretation. J.S.M., A.O.K., M.M.H., H.M.A., and Y.E.Z. were responsible for drafting the manuscript.