The Polyploid State Restricts Hepatocyte Proliferation and Liver Regeneration in Mice
Potential conflict of interest: Nothing to report.
Abstract
The liver contains a mixture of hepatocytes with diploid or polyploid (tetraploid, octaploid, etc.) nuclear content. Polyploid hepatocytes are commonly found in adult mammals, representing ~90% of the entire hepatic pool in rodents. The cellular and molecular mechanisms that regulate polyploidization have been well characterized; however, it is unclear whether diploid and polyploid hepatocytes function similarly in multiple contexts. Answering this question has been challenging because proliferating hepatocytes can increase or decrease ploidy, and animal models with healthy diploid-only livers have not been available. Mice lacking E2f7 and E2f8 in the liver (liver-specific E2f7/E2f8 knockout; LKO) were recently reported to have a polyploidization defect, but were otherwise healthy. Herein, livers from LKO mice were rigorously characterized, demonstrating a 20-fold increase in diploid hepatocytes and maintenance of the diploid state even after extensive proliferation. Livers from LKO mice maintained normal function, but became highly tumorigenic when challenged with tumor-promoting stimuli, suggesting that tumors in LKO mice were driven, at least in part, by diploid hepatocytes capable of rapid proliferation. Indeed, hepatocytes from LKO mice proliferate faster and out-compete control hepatocytes, especially in competitive repopulation studies. In addition, diploid or polyploid hepatocytes from wild-type (WT) mice were examined to eliminate potentially confounding effects associated with E2f7/E2f8 deficiency. WT diploid cells also showed a proliferative advantage, entering and progressing through the cell cycle faster than polyploid cells, both in vitro and during liver regeneration (LR). Diploid and polyploid hepatocytes responded similarly to hepatic mitogens, indicating that proliferation kinetics are unrelated to differential response to growth stimuli. Conclusion: Diploid hepatocytes proliferate faster than polyploids, suggesting that the polyploid state functions as a growth suppressor to restrict proliferation by the majority of hepatocytes.
Abbreviations
-
- 2c, 4c, 8c
-
- chromatid number for diploid, tetraploid, octaploid hepatocytes, respectively
-
- 2n, 4n, 8n
-
- chromosome number for diploid, tetraploid, octaploid hepatocytes, respectively
-
- ALT
-
- alanine aminotransferase
-
- AST
-
- aspartate aminotransferase
-
- β-gal
-
- β-galactosidase
-
- BrdU
-
- 5-bromo-2’-deoxyuridine
-
- DEN
-
- diethylnitrosamine
-
- EGF
-
- epidermal growth factor
-
- FACS
-
- fluorescence-activated cell sorting
-
- Fah
-
- fumarylacetoacetate hydrolase
-
- FGF
-
- fibroblast growth factor
-
- FRGN
-
- Fah–/– Rag2–/– Interleukin 2 common Gamma chain–/– Nod background
-
- GS
-
- glutamine synthetase
-
- H&E
-
- hematoxylin and eosin
-
- HFD
-
- high-fat diet
-
- HGF
-
- hepatocyte growth factor
-
- LKO
-
- liver-specific E2f7/E2f8 knockout
-
- LOH
-
- loss of heterozygosity
-
- LR
-
- liver regeneration
-
- LW/BW
-
- liver weight/body weight
-
- NTBC
-
- 2-(2-nitro-4-trifluoro- methylbenzoyl)-1,3-cyclo-hexanedione
-
- PB
-
- phenobarbital
-
- PCNA
-
- proliferating cell nuclear antigen
-
- PDGF
-
- platelet-derived growth factor
-
- PH
-
- partial hepatectomy
-
- PHH3
-
- phospho-histone H3
-
- TGFα
-
- transforming growth factor alpha
-
- WT
-
- wild-type
Most mammalian somatic cells are diploid and contain pairs of each chromosome, but there are also polyploid cells, such as skeletal muscle, megakaryocytes, trophoblast giant cells, cardiac myocytes, and hepatocytes, that contain additional sets of chromosomes.1-3 Polyploid hepatocytes are among the best described, and in adult humans and mice, polyploids comprise more than 50% and 90%, respectively, of the hepatocyte population.4, 5 Polyploidization begins at day 14 in mice, when proliferating hepatocytes fail to complete cytokinesis and produce binucleate tetraploid daughter cells containing two diploid nuclei.6-8 In turn, these binucleate tetraploid hepatocytes begin cycling and, upon successful cytokinesis, generate a pair of mononucleate tetraploid daughters. This process continues, generating octaploid and even higher ploidy hepatocytes. The polyploid state is also reversible. Proliferating polyploid hepatocytes can undergo multipolar cell division to generate diploid or near-diploid daughters, a process termed the ploidy conveyor.5 Thus, the adult liver contains a heterogeneous mixture of diploid and polyploid hepatocytes, but it is unknown whether these different hepatic subsets perform specialized functions in normal homeostasis or liver regeneration (LR).
The E2F family of transcription factors regulates progression through the cell cycle.9 In the liver, E2F1-6 are expressed at low levels throughout life, whereas E2F7 and E2F8 are elevated between weeks 1 and 7 of postnatal development, a period correlating with hepatocyte polyploidization.10 The role of E2F7 and E2F8 was studied using liver-specific E2f7/E2f8 double-knockout (LKO) mice.10, 11 Livers in these mice were reported to function normally through several months of age, but they were significantly depleted of polyploid hepatocytes. Similar, albeit less pronounced, phenotypes were observed in E2f7 and E2f8 single-knockout mice. E2F7 and E2F8 regulate hepatic ploidy in two primary ways.10 First, E2F7 and E2F8 antagonize E2F1 activity, and, consistent with this relationship, transgenic mice overexpressing E2F1 were enriched for diploid hepatocytes, which is similar to the phenotype of E2f7/E2f8 double-knockout mice.12 Second, E2F7 and E2F8 negatively regulate genes involved in cytokinesis. Because cytokinesis failure is the primary method hepatocytes become polyploid,7 loss of E2F7 and E2F8 promotes successful cytokinesis of proliferating mononucleate diploid cells.
Here, we utilized LKO mice to investigate functional differences between diploid and polyploid hepatocytes. Similar to published reports, LKOs contained ~20 times more diploids and 3 times fewer polyploids. The reduced-polyploidy phenotype was stable at 2.5 and 5 months of age and following extensive hepatocyte proliferation. When adults were treated with a tumor induction/promotion model, LKO mice developed abundant liver tumors whereas control mice were resistant to tumorigenesis. We speculated that tumors in LKO mice were driven, at least in part, by diploid hepatocytes capable of rapid proliferation. Using in vivo and in vitro approaches, we showed that hepatocytes from LKO livers proliferated faster and could out-compete hepatocytes from control livers, especially in competitive repopulation. We also compared diploid and polyploid hepatocytes from WT mice. Cell culture and LR assays showed that diploids entered and completed the cell cycle earlier than polyploids. Diploid and polyploid hepatocytes responded to hepatic mitogens similarly, indicating that proliferation kinetics were unrelated to differential response to growth stimuli. Together, the data indicate that diploid hepatocytes proliferate faster than polyploids, suggesting that the polyploid state functions as a growth suppressor to restrict proliferation by the majority of hepatocytes.
Materials and Methods
Mouse Strains
The Institutional Care and Use Committee of the University of Pittsburgh (Pittsburgh, PA) approved all mouse experiments. Mice were maintained in a standard 12-hour light/dark system. They were housed in Optimice cages (AnimalCare Systems, Centennial, CO) with Sani-Chip Coarse bedding (P. J. Murphy, Montville, NJ) and provided ad libitum access to water and standard mouse chow (Purina ISO Pro Rodent 3000; LabDiet, St. Louis, MO). Mice were provided huts and running wheels for enrichment. All animals were sacrificed between 9:00 am and 12:00 pm daily. LKO mice were a kind gift from Alain deBruin and Gustavo Leone.10, 11 LKO mice, which were a mixed background but predominantly FVB, contained floxed E2f7 and E2f8 alleles, a Rosa26-lacZ reporter (R26R-lacZ), and Cre recombinase driven by the albumin promoter (Alb-Cre): E2f7loxP/loxP E2f8loxP/loxP R26RlacZ/lacZ Alb-CreTg/0. Control mice were negative for Alb-Cre: E2f7loxP/loxP E2f8loxP/loxP R26RlacZ/lacZ. FRGN mice (Fah–/– Rag2–/– Interleukin 2 common Gamma chain–/– Nod background) were used for liver repopulation studies (Yecuris, Inc., Tualatin, OR).13, 14 FRGN mice were maintained on 8 mg/L of 2-(2-nitro-4-trifluoro- methylbenzoyl)-1,3-cyclo-hexanedione (NTBC) in their drinking water (Ark Pharm, Libertyville, IL). Wild-type (WT) C57BL/6 mice were from Jackson Labs (Bar Harbor, ME). Unless noted, male mice were used for experiments.
Hepatocyte Isolation
Primary hepatocytes were isolated using a two-step collagenase perfusion.15 Briefly, following general anesthesia induction, a catheter was inserted into the portal vein or inferior vena cava, and 0.3 mg/mL of collagenase II (Worthington, Lakewood, NJ) was circulated through the liver. Digested livers were placed in Dulbecco’s modified Eagle’s medium/F12 with 15 mM of HEPES (Corning, Corning, NY) + 5% fetal bovine serum (FBS; Sigma-Aldrich, St. Louis, MO), passed through a 70-μm cell strainer and washed twice using low-speed centrifugation (55g for 2 minutes) to remove nonparenchymal cells. Hepatocyte viability, determined by trypan blue staining, was typically >80%. Hepatocytes from FRGN transplantation recipients were isolated as described above, except the collagenase II concentration was increased to 1 mg/mL.
Statistical Analysis
Statistical significance was calculated with Graph Pad Prism and Microsoft Excel using 2-tailed Student’s t test unless otherwise noted. P values <0.05 were considered significant. For additional methods, please refer to the Supporting Information.
Results
Liver-Specific Deletion of E2f7 and E2f8 Blocks Hepatic Polyploidy
To validate the effects of E2f7 and E2f8 deficiency in the liver, we obtained mice with floxed E2f7 and E2f8 alleles and a Rosa26-lacZ reporter (R26R-lacZ) that were crossed with Cre recombinase driven by the Albumin promoter (Alb-Cre) to specifically delete these genes in the liver.10, 11 LKO and control mice were compared. Taking advantage of R26R-lacZ, control hepatocytes lacking Alb-Cre did not express β-galactosidase (β-gal), as expected, whereas hepatocytes from LKO mice were β-gal+ (Fig. 1A). Consistent with the literature, liver weight to body weight (LW/BW) ratio (Fig. 1B), circulating liver enzymes (Supporting Fig. S1A), and hepatic zonation (Supporting Fig. S1B,C) were comparable.10, 11 Additionally, gene signatures were equivalent between LKO and control mice at 3 and 16 weeks of age (e.g., gene ontology categories, cell cycle, metabolism, proliferation, and differentiation) and in livers depleted of E2f8 alone (e.g., differentiation genes such as Albumin, forkhead box protein 3, and hepatocyte nuclear factor 4 alpha; cytochrome P450 family members; and cell-cycle genes).10, 16 To assess liver function following chronic injury, we maintained mice on a high-fat diet for 8 weeks. LKO and control mice had equivalent alanine aminotransferase (ALT) levels and proportional increases in body weight and LW/BW (Supporting Fig. S2A-C). Gross liver morphology and accumulation of neutral lipids were the same (Supporting Fig. S2D,E). Thus, together with the observation by Pandit et al. that LKO and control mice respond equivalently to the 3,5-diethoxycarbonyl-1,4-dihydrocollidine diet,10 E2f7/E2f8-deficient mice appeared to be functionally normal.
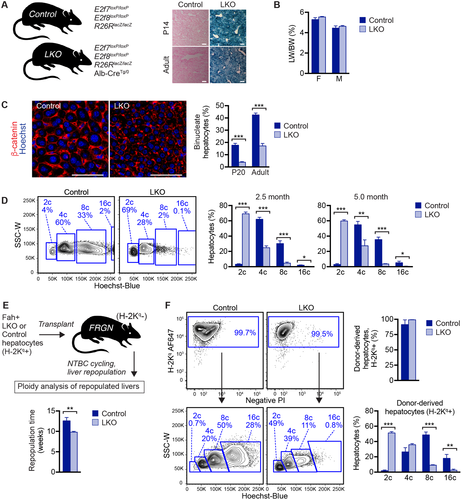
The most striking effect associated with loss of E2f7/E2f8 is altered hepatic ploidy. Binucleate hepatocytes were reduced 3- to 4-fold in LKO livers as early as day 20 and into adulthood (Fig. 1C), and they were distributed evenly between all zones in the liver, similar to controls (Supporting Fig. S1B-D). We determined cellular ploidy by quantifying nuclear content using flow cytometry. In control adult livers, diploid cells comprised only 3%-4% of hepatocytes, and polyploids comprised the rest (Fig. 1D and Supporting Fig. S3A). The ploidy spectrum was dramatically altered in LKO livers, with diploids representing 60%-70% of hepatocytes. This observed 20-fold enrichment of diploid hepatocytes in LKO livers was observed in 2.5- and 5-month-old livers.
We previously showed that diploid hepatocytes can polyploidize during therapeutic liver repopulation.5 We therefore wondered whether the LKO ploidy phenotype was stable during extensive proliferation. To test this, we utilized the fumarylacetoacetate hydrolase (Fah) liver repopulation model (Fig. 1E).15 Mice lacking Fah develop liver failure, but are kept alive and healthy by supplementing NTBC in the drinking water. Fah+ donor hepatocytes are transplanted into Fah–/– mice and NTBC is removed. In this environment, donor hepatocytes have a proliferative advantage, and cells proliferate 500- to 1,000-fold to replace host hepatocytes. To prevent immune rejection of transplanted hepatocytes, which were a mixed background, we used immune deficient Fah–/– mice (termed FRGN for Fah–/– Rag2–/– Interleukin 2 common Gamma chain–/– Nod background).13, 14 FRGN mice transplanted with adult LKO or control hepatocytes were completely repopulated (>99%), as observed by expression of the donor marker, H-2Kq (Fig. 1F and Supporting Fig. S3B). Moreover, we noticed that LKO-transplanted recipients repopulated 25% faster than control-transplanted mice (Fig. 1E). After complete liver repopulation, control hepatocytes were >99% polyploid, and LKO hepatocytes remained predominantly diploid, indicating that the LKO ploidy phenotype is stable even after extensive in vivo proliferation (Fig. 1F). Together, the data show that LKO mice serve as a stable hepatic polyploidy knockout model.
Diethylnitrosamine-Induced Liver Tumors Expand Rapidly in LKO Mice
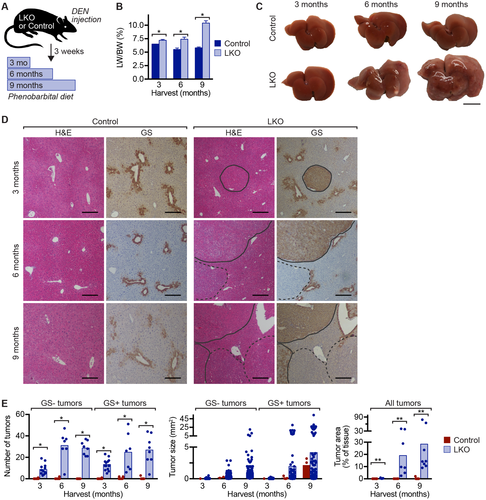
Polyploidy is a hallmark of cancer that has been shown to promote genomic instability and dysregulated gene expression, frequently leading to cellular transformation and tumorigenesis.17, 18 Intriguingly, in the liver, polyploidy has been suggested to protect against tumorigenesis.16, 19 Because LKO mice function normally and are predominantly diploid, these mice provided an opportunity to assess the role of polyploidy in hepatocellular carcinogenesis. Six-week-old LKO or control mice were injected with a single dose of diethylnitrosamine (DEN) to initiate tumor formation, and 3 weeks later mice were placed on a phenobarbital (PB) diet to promote tumor expansion (Fig. 2A).20-23 Genes involved in DEN metabolism (cytochrome P450, family 2, subfamily b, polypeptide 10) and PB-induced proliferation (constitutive androstane receptor and cytochrome P450 family 2 subfamily e member 1) were expressed at similar levels, indicating that response to DEN/PB is not attributed to E2f7/E2f8 deficiency (Supporting Fig. S4A,B).24-26 Aspartate aminotransferase (AST), ALT, and bilirubin levels were similar in both groups, although ALT was increased 2- to 3-fold in LKO mice after 9 months (Supporting Fig. S4C). LW/BW was consistently higher in LKO mice (Fig. 2B). Macroscopically, tumors were not observed in control livers after 3, 6, or 9 months (Fig. 2C). In LKO livers, tumors were undetected after 3 months, discrete tumors were visible after 6 months, and, by 9 months, livers were dramatically enlarged and filled with tumors. Liver tumors in the DEN/PB model typically contain activating β-catenin mutations, so we stained liver sections with hematoxylin and eosin (H&E) for general histology and glutamine synthetase (GS), a β-catenin target that serves as a surrogate marker for activated β-catenin (Fig. 2D).21, 27, 28 LKO mice were highly enriched with GS– and GS+ liver tumors. Tumor number, size, and area increased with time in LKO mice (Fig. 2E). Together, these data are consistent with other reports16, 29 and show that LKO mice are highly susceptible to DEN/PB-mediated tumorigenesis, suggesting that the hepatic polyploid state protects the liver from tumor formation.
Adult LKO Hepatocytes Transit Through the Cell Cycle Rapidly IN VITRO
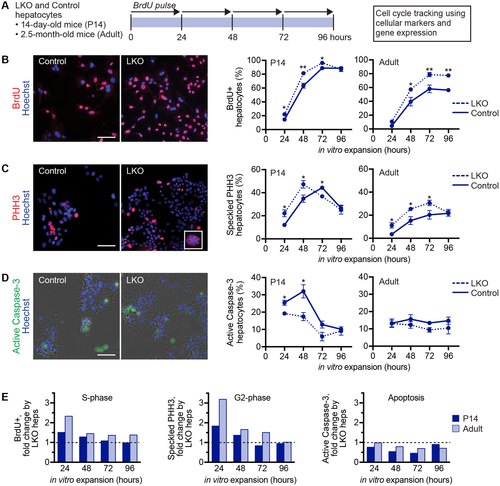
We observed that transplanted LKO hepatocytes repopulated FRGN livers 25% faster than control hepatocytes (Fig. 1E). Therefore, because LKO hepatocytes are predominantly diploid, we hypothesized that diploid hepatocytes are more proliferative than polyploids, which drives tumor formation in DEN/PB-treated LKO mice. To test this idea, we compared proliferation of LKO and control hepatocytes in vitro. Freshly isolated hepatocytes were seeded in cell-culture dishes, and cells and nuclei in S phase (5-bromo-2’-deoxyuridine [BrdU] incorporation), G2 phase (speckled phospho-histone H3 staining [PHH3]), and undergoing apoptosis were tracked (Fig. 3A). First, we measured cell-cycle progression using hepatocytes from 14-day-old mice where LKO and controls are equivalent in terms of ploidy (96% diploid) and cell-cycle status (83% quiescent; Supporting Fig. S5). Therefore, any variations in proliferation in vitro are unrelated to ploidy states or basal proliferation rates. Compared to controls, the percentage of LKO hepatocytes in S phase was increased at all time points (Fig. 3B and Supporting Fig. S6A). LKO hepatocytes in G2 phase were modestly elevated at 24-48 hours, reduced at 72 hours, and equivalent at 96 hours (Fig. 3C and Supporting Fig. S6B). There were slightly fewer LKO apoptotic hepatocytes throughout the culture period (Fig. 3D). Next, we tracked proliferation in 2.5-month-old adult hepatocytes. The percentage of LKO hepatocytes in S phase (48-96 hours) and G2 phase (24-72 hours) was elevated throughout the culture period, whereas cell death was nearly equivalent (Fig. 3B-D and Supporting Fig. S6A,B). Consistent with the cellular markers of proliferation, cyclin genes, including cyclin d1, cyclin e1, cyclin a2, and cyclin b1, which are enriched at defined cell-cycle stages, were also up-regulated by proliferating LKO hepatocytes (Supporting Fig. S6C). To compare LKO proliferation kinetics between 14-day-old and adult hepatocytes, we normalized LKO values in each phase of the cell cycle to control values (Fig. 3E). The data indicate that cell cycling is modestly increased in 14-day-old LKO hepatocytes, whereas hepatocytes in S and G2 phases in LKO adults are elevated consistently and to a greater extent. Because 14-day-old hepatocytes are inherently more proliferative than adult hepatocytes, we cannot exclude the possibility that genotype-specific differences are masked at young ages. Nonetheless, the data suggest that nonploidy differences contribute minimally to altered cell-cycle kinetics by LKO hepatocytes, and hepatic ploidy differences play a dominant role.
LKO Hepatocytes Proliferate Faster Than Controls In Vivo
Because LKO hepatocytes progressed through the cell cycle faster than controls in vitro, we next characterized hepatocyte proliferation in vivo. First, we compared proliferation during postnatal liver development. LKO and control livers were harvested at 15-75 days of age and stained for Ki-67, a marker of G1/S/G2/M phases of the cell cycle. The percentage of Ki-67+ hepatocytes was equivalent at all ages (Fig. 4A). Next, we compared proliferation during liver regeneration in response to two-thirds partial hepatectomy (PH). In this classic procedure, two thirds of the liver mass is surgically removed and the remaining liver tissue undergoes a wave of proliferation to restore liver mass.30-32 LW/BW recovery and percentage of Ki-67+ (G1/S/G2/M), proliferating cell nuclear antigen (PCNA)+ (S phase), and bright PHH3+ (M phase) hepatocytes were nearly equivalent at all time points (Fig. 4B,C). Although we cannot exclude the possibility that LKO hepatocytes entered the cell cycle earlier than controls between 0 and 48 hours, there was a trend toward increased Ki-67+ and PCNA+ hepatocytes in LKO livers at later time points, particularly at 72 hours (Fig. 4C).
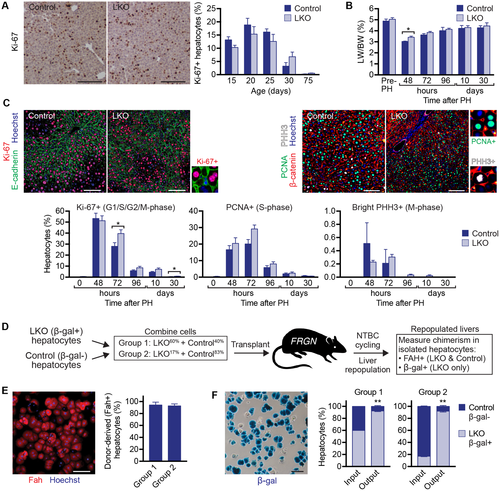
In contrast to relatively mild proliferative programs during postnatal liver development and PH (where each hepatocyte divides one to two times to restore liver mass), we compared hepatocyte proliferation using the Fah liver repopulation model where transplanted donor hepatocytes undergo 9-10 population doublings. We mixed LKO and control hepatocytes in ~equal ratios (group 1, LKO60% and control40%) and transplanted mixtures of donor cells into FRGN recipients. Upon completed repopulation, we isolated hepatocytes and determined degree of chimerism (Fig. 4D). More than 90% of hepatocytes were Fah+, indicating high-level repopulation (Fig. 4E). Because LKO hepatocytes express the β-gal reporter, we then quantified β-gal+ (LKO) and β-gal– (control) cells. The majority of cells were β-gal+ (93%), representing 1.5-fold expansion by LKO hepatocytes during liver repopulation (Fig. 4F and Supporting Fig. S7A). We also performed competitive transplants with the donor mixture skewed toward control hepatocytes (group 2, LKO17% and control83%; Fig. 4D). After repopulation, Fah+ donor hepatocytes comprised >90% of livers (Fig. 4E) and 92% of hepatocytes were β-gal+, representing 5.4-fold expansion by LKO hepatocytes during liver repopulation (Fig. 4F and Supporting Fig. S7B).
To reconcile the observed cell proliferation differences between LKO and control hepatocytes during LR and competitive repopulation assays, we performed a modeling analysis. We compared the impact of cell size and proliferation rate on liver volume production, considering rapid proliferation by relatively small LKO hepatocytes and slower proliferation by relatively large control hepatocytes. Slower-cycling, large control hepatocytes contributed greater cell volume after one or two cell divisions (Supporting Fig. S8); but after three cell divisions, faster-cycling, small LKO cells generated increased cumulative volume with each successive division. Taken together, the data indicate that LKO hepatocytes are more proliferative than control hepatocytes, especially when induced to divide extensively.
WT Diploid Hepatocytes Enter the Cell Cycle Earlier than Polyploids During LR
We next hypothesized that the polyploid state reduces proliferative potential, which enables diploid hepatocytes to proliferate quicker than polyploids. To test this idea, we compared proliferation by WT diploid and polyploid hepatocytes. Specifically, we performed PH on 2.5-month-old C57BL/6J WT mice, harvested hepatocytes during LR and assessed proliferation and ploidy by flow cytometry (Fig. 5A). As expected, hepatocytes were nearly completely quiescent 0-24 hours post-PH, but by 36 hours, ~60% of hepatocytes were Ki-67+, indicating cell-cycle entry (Fig. 5B and Supporting Fig. S9A). The number of cycling hepatocytes remained high 48 hours after PH (~50%) and decreased by 72-96 hours. Twenty-eight days after PH, most hepatocytes returned to quiescence. Overall distribution of hepatic ploidy subsets was equivalent before (0 hours) and after (28 days) LR (Fig. 5C).
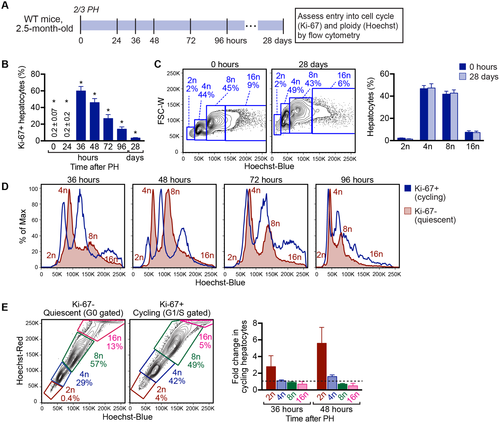
To determine the contribution of each ploidy subset during regeneration, we compared ploidy in quiescent and cycling cells. During early-stage regeneration (36-48 hours), ploidy subsets of cycling hepatocytes (Ki-67+) were right-shifted relative to quiescent cells (Ki-67–) in terms of Hoechst intensity (Fig. 5D and Supporting Fig. S9B). This increase in nuclear content by each cycling ploidy population indicates transition to S phase and active DNA replication. In contrast, by late-stage regeneration (72-96 hours), ploidy profiles of cycling hepatocytes were more diffuse, consistent with cells in G1/S/G2/M phases, making it challenging to identify cycling populations with the same DNA content (e.g., cells with 4c DNA content could be diploids in G2 or tetraploids in G0/G1). We focused on early-stage regeneration, where we could accurately identify all the ploidy populations. Qualitatively, at 36-48 hours, the quiescent subpopulation contained few diploids and was enriched with tetraploid and octaploid hepatocytes. Ploidy distribution shifted markedly in the cycling subpopulation, where there were more cycling diploids than quiescent diploids and fewer cycling octaploids than quiescent octaploids (Fig. 5D). We also quantified the percentage of hepatocytes within the quiescent and cycling subpopulations (Fig. 5E). At 36 hours, cycling diploid hepatocytes were increased 3-fold whereas cycling tetraploids, octaploids, and hexadecaploids were unchanged or reduced. The trend was even more pronounced at 48 hours, with a 6-fold increase in cycling diploids and ploidy-dependent reduction in cycling cells. Although all hepatocytes proliferate in response to two-thirds PH,33 the data show that entry into the cell cycle is inversely proportional to hepatocyte ploidy. Thus, in response to regenerative stimuli, diploid hepatocytes enter the cell cycle quicker than polyploid hepatocytes.
WT Diploid Hepatocytes Proliferate Faster than Polyploids In Vitro, and Ploidy Subsets Respond to Mitogenic Signals Equivalently
LR is regulated by numerous signals that affect initiation, progression, and termination of hepatocyte proliferation.34 To confirm our previous findings that diploid hepatocytes enter the cell cycle earlier than polyploids during LR, we compared proliferation by diploid and polyploid hepatocytes using a simplified culture model. We used hepatocytes from 20-day-old WT mice because, in contrast to adults, most mononucleate hepatocytes at this age are diploid, and nearly all binucleate hepatocytes are tetraploid (Supporting Fig. S10A-C). Thus, we quantified mono- and binucleate hepatocytes as a readout for diploid and tetraploid hepatocytes, respectively. Freshly isolated hepatocytes were cultured for 12-72 hours, and cells in S phase, G2 phase, and undergoing apoptosis were tracked (Fig. 6A and Supporting Fig. S10D). Binucleate hepatocytes started incorporating BrdU at 24-48 hours, and the percentage of BrdU+ cells slowly increased through 72 hours (Fig. 6B). In contrast, mononucleate hepatocytes entered S phase earlier. Mononucleates incorporated BrdU by 12 hours, and the percentage of BrdU+ cells increased sharply at 24-48 hours and plateaued around 72 hours. In addition to entering S phase earlier, the number of BrdU+ cells was consistently higher in the mononucleate subset, although the magnitude decreased with time. A similar trend was noted with cells in G2 phase, and the degree of apoptosis was similar for mono- and binucleate cells (Fig. 6C,D). Together with the in vivo findings, the data indicate that whereas all ploidy subsets are proliferative, diploid hepatocytes enter and transit the cell cycle faster than polyploids.
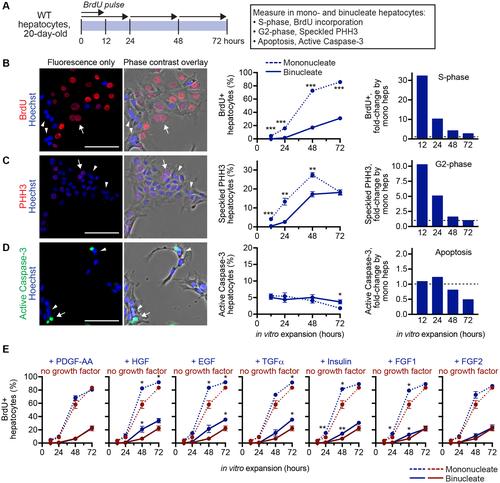
Finally, we wanted to understand the mechanism by which diploid hepatocytes enter the cell cycle and proliferate faster than polyploid hepatocytes. Recently, Kreutz et al. showed that diploid hepatocytes bound insulin with greater affinity than polyploids, suggesting that hepatic ploidy subsets could respond to insulin stimulation in different ways.35 Therefore, we hypothesized that differential growth factor binding by diploid and polyploid hepatocytes could regulate hepatocyte proliferation in a ploidy-specific manner. To test this idea, we stimulated primary hepatocytes with growth factors in serum-free media and compared BrdU incorporation by mono- and binucleate hepatocytes (Fig. 6A). We focused on growth factors that have been implicated in LR, including primary mitogens (hepatocyte growth factor [HGF], epidermal growth factor [EGF], and transforming growth factor alpha [TGFα]) and auxiliary mitogens (insulin, fibroblast growth factor [FGF]1, and FGF2).34, 36 In the absence of exogenous growth factors, hepatocytes from 20-day-old WT mice were highly proliferative. Mononucleate hepatocytes entered S phase 12-24 hours earlier than binucleates, and the percentage of BrdU+ cells was consistently higher (Fig. 6E). As a negative control, we stimulated with platelet-derived growth factor (PDGF), which is produced by hepatocytes during LR but acts on stellate cells, and found that S-phase kinetics for mono- and binucleates were equivalent to controls.34 When we treated hepatocytes with mitogens, the number of BrdU+ cells trended upward throughout the culture period (e.g., compare BrdU incorporation for control and growth factor treatment). However, growth factor stimulation induced proliferation by mono- and binucleate hepatocytes to a similar degree, indicating that neither mono- nor binucleate hepatocytes responded preferentially (although we cannot exclude the possibility of subtle ploidy-specific effects). Thus, the data indicate the rapid proliferation by diploid hepatocytes is not caused by differential sensitivity to the growth stimuli tested here.
Discussion
The ability to study diploid and polyploid hepatocyte function in vivo is challenging. One reason is that the ploidy state of a hepatocyte can change during proliferation.5 Another reason is that, until recently, there have not been any loss-of-polyploidy genetic models that exhibit normal liver function. In 2012, Pandit et al. and Chen et al. described mice with liver-specific deletion of E2f7 and E2f8 and found that the mice were depleted of polyploid hepatocytes.10, 11 We used LKOs to further study the effects of polyploidy deficiency. Consistent with previous findings, LKO mice were functionally equivalent to controls. Most strikingly, diploid hepatocytes were increased 20-fold and LKO hepatocytes remained predominantly diploid even after 500- to 1,000-fold expansion. Thus, LKO mice represent a stable “polyploidy knockout” model for testing the consequences of loss of polyploidy in vivo.
Herein, we compared proliferation by diploid and polyploid hepatocytes. In response to mild proliferative cues during liver postnatal development, LKO and control livers had equivalent numbers of proliferating cells. But, in response to stronger proliferative cues, diploid hepatocytes proliferated faster. This was first observed during LR induced by two-thirds PH, where there was a modest increase in proliferating LKO hepatocytes 3 days post-PH and upon completion of LR. The effect was most pronounced during competitive repopulation when LKO hepatocytes outperformed controls. We also compared proliferation by diploid and polyploid hepatocytes from WT mice in vitro and in vivo. In the early stages of LR induced by two-thirds PH, diploid hepatocytes started proliferating sooner than polyploids. Additionally, among polyploid hepatocytes, tetraploids entered the cell cycle faster than octaploids, and octaploids began cycling earlier than hexadecaploids, suggesting that cell-cycle entry is inversely proportional to ploidy. Collectively, the data demonstrate that diploid hepatocytes enter the cell cycle earlier and progress through the cell cycle faster than polyploids. Considering that diploid hepatocytes are the minority, representing ≤10% of all hepatocytes in mice,5 it remains to be determined which ploidy population contributes the most during a regenerative response.
At first glance, our current findings appear to conflict with earlier work, where we compared repopulation by diploid and octaploid hepatocytes using competitive repopulation.5 In our earlier work, genetically marked WT diploid and octaploid hepatocytes were isolated by fluorescence-activated cell sorting (FACS) and co-transplanted in defined ratios into Fah–/– mice. After repopulation, the ratio of diploid- and octaploid-derived hepatocytes was equivalent to the ratio that was originally transplanted, indicating equivalent repopulation potential by each group. However, these results were difficult to interpret because the ploidy status of donor cells changed during liver repopulation—diploid hepatocytes became polyploid and octaploid hepatocytes became tetraploid and diploid. We believe the current work provides a more-accurate description of ploidy-dependent hepatocyte proliferation by focusing specifically on diploids and polyploids. Here, we show that in response to proliferative cues, diploid hepatocytes enter the cell cycle earlier and progress through the cell cycle faster than polyploids. Taken together, we suggest that, at the level of individual cells (or even during clonal expansion), diploid hepatocytes cycle faster than polyploids. However, during extensive proliferation where diploid and polyploid hepatocytes generate mixed-ploidy daughters, these heterogeneous populations have equivalent proliferative capacity.
The molecular mechanisms by which diploid hepatocytes proliferate faster than polyploids are poorly understood. In 2007, Lu et al. compared gene expression between quiescent diploid and tetraploid hepatocytes from mice.37 Surprisingly, very few genes were differentially expressed, and the magnitude of change was small, suggesting that hepatic ploidy subsets are similar at the RNA level. Recently, it was reported that diploid hepatocytes bind insulin more effectively than polyploids, so we tested whether diploid and polyploid hepatocytes could have different responses to hepatic mitogens.35 We stimulated primary WT hepatocytes in vitro with growth factors associated with LR. Each growth factor induced hepatic proliferation, but the response by diploid and polyploid hepatocytes was equivalent, indicating that diploid hepatocytes are not hypersensitive to mitogenic stimulation. New work is necessary to determine how diploid hepatocytes proliferate faster than polyploids. We speculate that cell-cycle regulation may be subtly different in diploids than polyploids (e.g., earlier replication licensing, shorter S phase), which dramatically changes proliferation potential, especially over successive rounds of cell division. Additional mechanistic insights will come from understanding ploidy-specific proliferation in response to different forms of liver injury and by characterizing the liver microenvironment in this process.
In addition to comparing proliferation between diploid and polyploid hepatocytes in cell culture and during LR and liver repopulation, we also examined oncogenic proliferation. LKO livers developed numerous tumors of various sizes, whereas control mice were relatively tumor free. These results are consistent with a report by Kent et al., where LKO mice spontaneously developed liver tumors during aging and developed more tumors than controls in the DEN tumor induction model.29 A number of mechanisms could explain the sensitivity of LKO mice to liver tumorigenesis. First, the E2F family of transcription factors regulate cell-cycle progression, and dysregulated expression could promote oncogenic expansion. E2F8 (deleted in LKO) has been suggested to function as a tumor suppressor, and E2F1 (up-regulated in LKO) has been implicated as both a tumor suppressor and oncogene.29, 38 Second, the increased tumorigenesis in LKO mice is consistent with our finding that diploid hepatocytes proliferate faster than polyploids. LKO mice are enriched with the most proliferative cells (diploids), and, upon tumor initiation, the large numbers of rapidly cycling diploid hepatocytes in LKO mice drive tumorigenesis. A third mechanism was recently described by Zhang et al., where they showed that polyploid hepatocytes protect from liver cancer.16 In a series of elegant experiments, polyploid hepatocytes were found to “buffer” against loss of tumor suppressors. Inactivation of one copy of a tumor suppressor in a diploid cell leads to loss of heterozygosity (LOH) and increased potential for transformation. However, in the case of polyploid hepatocytes, the additional sets of chromosomes effectively provide “backup” copies of the tumor suppressor, which reduce the likelihood of transformation. We suggest that the large number of liver tumors in the LKO models arise through a combination of the aforementioned mechanisms. Notably, hepatocellular carcinomas (HCCs) in humans and rodents are comprised predominantly of diploid hepatocytes, which strongly supports the notion that HCC formation is driven preferentially by diploid hepatocytes.39-41
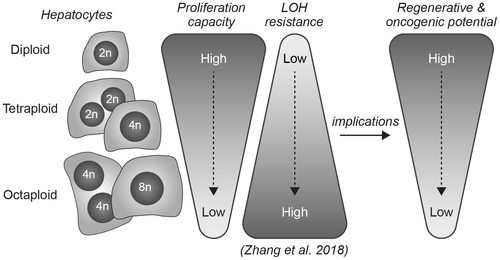
In summary, we discussed a functional difference between ploidy subsets within the liver (Fig. 7). Diploid hepatocytes enter the cell cycle earlier, progress through the cell cycle faster, and proliferate more extensively than polyploids. There are two major implications of this work. First, diploid hepatocytes are prone to tumorigenesis. Whereas polyploid hepatocytes have multiple copies of tumor suppressors that buffer against inactivating mutations,16 diploid hepatocytes with only two copies of each tumor suppressor are much more susceptible to mutational events leading to LOH. We speculate that the increased proliferative capacity associated with the diploid state promotes rapid expansion by these cells. Second, normal aging and liver diseases such as nonalcoholic fatty liver disease, are associated with increased hepatocyte polyploidy and impaired LR.42, 43 Although polyploid hepatocytes can proliferate, we suggest that their reduced proliferative capacity depresses LR. Moreover, in the context of cell therapy, we hypothesize that transplantation of hepatocytes that are predominantly diploid rather than a mixture of all ploidy populations could facilitate rapid liver repopulation. Overall, we are just beginning to understand the functional roles played by diploid and polyploid hepatocytes, and a major goal for future work is to exploit these differences to develop new approaches for liver therapy.
Acknowledgment
We thank Gustavo Leone (The Ohio State University) and Alain deBruin (Utrecht University) for sharing liver-specific E2f7/E2f8 knockout mice. Thanks also to Lynda Guzik (McGowan Institute Flow Cytometry Core at University of Pittsburgh) for flow cytometry assistance.


