Oncogenomic profiling in infant–toddler T-ALL identifies NKX2 family genes as drivers linked to favorable outcomes
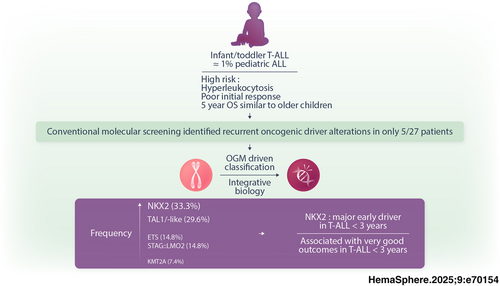
Graphical Abstract
Abstract
T-cell acute lymphoblastic leukemia (T-ALL) is a rare and aggressive hematological malignancy primarily affecting adolescents and young adults and is scarce in infants and toddlers under age 3. Unlike B-ALL, T-ALL in this young population remains poorly characterized due to limited data and lacks evidence-based guidelines to help clinicians determine the optimal treatment approach. In this study, we conducted a comprehensive genetic analysis of infant/toddler T-ALL cases from a French national cohort, utilizing high-throughput targeted sequencing, optical genome mapping, and RNA sequencing. Genetic analysis revealed the absence of TLX1/3 dysregulation. Instead, we identified a significant prevalence of NKX2 rearrangements (n = 9, 33%), co-occurring with MYB alterations (n = 5/9) or chromothripsis-like events (n = 3/9). Additional findings included TAL1/-like anomalies (30%), STAG2::LMO2 (15%), ETS rearrangements (15%), and rarely, KMT2A rearrangements (7%). Comparative analyses with 245 patients aged 3–18 years, enrolled in the pediatric FRALLE2000T French protocol, underscored the distinct clinical and genetic profiles of infants/toddlers. Despite presenting with higher rates of hyperleukocytosis and slower responses to treatment, they demonstrated comparable survival outcomes to older pediatric patients, with a 5-year overall survival (OS) rate of 75.4% (95% confidence interval [CI]: 60.0%–94.8%) versus 75.2% (95% CI: 69.8%–81.1%), p = 0.86. Notably, alterations in NKX2, KMT2A, and STAG2::LMO2 delineated oncogenic subgroups exhibiting a remarkable 100% OS rate, while patients with TAL1 or ETS dysregulation experienced less favorable outcomes. This was further supported by analyses of data from the COG AALL0434 trial, enhancing our understanding of T-ALL in infants/toddlers. Large-scale collaborative studies remain essential to confirm these findings and refine treatment strategies.
BACKGROUND
T-cell acute lymphoblastic leukemia (T-ALL) is an aggressive hematological cancer resulting from the transformation of T-lymphoid progenitors blocked at specific stages of differentiation.1 This malignancy predominantly affects teenagers and young adults, with a median age at diagnosis of 15.3 years in French multicentric pediatric (FRALLE2000T) and adult (GRAALL0305) trials. However, T-ALL is rare at extremes of life, particularly in infants and toddlers before age 3, estimated to comprise less than 8% of T-ALL pediatric cases.2
While treatment protocols for B-ALL in very young patients leverage genetic insights—particularly the high prevalence of KMT2A rearrangements associated with poor prognosis—to guide intensified therapy, no comparable strategies exist for T-ALL.3, 4 Consequently, the clinical management of T-ALL in infants/toddlers remains a significant challenge due to the lack of evidence-based guidelines and limited data on their clinical outcomes and molecular characteristics.
Molecular analyses have profoundly shaped the understanding of T-ALL, allowing for its classification into distinct molecular subgroups defined by differentiation blocks at specific stages.5, 6 These subgroups frequently exhibit activation of oncogenic transcription factors, often stemming from chromosomal rearrangements involving T-cell receptor (TCR) loci or key hematopoietic master genes. Notably, T-ALL can be categorized by driver oncogenes, including LYL1 or HOXA (immature stage), TLX1/3 (early cortical), and TAL1/LMO (mature/late cortical). Recently, integrative approaches have redefined the landscape of driver alterations in T-ALL into 15 subtypes based on gene expression, underscoring this disease's heterogeneity.7 Within these subgroups, additional genetic anomalies have been identified, including the loss of tumor suppressor genes (e.g., PTEN and CDKN2A) and/or activation of oncogenes (e.g., NOTCH1 and IL7R/JAK pathway). These molecular insights have refined diagnostic classification and risk stratification of T-ALL, contributing to improved prognostic assessments to obtain better survival outcomes.8-10 However, the oncogenic mechanisms specific to infants/toddlers remain poorly understood, due to scarce data, underscoring the need for further research in this area.
By analyzing a unique French retrospective cohort of 27 infants/toddlers diagnosed with T-ALL before age 3, we provide valuable insights into the molecular landscape and clinical course of this disease. Employing an integrative genomic approach that includes targeted next-generation sequencing (NGS) of 83 relevant genes, optical genome mapping (OGM), and RNA sequencing (RNA-seq), our findings will be compared with those from pediatric (>3 years) and adult (>18 years) T-ALL cohorts to elucidate age-related genetic differences. This research aims to guide the use of tailored therapeutic approaches, ultimately enhancing treatment outcomes for these patients.
METHODS
Patients and primary samples
Patients were enrolled or treated according to adult or pediatric protocols, including GRAALL2003 (#NCT00222027), GRAALL2005 (#NCT00327678), and FRALLE2000T. Informed consent was obtained per the Declaration of Helsinki. Clinical and biological data—including demographics, treatment responses, and survival outcomes—were collected under the Principal Investigator's oversight and supplemented by data from clinical centers as needed. The flowchart of the study is provided in Supporting Information S2: Figure 1. Additionally, published data from the Children's Oncology Group AALL0434 trial (#NCT00408005) provided a validation cohort of patients <3 years.
Assessment of treatment response
Early treatment response was assessed through prednisone response at day 8 and minimal residual disease (MRD) levels at the end of induction (EOI) therapy. MRD was quantified using PCR-based detection of clonal immunoglobulin (IG) and T-cell receptor (TCR) gene rearrangements, with positivity defined by a threshold of ≥10−4.11
Integrated immunophenotypic, molecular, and genomic profiling of T-ALL diagnostic samples
T-ALL diagnostic samples (≥80% blasts) underwent immunophenotyping and TCR recombination analysis.8, 12, 13 Main oncogenetic subgroups were identified by detecting STIL::TAL1 fusion via RT-PCR, quantifying TLX1 and TLX3 oncogenic transcripts and measuring HOXA9 expression by RQ-PCR.14-16 Mutational analysis and assessment of recurrent T-ALL copy number alterations were conducted on diagnostic DNA using pan-exon targeted NGS and Multiplex Ligation-Dependent Probe Amplification (MLPA).8 Somatic mutations in 83 genes were detected with a custom Nextera XT gene panel (Illumina; Supporting Information S3: Table 1). MLPA employed the SALSA P383 T-ALL probe mix kit (MRC-Holland), covering 53 probes across 13 chromosomal regions with biological significance, available at https://www.mrcholland.com/.
OGM
OGM was performed on diagnostic samples as previously described17 using 1.5 million cells from BM aspirates or PB samples to purify ultra-high molecular weight DNA (Bionano Prep SP BMA kit, Bionano Genomics). DNA extraction, labeling, chip loading, and data collection followed manufacturer protocols. Data were analyzed with the Bionano rare variant pipeline in Bionano Solve V3.5, and structural variant (SV)/copy number variants (CNV) were visualized on Bionano Access V1.7 using the GRCh37 reference genome.
RNA sequencing and data analysis
RNA-seq was conducted on diagnostic samples with established pipelines.18-21 RNA quality (RIN ≥ 8) was confirmed using a BioAnalyzer (Agilent). Libraries were prepared with SureSelect XT HS2 (Agilent) and sequenced on a NovaSeq. 6000 (Illumina). Raw reads were trimmed (Agent trim v2.0.5), aligned to GRCh38 with STAR v2.7.9, deduplicated (Agent Locatit), and gene-level counts obtained with Subread featureCounts v2.0.0. Differential gene expression was analyzed with DESeq. 219 using apeglm shrinkage.22 Uniform manifold approximation and projection was performed using uwot package (parameters n_neighbors = 15, min_dist = 0.05, spread = 2, n_components = 2, metric = “euclidean”). Hierarchical clustering and heatmap were done with ComplexeHeatmap package.23 Average method was used to perform hierarchical clustering.
Statistical analysis
Patient characteristics were compared using the Fisher's exact test for categorical variables, and parametric (t-test) or non-parametric (Mann–Whitney U test or ANOVA) tests for continuous variables. Survival analyses for overall survival (OS) and event-free survival (EFS) were performed using the log-rank test. OS was defined from diagnosis to death (censoring survivors at last follow-up), while EFS spanned from complete remission (CR) to relapse, with death during remission as a competing event. Univariate survival analysis used the Cox proportional hazards model, reporting hazard ratios (HR) and 95% confidence intervals (95% CI). Significance was indicated as *p ≤ 0.05, **p ≤ 0.01, ***p ≤ 0.001. Analyses were performed using R v4.3.0 and GraphPad Prism v9.5.0 (GraphPad Software, Inc.).
RESULTS
Incidence and clinical outcome of infant/toddler T-ALL
To determine the incidence of T-ALL in this population, we analyzed a consecutive cohort of 807 pediatric T-ALL patients (ages 0–18) whose biological samples were submitted for molecular screening to the onco-hematology laboratory at Necker Children's Hospital between 1995 and 2024. Among these, only 48 cases were identified in infants/toddlers (<3 years), compared with 759 cases in children aged 3–18 years, underscoring the rarity of T-ALL in this early age group (~6% incidence) (Supporting Information S2: Figure 2). To corroborate this observation, we reviewed the recently published COG AALL0434 dataset, which reported 102 infant/toddler cases out of 1273 pediatric T-ALL patients, indicating a comparable incidence of ~8%. Considering that T-ALL constitutes 10%–15% of pediatric ALL, these findings suggest that T-ALL in infants/toddlers represents only 1% of all pediatric ALL cases.
Among the French cohort of 48 patients, 27 (4 infants and 23 toddlers) had available material for comprehensive molecular analysis and were included in this study. A complete overview of their clinical and biological characteristics is provided in Supporting Information S4: Table 2.
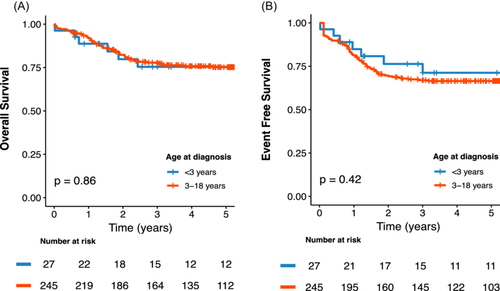
To further characterize infant/toddler T-ALL, we compared their clinical features, treatment responses, and outcomes with those of pediatric T-ALL patients (≥3 years) enrolled in FRALLE2000T (n = 245) (Table 1). The median age at diagnosis was 1.8 years (range 0.5–2.9) for the infants/toddlers and 9.8 years (range 3.0–19.5) for the older pediatric cohort, with both groups exhibiting a male predominance (66.7% and 77.6%, p = 0.206). Interestingly, infants/toddlers displayed more aggressive features at diagnosis, including higher hyperleukocytosis (179 × 109/L vs. 97 × 109/L, p = 0.019) and a tendency for increased incidence of central nervous system (CNS) involvement (19.2% vs. 11.1%, p = 0.224). Initial treatment responses were less favorable in infants/toddlers, with significantly lower corticosteroid response rate (33.3% vs. 56.8%, p = 0.028) and reduced undetectable MRD at EOI (28% vs. 60.7%, p = 0.002). Consequently, hematopoietic stem cell transplant (HSCT) in first CR was more frequently performed in the <3 years cohort (24% vs. 10.1%, p = 0.039). Despite these high-risk features, 92% of infants/toddlers achieved CR, comparable to the FRALLE2000T cohort (p = 0.905). Additionally, clinical outcomes were similar in both groups, with a 5-year OS of 75.4% (95% CI: 60.0%–94.8%) versus 75.2% (95% CI: 69.8%–81.1%; p = 0.86) and a 5-year EFS of 71.2% (95% CI: 55.1%–92.1%) versus 66.5% (95% CI: 60.7%–72.8%; p = 0.42) for infants/toddlers and the FRALLE2000T cohort, respectively (Figure 1A,B).
| Infants toddlers (N = 27) | Pediatric 3–18 years FRALLE2000T (N = 245) | Total (N = 272) | p valuea | |
|---|---|---|---|---|
| Ageb (year) | 1.8 (0.5–2.9) | 9.8 (3.0–19.5) | 9.0 (0.5–19.5) | |
| Male | 18 (66.7%) | 190 (77.6%) | 208 (76.5%) | 0.206 |
| WBCb (x109/L) | 179 (18–997) | 97 (0.3–980) | 99 (0.3–997) | 0.019 |
| CNS involvementc | 5 (19.2%) | 27 (11.1%) | 32 (11.9%) | 0.224 |
| Treatment response | ||||
| Prednisone response | 8 (33.3%) | 134 (56.8%) | 142 (54.6%) | 0.028 |
| Complete remission | 23 (92.0%) | 227 (92.7%) | 250 (92.6%) | 0.905 |
| MRD < 10−4 at EOId | 7 (28.0%) | 125 (60.7%) | 132 (57.1%) | 0.002 |
| Allo-HSCT | 6 (24.0%) | 23 (10.1%) | 29 (11.5%) | 0.039 |
| Outcome | ||||
| 5-year OS (95% CI) | 75.4% (60.0–94.8) | 75.2% (69.8–81.1) | 75.2% (70.0–80.8) | 0.86 |
| 5-year EFS (95% CI) | 71.2% (55.1–92.1) | 66.5% (60.7–72.8) | 66.9% (61.5–72.9) | 0.42 |
- Note: p < 0.05 are indicated in bold.
- Abbreviations: 95% CI, 95% confidence interval; Allo-HSCT, allogenic hematopoietic stem cell transplantation; AT-ALL, T-cell acute lymphoblastic leukemia; CNS, central nervous system; EFS, event-free survival; EOI, end of induction; MRD, minimal residual disease; OS, overall survival; WBC, white blood count.
- a Statistical tests performed: Fisher's exact test, Wilcoxon rank-sum test.
- b Statistics presented: median (min–max).
- c CNS Involvement: CNS3 in both FRALLE2000T trial and infant/toddler cohort.
- d MRD at EOI corresponds to MRD evaluation after induction and was quantified using PCR-based detection of clonal immunoglobulin (IG) and T-cell receptor (TCR) gene rearrangements.
Distinct maturation block and unresolved oncogenic drivers in infant/toddler T-ALL cases
To explore age-related biological differences in T-ALL, we compared infants/toddlers with two randomly selected control groups: pediatric patients (aged 3–18, n = 29) and adults (>18 years, n = 35), with available molecular data. Age distributions and oncogenic profiles of the control groups were validated against national cohorts (FRALLE2000T for pediatrics and GRAALL2003-2005 for adults), confirming their representativity (Supporting Information S2: Figures 3 and 4).
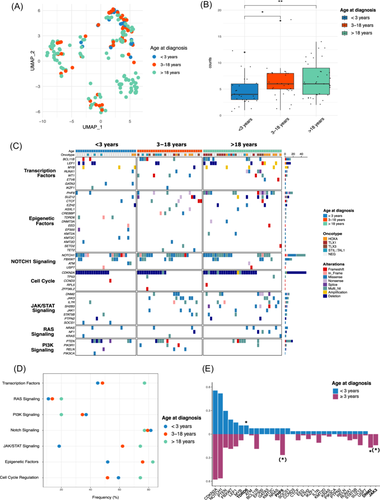
Using RNA-seq on available samples, we conducted unsupervised dimension reduction with the 1000 most variable genes. Infants/toddlers (<3 years, n = 20) did not form a distinct cluster from older pediatric (3–18 years, n = 47) and adult patients (>18 years, n = 117), indicating that clustering is not age-driven but likely reflects underlying maturation stages and oncogenic drivers (Figure 2A).
Immunophenotypic analysis suggested a later maturation block in infants/toddlers, with a trend for fewer early T-cell precursor (ETP) phenotypes (3.8% vs. 10.3% and 24.2%, p = 0.063) and a higher prevalence of the TCRγδ phenotype (32% vs. 6.9% in 3–18 years and 11.4% in >18 years, p = 0.027; Table 2). Conventional molecular screening identified recurrent oncogenic driver alterations in only 5/27 patients: STIL::TAL1 (n = 3) and HOXA9 (n = 2). Remarkably, TLX1/TLX3 dysregulation was absent in infant/toddler cases, as opposed to 3–18 years (24.1%) and >18-year patients (40.0%) (p = 0.002; Table 2). All these findings suggest that infant/toddler T-ALL exhibits distinct oncogenic mechanisms not fully captured by standard molecular screening.
| Infants and toddlers (N = 27) | Pediatric 3–18 years (N = 29) | Adult >18 years (N = 35) | Total (N = 91) | p valuea | |
|---|---|---|---|---|---|
| Ageb (year) | 1.8 (0.5–2.9) | 9.8 (4.2–18-2) | 29.4 (18.3–48.1) | 12.6 (0.5–48.1) | |
| Immunophenotypec | |||||
| ETP phenotype | 1 (3.8%) | 3 (10.3%) | 8 (24.2%) | 12 (13.6%) | 0.063 |
| Immature (IM0/d/g) | 0 (0.0%) | 7 (24.1%) | 11 (31.4%) | 18 (20.2%) | 0.009 |
| Cortical (IMB.preAB) | 12 (48.0%) | 13 (44.8%) | 17 (48.6%) | 42 (47.2%) | 0.952 |
| Mature TCRgd | 8 (32.0%) | 2 (6.9%) | 4 (11.4%) | 14 (15.7%) | 0.027 |
| Mature TCRab | 5 (20.0%) | 7 (24.1%) | 3 (8.6%) | 15 (16.9%) | 0.224 |
| Oncogenetic classification | |||||
| HOXA | 2 (8.0%) | 4 (13.8%) | 8 (22.9%) | 14 (15.7%) | 0.279 |
| TLX1/3 | 0 (0.0%) | 7 (24.1%) | 14 (40.0%) | 21 (23.6%) | 0.002 |
| STIL-TAL | 3 (12.0%) | 5 (17.2%) | 3 (8.6%) | 11 (12.4%) | 0.576 |
| Negative | 20 (80.0%) | 13 (44.8%) | 10 (28.6%) | 43 (48.3%) | <0.001 |
- Note: p < 0.05 are indicated in bold.
- Abbreviations: ETP, early thymic precursor; T-ALL, T-cell acute lymphoblastic leukemia.
- a Statistical tests performed: Fisher's exact test, Wilcoxon rank-sum test.
- b Statistics presented: median (min–max).
- c T-ALL are categorized into four subclasses: (1) immature (no detectable TCRb VDJ): IM0 (germline TCRd and TCRg), IMd (TCRd rearranged, no TCRg rearrangement), and IMg (both TCRd and TCRg rearranged); (2) early-cortical: IMb/Pre-ab; (3) mature sTCRab+; and (4) mature sTCRgd.
Reduced mutational burden and copy number variations in infant/toddler T-ALL
We then explored the mutational and CNV landscape of infant/toddler T-ALL. These cases harbored a significantly lower burden of oncogenic alterations, with a median of four somatic variants per patient (range 1–12) compared to six in the 3–18 years group (range 5–8, p = 0.037) and six in adults (range 4–9, p = 0.0048) (Figure 2B). Notably, alterations in the JAK/STAT pathway (especially JAK3) and epigenetic regulators (especially PHF6) were rare, aligning with the cortical phenotype observed in this age group (Figure 2C–E). Additionally, gene alterations distribution within other functional pathways, especially NOTCH signaling (NOTCH1 and FBXW7) and cell cycle regulation (CDKN2A), were similar across all ages.
Taken together, these findings highlight the molecular heterogeneity and unique features of T-ALL in infants/toddlers, underscoring the need for advanced molecular approaches to better classify and understand this rare subtype.
OGM resolves oncogenic driver events in infant/toddler T-ALL
To address this critical gap, we performed a comprehensive cytogenomic analysis using OGM, to enhance detection of high-resolution SV often missed by conventional methods. OGM successfully identified initiating driver alterations in all 27 infant/toddler T-ALL cases including previously unresolved cases, and classified them into five groups: NKX2 (n = 9, 33.3%), TAL1/-like (n = 8, 29.6%), STAG2::LMO2 (n = 4, 14.8%), ETS (n = 4, 14.8%), and KMT2A (n = 2, 7.4%) rearrangements (Figure 3A,B and Supporting Information S5: Table 3). Notably, NKX2 and ETS alterations were significantly enriched in infants/toddlers (p < 0.0001 and p = 0.033, respectively). Additionally, STAG2::LMO2 rearrangements from translocation t(X;11) were exclusive to this age group (p = 0.007) (Figure 3C and Supporting Information S2: Figure 5A).
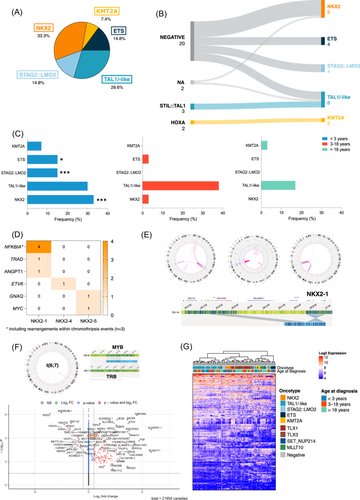
NKX2 rearrangements affected various genes within the NKX2 family (NKX2-1, n = 6; NKX2-4, n = 1; and NKX2-5, n = 2) and several partners, including NFKBIA (n = 4), TRAD (n = 1), ANGPT1 (n = 1), ETV6 (n = 1), GNAQ (n = 1), and MYC (n = 1). Among them, three cases harbored a chromothripsis-like event affecting chromosome 14, with a consistent SV involving the NKX2-1 and NFKBIA loci at 14q13.3. Excluding these cases, 5/6 patients with NKX2 rearrangements also exhibited MYB alterations, either as translocation t(6;7)/TRB::MYB (n = 3) or 6q23 duplication (n = 2). RNA sequencing showed MYB upregulation in the NKX2 group, suggesting a potential cooperative role between NKX2 and MYB in infant/toddler T-ALL (Figure 3D–F).
In other driver groups, the four alterations involving ETS transcription factors included SPI1 fusions (n = 3) with STMN1 and TCF7 as partner genes, and a t(7;21)/TRB::ERG translocation (n = 1) (Supporting Information S2: Figure 5B). TAL1/-like dysregulations resulted from STIL::TAL1 fusion (n = 3), LMO1/2 rearrangement (with or without STIL::TAL1 fusion, n = 5), or TAL1-positive expression (n = 1). The two KMT2A rearrangements involved CLTC and MLLT3 as partner genes.
Besides MYB gain, OGM also detected recurrent secondary aberrations, including 9pdel/CDKN2A/B (n = 16, 59%), 6qdel (n = 5, 18%), 10q24del/PTEN (n = 5, 18%), and 11qdel (n = 3, 11%) (Supporting Information S5: Table 3).
Integrating oncogene data into transcriptomic analysis revealed that infants/toddlers cluster according to driver alterations, validating their representation within five distinct oncogenic families (Figure 3G). Overall, OGM uncovers the cytogenetic landscape of infant/toddler T-ALL, with particularly frequent NKX2 alterations associated with MYB expression or chromothripsis.
Infant/toddler T-ALL exhibits outcome heterogeneity, with NKX2-1 rearrangement marking favorable outcomes
T-ALL in infants/toddlers is characterized by aggressive features and slower initial treatment responses. Despite these challenges, 5-year outcomes remain in line with those observed in older children. Thus, we sought to elucidate the underlying factors contributing to these outcomes.
With a median follow-up of 5.4 years, 6/27 patients died from disease (n = 5) or toxicity during progressive disease (n = 1). In univariate analysis, leukocytosis was associated with poorer OS and EFS (HR 6.3, 95% CI [1.4–28.8], p = 0.018; and HR 7.5, 95% CI [1.6–34.4], p = 0.01), respectively) (Figure 4A,B). In contrast, early treatment response parameters, including negative MRD at EOI, did not correlate with survival. Interestingly, none of the four relapsed cases were salvaged by subsequent treatment, including chemotherapy (n = 3) or HSCT (n = 1) with a median time to death of 0.4 years (0.1–1.2) (Supporting Information S4: Table 2 and Supporting Information S2: Figure 6). These findings highlight the difficulties in salvaging relapsed/refractory disease, while indicating that a slower initial response doesn't predict treatment failure in infants/toddlers T-ALL.
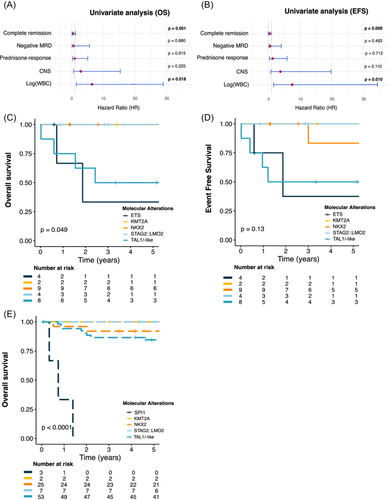
Considering the biological heterogeneity within this group, we hypothesized that the diversity of driver oncogenes might define poor and high-risk groups. Patients with NKX2 (n = 9), STAG2::LMO2 (n = 4) and KMT2A (n = 2) rearrangements were all alive, with a median follow-up of 5.4 years (0.9–14.9). Conversely, patients with TAL1/-like and ETS alterations exhibited poorer outcomes with 5-year OS probabilities of 50.0% (95% CI [25–100]) and 33.3% (95% CI [6.7–100]), p = 0.049 and a 5-year EFS of 50.0% (95% CI [25–100]) and 37.5% (95% CI [8.4–100]), p = 0.13, respectively (Figure 4C,D). Notably, two patients developed secondary sarcomas: one patient (ETS group) was diagnosed with Langerhans cell sarcoma 19 months after T-ALL and died shortly after the diagnosis, while another patient (NKX2 group) was diagnosed with hepatic sarcoma 3 years post-T-ALL and remains in remission at 8.5 years.
In an effort to validate our results, we analyzed published data from 1273 pediatric T-ALL aged 1–18 years, treated in the COG AALL0434 trial.7 Of the 102 patients under age 3, the 5-year OS was 86.1% (95% CI [79.6–93.1]), comparable to the 90.3% (95% CI [88.6–92.1]) OS rate in the 3–18 group (p = 0.32, Supporting Information S2: Figure 7). Using available molecular data, we reclassified 92 of these patients according to our molecular classification: TAL1 dysregulation (n = 53), NKX2 rearrangement (n = 25), STAG2::LMO2 (n = 7), SPI1 fusion (n = 3), and KMT2A rearrangement (n = 2). TLX3 was undetected and only two patients exhibited TLX1 dysregulation, confirming the rarity of these drivers in infant/toddler T-ALL. Consistent with our results, patients with NKX2, STAG2::LMO2, and KMT2A alterations displayed favorable outcomes, achieving a 5-year OS of 92.0% (95% CI [82.0–100] for NKX2 and 100% (95% CI [100–100] for STAG2::LMO2 and KMT2A. Conversely, SPI1 patients had poor outcomes, with all patients dying within 1 year (p < 0.0001). In contrast, TAL1/-like patients demonstrated better survival with a 5-year OS of 84.6% (95% CI [75.3–95.0]), suggesting that the COG chemotherapy regimen may be particularly effective for infant/toddler patients with TAL1-driven T-ALL (Figure 4E and Supporting Information S2: Figure 8).
DISCUSSION
Our findings provide insight into the previously underexplored biology of infant/toddler T-ALL, identifying five oncogenic subgroups: NKX2 rearrangements, TAL1/-like subgroup, STAG2::LMO2, ETS, and KMT2A fusions. Notably, we report a high incidence of NKX2 alterations (33%), in keeping with the 27% incidence in COG ALL0434 and in contrast to <10% incidence observed in older age groups.7, 24 Alterations in NKX2 genes, member of the NKL homeobox family, are documented in T-ALL,25 and associated with various oncogenic pathways, including chromothripsis, NFKBIA enhancer hijacking, and TRB::MYB rearrangements.7 Our data confirm these oncogenic associations, especially with chromothripsis and MYB upregulation, highlighted by the frequent co-occurrence of the TCRB::MYB rearrangement.2 This previously reported recurring event in <3-year T-ALL26 suggests a potential early cooperative mechanism in leukemogenesis, warranting further investigation to elucidate its role in disease initiation and progression. Consistent with COG AALL0434 data, we observed a particularly low incidence of TLX1/3 deregulation in infant/toddler T-ALL. This distinction is particularly meaningful as NKX2 and TLX family genes share a highly conserved homeobox domain, suggesting a possible evolutionary pathway that merits further study.27
To address concerns regarding the small cohort size inherent to this rare pathology and the data heterogeneity stemming from our 20-year inclusion period, we cross-validated our findings with the COG AALL0434 protocol. Although OS rates in the COG cohort were slightly higher—likely reflecting intensified treatment—both cohorts consistently linked NKX2 rearrangements with excellent outcomes, underscoring their prognostic relevance. KMT2A rearrangements, while prevalent and prognostically poor in infant B-ALL,28 were rare in infant/toddler T-ALL. Notably, all affected patients in both cohorts remain alive, suggesting a distinct clinical entity, though small sample sizes warrant cautious interpretation. In line with recent studies, we observed recurrent SPI1 and STAG2::LMO2 fusions in infant/toddler T-ALL.26, 29 While STAG2::LMO2 rearrangement was identified exclusively in TCRγδ phenotype cases <3 years, consistent with prior findings, we did not observe the reported association with poor survival.26, 29 Instead, our findings align with COG AALL0434, where all STAG2::LMO2 patients survived, suggesting a low-risk disease.7 In contrast, patients with SPI1 fusions showed poor outcomes, as described in the literature.7, 26 These findings imply that this subgroup may not benefit from intensified treatment regimens, highlighting the need for alternative therapeutic strategies tailored to their high-risk profile. Interestingly, TAL1/-like infants/toddlers showed better outcomes in the COG AALL0434 protocol. However, TAL1-positive patients in our study experienced frequent relapses and poor responses to salvage therapy, underscoring the aggressive nature of this subgroup. Further studies should delineate which aspects of the intensified treatment arms in COG AALL0434 contribute to the apparent therapeutic benefit observed in infant/toddlers with TAL1/-like T-ALL.
In conclusion, our study provides a comprehensive analysis of T-ALL in infants/toddlers. By elucidating the oncogenic landscape and clinical outcomes, these findings lay the groundwork for more precise management strategies. Given its rarity, international collaboration would be essential to enhance understanding of molecular subtypes, enabling tailored treatments and innovative therapy that improve outcomes and minimize risks for this vulnerable population.
ACKNOWLEDGMENTS
The authors thank all participants and investigators of the 16 SFCE (Société Française des Cancers et des leucémies de l'Enfant et de l'adolescent) centers involved in collection and provision of data and patient samples.
AUTHOR CONTRIBUTIONS
M. D., E. B., and V. A. designed the study, and interpreted and discussed all the results. E. B. analyzed the OGM results. A. P. and G. C. helped with bioinformatics analyses. M. S., A. P., A. B., B. B., M. W., I. A., P. S., P. S. R., D. B., N. G., M. L., I. P., S. T., N. G., and C. P. provided study materials or patients. M. D. and M. S. analyzed the data and performed statistical analysis. M. D. and E. B. wrote the original manuscript. E. M., A. B., M. S., and V. A. participated in critical revision of the manuscript. All authors reviewed the article and approved the submitted version.
CONFLICT OF INTEREST STATEMENT
The authors declare no competing financial interests.
FUNDING
This work was supported by grants to the Necker Laboratory from the Association pour la Recherche contre le Cancer (Equipe labellisée), Ligue Contre le Cancer (Equipe labellisée), Institut National du Cancer (PEDIAC program [INCa_15670]), the Agence Nationale de la Recherche (Institut THEMA Saint-Louis, ANR-23-IAHU-0005), and Association Cassandra. Samples were collected and processed by the AP-HP “Direction de Recherche Clinique” Tumor Bank at Necker-Enfants Malades. M. D. was supported by INSERM « Soutien pour la formation à la recherche fondamentale et translationnelle en Cancérologie - Doctorat en science – FRFT-Doc ».
Open Research
DATA AVAILABILITY STATEMENT
The datasets generated and/or analyzed during the current study are available from the corresponding author on reasonable request. The RNA-sequencing data generated in this study will be deposited in the European Genome-Phenome Archive (EGA) under the dataset accession ID EGAD0000101027.


