H1-0 is a specific mediator of the repressive ETV6::RUNX1 transcriptional landscape in preleukemia and B cell acute lymphoblastic leukemia
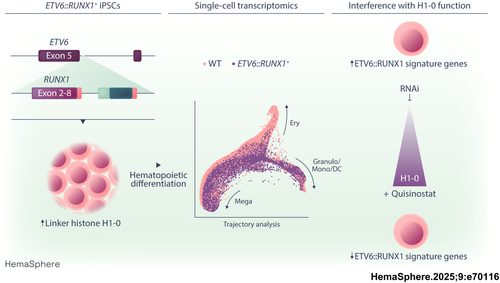
Graphical Abstract
Abstract
ETV6::RUNX1, the most common oncogenic fusion in pediatric B cell precursor acute lymphoblastic leukemia (BCP-ALL), induces a clinically silent preleukemic state that can persist in carriers for over a decade and may progress to overt leukemia upon acquisition of secondary lesions. The mechanisms contributing to quiescence of ETV6::RUNX1+ preleukemic cells still remain elusive. In this study, we identify linker histone H1-0 as a critical mediator of the ETV6::RUNX1+ preleukemic state by employing human -induced pluripotent stem cell (hiPSC) models engineered by using CRISPR/Cas9 gene editing. Global gene expression analysis revealed upregulation of H1-0 in ETV6::RUNX1+ hiPSCs that was preserved upon hematopoietic differentiation. Moreover, whole transcriptome data of 1,727 leukemia patient samples showed significantly elevated H1-0 levels in ETV6::RUNX1+ BCP-ALL compared to other leukemia entities. Using dual-luciferase promoter assays, we show that ETV6::RUNX1 induces H1-0 promoter activity. We further demonstrate that depletion of H1-0 specifically inhibits ETV6::RUNX1 signature genes, including RAG1 and EPOR. Single-cell sequencing showed that H1-0 is highly expressed in quiescent hematopoietic cells. Importantly, H1-0 protein levels correspond to susceptibility of BCP-ALL cells towards histone deacetylase inhibitors (HDACis) and combinatorial treatment using the H1-0-inducing HDACi Quisinostat showed promising synergism with established chemotherapeutic drugs. Taken together, our data identify H1-0 as a key regulator of the ETV6::RUNX1+ transcriptome and indicate that the addition of Quisinostat may be beneficial to target non-responsive or relapsing ETV6::RUNX1+ BCP-ALL.
INTRODUCTION
The chromosomal translocation t(12;21)(p13;q22) is the most common structural variation of pediatric B cell precursor acute lymphoblastic leukemia (BCP-ALL) and results in the fusion of the two hematopoietic transcription factors ETS translocation variant 6 (ETV6) and runt-related transcription factor 1 (RUNX1). The ETV6::RUNX1 fusion gene is acquired in utero in 1–5% of newborns1, 2 and requires further oncogenic mutations for progression to overt leukemia, predominantly including copy number alterations of genes involved in B cell development or cell cycle, e.g., ETV6, PAX5, CDKN2A, and CDKN2B.3-6 Despite overall survival rates of ETV6::RUNX1+ pediatric leukemia exceeding 95% with current chemotherapy regimens, patients suffer from substantial acute and late toxicities, and disease recurrence is observed in approximately 5% of patients.7 This underlines the importance of understanding ETV6::RUNX1+ BCP-ALL pathophysiology to enable further improvement of treatment.
While ETV6::RUNX1 itself is not sufficient for leukemic transformation, we and others have demonstrated that the fusion protein establishes a distinct preleukemic cell state.8-11 ETV6::RUNX1 exerts an overall repressive effect on preleukemic cells, impeding early B cell differentiation, cell cycle, and inflammatory pathways, such as TGFβ signaling.10-13 Transcriptional repression is conferred via the pointed domain (PNT) of the ETV6 moiety, while the runt-homology domain (RHD) of the RUNX1 fusion part directly binds to promoters harboring the canonical RUNX1-binding motif “TGYGGTY”.14-17 ETV6::RUNX1 associates with multiple co-repressors, including NCOR1, mSin3A, and histone deacetylases, such as HDAC3,18, 19 that induce changes in chromatin structure, leading to the characteristic repression of RUNX1 target genes.20
Modeling approaches of ETV6::RUNX1+ preleukemia and overt leukemia in mice were largely unable to reproduce restriction to B lineage leukemia seen in humans.21-23 This might be attributed to expression level-dependent effects of ETV6::RUNX1, especially in models using viral transduction.24 Additionally, discrepancies between ETV6::RUNX1+ mouse and human models were linked to poor inter-species conservation of GGAA repeat enhancers recently identified as key regulators of the ETV6::RUNX1 + BCP-ALL gene signature.25 Therefore, accurately recapitulating the intricate effects of ETV6::RUNX1 may necessitate modeling its function in a human background with physiological expression levels, as demonstrated by Böiers et al. using human-induced pluripotent stem cells (hiPSCs).10
In this study, we detect consistent upregulation of linker histone H1-0 in a preleukemic hiPSC model and leukemic blasts carrying the ETV6::RUNX1 fusion gene. As a member of the H1 family of linker histones, H1-0 affects chromatin compaction.26, 27 H1-0 is heterogeneously expressed in solid tumors where it contributes to the intricate balance between cancer cell proliferation and differentiation.27 Our data reveal that H1-0 regulates quiescence and acts as an important mediator of the ETV6::RUNX1 gene expression profile. Moreover, our study identifies the histone deacetylase inhibitor (HDACi) Quisinostat as a potential targeted approach for combinatorial drug treatment of ETV6::RUNX1+ leukemic cells.
METHODS
Cell lines and patient-derived xenografts (PDX)
HW8 hiPSCs were generated from peripheral blood mononuclear cells (PBMCs) of a glioma patient using the CytoTune-iPS 2.0 Sendai Reprogramming kit (Thermo Fisher Scientific, #A16517) following written informed consent. Study approval was obtained by the internal review board at the National Institutes of Health (NIH, protocol number: 16CN 069). Cellartis human iPSC line 12 (ChiPSC12, #Y00280) was purchased from Takara Bio. BCP-ALL and 293T cell lines were obtained from the German Collection of Microorganisms and Cell Cultures (DSMZ). In-house leukemia patient samples for injection into NSG mice (The Jackson Laboratory) were retrieved from the Biobank of the University Hospital of Düsseldorf following informed consent in accordance with the Declaration of Helsinki. Study approval was obtained by the ethics committee of the Medical Faculty of the Heinrich Heine University (study number: 2019-566). All animal experiments adhered to regulatory guidelines set by the official committee at LANUV (Akt. 81-02.04.2017.A441) and were authorized by the animal research institute (ZETT) at Heinrich Heine University Düsseldorf.
Molecular cloning of a RUNX1 HDR template
A RUNX1 homology-directed repair (HDR) template targeting ETV6 intron 5 was constructed by combining RUNX1 exon sequences 2–8 with a puromycin resistance gene under control of the human EF-1α promoter. Homology arm sequences of ≈500 bp were polymerase chain reaction (PCR)-amplified from ChiPSC12 genomic DNA and ligated to both sides of the HDR template. The RUNX1 HDR template was subcloned into plasmid pUC19 (Addgene, #50005), linearized by PCR and concentrated by isopropanol precipitation to achieve a concentration ≥1 µg/µL. Single-guide RNA (sgRNA) sequences targeting the 5′ region of ETV6 intron 5 were designed using the online prediction tool CRISPOR (http://crispor.tefor.net/)28 and subcloned into the pUC19-U6-BbsI-sgRNA plasmid. Target sequences used for CRISPR/Cas9 genome editing of hiPSCs were GGATGAGGCTAAATCCCTAA (hg38, chr12: 11,870,115–11,870,134, + strand) and GCCTAATTGGGAATGGTGCG (hg38, chr12: 11,870,054–11,870,073, − strand).
CRISPR/Cas9 editing of hiPSCs
Following incubation with 10 µM Y-27632 (STEMCELL Technologies, #72304) for 2 h, single-cell suspensions of HW8 or ChiPSC12 hiPSCs were prepared using StemPro Accutase (Thermo Fisher Scientific, #A1110501). 10 × 106 hiPSCs were resuspended in 100 µL P3 solution with supplement (Lonza, #V4XP-3024) and transfected with 2.5 µg linearized RUNX1 HDR template and 4 µg each of pCW-Cas9 plasmid (Addgene, #50661) as well as two sgRNA plasmids using program CD-118 of the 4D Nucleofector system (Lonza). hiPSCs were plated onto 10 cm Geltrex-coated dishes in mTeSR Plus/Y-27632. Medium was exchanged to mTeSR Plus without Y-27632 after 24 h. Selection with 0.5 µg/mL puromycin (Thermo Fisher Scientific, #A1113803) was commenced 48 h after Nucleofection and single colonies were picked under microscopic guidance into a 96-well plate at days 7–10. Clones were expanded for subsequent confirmation of correct HDR template insertion.
In vitro differentiation of hiPSCs
Feeder-free differentiation of hiPSCs was performed using the STEMdiff Hematopoietic kit (Stemcell Technologies, #05310) according to the manufacturer's instructions. Briefly, hiPSCs were seeded onto Geltrex-coated (Thermo Fisher Scientific, #A1413301) 12-well plates as aggregates. The next day (D0), medium A (containing bFGF, BMP4, and VEGFA) was added to wells containing 16–40 hiPSC colonies to induce mesodermal differentiation, and a half-medium change was performed on D2. On D3, medium A was removed and medium B (containing bFGF, BMP4, VEGFA, SCF, Flt3L, and TPO) was added to induce hematopoietic differentiation. Half-medium changes were performed on D5, D7, and D10. After 12 days, differentiated hematopoietic cells float in suspension and were harvested from the supernatant for downstream analyses.
siRNA-mediated H1-0 knockdown
Specific siRNA sequences for knockdown of H1-0 in REH cells were designed using the Eurofins siRNA design tool (https://eurofinsgenomics.eu/en/ecom/tools/sirna-design/) and purchased from Eurofins Genomics. Sequences are listed in Table S1. The 1 × 10⁶ REH cells were transfected with 200 pmol of each siRNA pool (siCtrl, siH1-0_1, siH1-0_2) in the 100 µL nucleocuvette format using the 4D Nucleofector system (Lonza, SF solution, program DS-150).
Dual-luciferase reporter assay
Human H1-0 promoter sequence (nucleotides −351 to +161 from TSS) was PCR-amplified from REH cell genomic DNA and inserted into Firefly luciferase vector pGL4.22 (Promega, #E6771) at KpnI and HindIII restriction sites. 293T cells at 50%–70% confluency were transfected with 755 ng plasmid DNA using Xfect Transfection Reagent (Clontech Laboratories, #631317) in 24-well plates according to the manufacturer's instructions. To determine the effect of ETV6::RUNX1 on H1-0 promoter activation, each well was transfected with 500 ng pGL4.22 vector with or without H1-0 promoter expression as well as 5 ng Renilla luciferase control plasmid pGL4.73 (Promega, #E6911) and 250 ng of the respective pcDNA3.1 vectors (Thermo Fisher Scientific, #V79020) for expression of ETV6::RUNX1 or RUNX1 or empty vector in triplicates. To analyze the effect of Quisinostat on H1-0 promoter activation, transfection was performed with 500 ng pGL4.22 vector with H1-0 promoter expression and 5 ng Renilla luciferase control plasmid, and cells were treated with the indicated concentrations of Quisinostat or DMSO (1:10,000) for 24 h. Cells were lysed 48 h after transfection with Passive Lysis buffer and luciferase signal was measured on a Tecan SPARK 10 M reader using the Dual-Luciferase Reporter Assay System (Promega, #E1910). Firefly luciferase signal was normalized to Renilla luciferase activity. Adequate protein expression of ETV6::RUNX1 and RUNX1 was determined by Western blot.
In vitro inhibitor treatments
BCP-ALL cell lines were treated with 1 µM JNJ-26481585/Quisinostat at a concentration of 1 × 10⁶ cells per ml and RNA was extracted after 24 h for subsequent analysis of H1-0 expression by RT-qPCR and RNA-seq analysis. DMSO-dissolved compounds were purchased from Selleck Chemicals and MedChem Express. For drug synergy analysis, Quisinostat (concentration range: 0.2–20 nM), AR-42 (concentration range: 10–1000 nM), suberanilohydroxamic acid (SAHA)/Vorinostat (concentration range: 100–5000 nM), Vincristine (concentration range: 0.1–5 nM), Daunorubicin (concentration range: 1.5–50 nM), and Bortezomib (concentration range: 1–10 nM) were printed onto 384-well plates (Corning, #3570) in a randomized fashion in increasing concentrations of 8 × 8 matrices using a D300e digital dispenser (Tecan) and normalized with DMSO (Sigma-Aldrich, #2650). BCP-ALL cell lines were seeded at a concentration of 200,000 cells/mL (6000 cells/well). Due to limited amount of cells, PDX samples and siRNA-treated REH cells were seeded at 100,000 cells/mL (3000 cells/well). PDX samples were thawed and cultured for 24 h at 37°C and 5% CO2 in StemSpan SFEM II (Stemcell Technologies, #09605) with added StemSpan CD34+ expansion supplement (Stemcell Technologies, #02691) before performing drug screens. Plates were incubated for 72 h and viability was determined by CellTiter-Glo Luminescent viability assay (Promega) using a Tecan SPARK 10 M reader. Most synergistic area scores (2 × 2 dose window) were determined using the zero interaction potency (ZIP) method using the SynergyFinder web application (version 3.0).29 A most synergistic area score above 5 was considered synergistic.
Statistical analysis
Statistical analysis of data was performed using GraphPad Prism version 9.5.1. The number (n) of replicates and statistical tests are indicated in the figure descriptions. Statistical significance was considered for p values: *p < 0.05, **p < 0.01, and ***p < 0.001.
Additional methods can be found in the Supporting Information.
RESULTS
H1-0 is upregulated in a preleukemic hiPSC model and BCP-ALL expressing ETV6::RUNX1
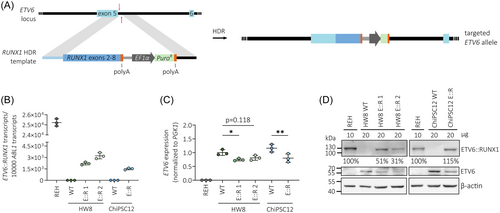
To analyze specific gene expression patterns of ETV6::RUNX1-translocated preleukemia in a model without additional secondary alterations, we generated monoclonal hiPSC lines derived from two donors: HW8 and ChiPSC12. We used a CRISPR/Cas9-mediated knock-in approach to directly fuse RUNX1 exons 2–8 to ETV6 exon 5 and to place the resulting fusion gene under the physiological control of the endogenous ETV6 promoter (Figure 1A). We confirmed correct sequence of the RUNX1 insert by genotyping PCR of the ETV6 locus (Figure S1A,B) and Sanger sequencing (Figure S1C). ETV6::RUNX1 levels in the hiPSC lines as detected by reverse transcription quantitative PCR (RT-qPCR) and Western blot were lower compared to the ETV6::RUNX1+ BCP-ALL cell line REH (Figure 1B). All hiPSC lines maintained typical hiPSC microscopic morphology and expression of the pluripotency markers SSEA-4, DNMT3B, GDF3, POU5F1, and NANOG as determined by flow cytometric analyses and RT-qPCR; chromosomal integrity was confirmed by karyotype analysis (Figure S2). All ETV6::RUNX1+ hiPSC lines harbored a monoallelic insertion of the RUNX1 HDR template at the ETV6 locus as detected by PCR, RT-qPCR, and Sanger sequencing (Figure S1D–G). Since the RUNX1 HDR template disrupts one ETV6 allele, expression of full-length ETV6 was lower in the CRISPR/Cas9-edited hiPSCs compared to the wild-type controls (Figure 1C,D). This aligns with the genetic profile of ETV6::RUNX1+ ALL patients who commonly exhibit heterozygosity for the fusion gene. Since ETV6 exon 6 is not retained in the ETV6::RUNX1 fusion gene, full-length ETV6 was detected using an RT-qPCR spanning exons 5 and 6 (Figure S1F). REH cells served as negative control due to the deletion of the remaining copy of ETV6 (Figure 1C,D).
To identify significantly dysregulated genes in ETV6::RUNX1+ preleukemic cells, we performed bulk RNA-seq of ETV6::RUNX1+ and wild-type hiPSCs. Principal component analysis (PCA) clearly separated samples according to genotype (Figure 2A). Altogether, we found consistent differential expression of 20 genes with an absolute fold change > 2 and p < 0.05 in the three ETV6::RUNX1+ hiPSC lines compared to the respective wild-type hiPSC lines (Figures 2B and S3 and Tables S2–S5). These genes remained significantly dysregulated using a harsher cut-off of false discovery rate (FDR)-adjusted p value (or q value) < 0.1 (Table S5). Among these genes, H1-0 has previously been identified as the most significantly upregulated gene in dormant leukemia stem cell-like cells.34 As a linker histone, H1-0 is involved in epigenetic regulation of chromatin and affects cellular differentiation states,27 making it a compelling candidate for further investigation. Elevated levels of H1-0 identified by RNA-seq in the ETV6::RUNX1+ hiPSCs were confirmed both by RT-qPCR (2.4-fold increased mean expression; Figure 2C) and Western blot (Figure 2D). Moreover, upregulation of H1-0 in ETV6::RUNX1+ preleukemic cells is preserved during the differentiation of hiPSCs along the B lymphoid lineage in a published RNA-seq dataset10 (Figure 2E).
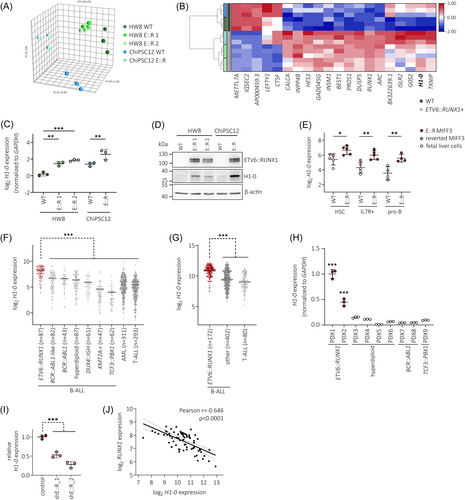
We previously found H1-0 expression to be restricted to ETV6::RUNX1+ bone marrow blasts compared to peripheral blood CD19+ cells,8 indicating that H1-0 upregulation is preserved upon leukemic transformation and highly specific for leukemic cells carrying the ETV6::RUNX1 fusion gene. To confirm this finding, we analyzed transcriptomic data derived from two patient cohorts encompassing a total of 1727 leukemia patient samples (PeCan St. Jude cohort30, 31 and GSE8707032). Additionally, we determined H1-0 expression in nine BCP-ALL PDX samples by RT-qPCR (n = 2 ETV6::RUNX1+, n = 4 high-hyperdiploid, n = 2 BCR::ABL1+, n = 1 TCF3::PBX1+). Notably, ETV6::RUNX1+ BCP-ALL showed significantly elevated H1-0 levels compared to other leukemia entities (Figure 2F–H). Moreover, H1-0 was downregulated upon ETV6::RUNX1 knockdown in published RNA-seq data11 of REH cells (p < 0.001, Figure 2I). In line with these observations, H1-0 expression closely anti-correlates with RUNX1 expression (Pearson r = −0.646, p < 0.0001, Figure 2J) in healthy bone marrow cells derived from the MILE study.33 Altogether, these data support an association of the ETV6::RUNX1 fusion gene and linker histone H1-0 expression.
ETV6::RUNX1 skews lineage commitment during early hematopoiesis
To delineate effects of ETV6::RUNX1 in hematopoietic cells, we performed in-depth characterization of hematopoietic progenitor cells (HPCs) differentiated from ETV6::RUNX1+ and wild-type hiPSCs. As confirmed by RT-qPCR, ETV6::RUNX1 expression in HPCs increased to levels comparable with REH cells (Figure 3A) and expression of common hiPSC pluripotency marker genes decreased during differentiation (Figure S4). To infer lineage-commitment of hiPSC progenitors, we carried out single-cell RNA-seq (scRNA-seq) and annotated our in vitro-derived HPCs using published reference data (Figure S5A–C). Overlaying our data with published scRNA-seq atlas data35 revealed that hiPSC-derived HPCs clustered closer to fetal liver compared to fetal bone marrow or cord blood-derived cells (Figure S5C). This finding is in keeping with other studies that showed similarity of hiPSC in vitro differentiation and early fetal hematopoiesis, for instance, in the fetal liver.10, 36 By mapping to fetal liver, fetal bone marrow and cord blood,35 as well as to adult bone marrow37 reference data, we identified three distinct trajectories of megakaryocyte, erythroid, and granulocyte/monocyte/dendritic cell (DC) progenitors in hiPSC-derived cells (Figure S5A,B). Comparable differentiation trajectories were observed by using a diffusion map representation of the data, which showed a central node of naïve cells and three branches of lineage-committed progenitors (Figure S5D). Of note, our data exhibited similar lineage commitment compared to a previous study that analyzed hiPSC-derived hematopoietic progenitors generated through embryoid body differentiation.36 Expression of cell type-specific marker genes confirmed commitment to megakaryocytes in Leiden clusters 0 and 2 (TUBB1, expression of additional marker genes shown in Figure S6), and commitment to granulocytes/monocytes/DCs in cluster 3 (CEBPA), while naïve progenitors in cluster 4 expressed CD34 and the early megakaryocytic-erythroid marker FCER1A (Figure 3B–C). Naïve progenitors in cluster 5 exhibited an intermediate expression profile of megakaryocyte and granulocyte/monocyte/DC marker genes. In line with previous work showing that megakaryocytic-erythroid lineage specification is governed by cell cycle speed,38 we observed that erythroid-committed cluster 1 was defined by differential expression of cell cycle regulators (Table S6 and Figure S5E), while megakaryocyte progenitors were annotated as non-cycling (Figure 3D).
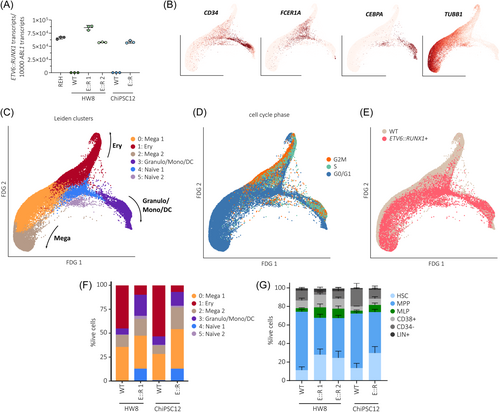
Classification of HPCs by genotype revealed that expression of ETV6::RUNX1 skewed commitment towards granulocyte/monocyte/DC progenitors and resulted in increased abundance of naïve progenitors (Figure 3E,F; cell numbers per cluster are shown in Table S7). Comparison of ETV6::RUNX1+ and wild-type cells within the annotated clusters identified the highest number of differentially expressed genes within the megakaryocyte- and erythrocyte-committed clusters (0–2; Figure S5F and Table S8). In keeping with reduced commitment to erythrocyte progenitors, cell cycle scoring showed accumulation of non-cycling G0/G1 cells in ETV6::RUNX1+ HPCs (FDR = 0.018, Figure S5G). Additionally, transcriptional diversity and activity was reduced in ETV6::RUNX1+ HPCs as indicated by lower number of expressed genes per cell (n_genes) and unique transcripts detected per cell (n_UMIs), respectively (Figure S5H,I).
Next, we performed immunophenotyping of hiPSC-derived HPCs using an antibody panel designed to identify hematopoietic progenitors in human bone marrow39 (gating strategy depicted in Figure S7). ETV6::RUNX1 expression led to increased numbers of phenotypic hematopoietic stem cells (HSC: CD34+LIN-CD38-CD90+CD45RA-, Figure 3G), in keeping with expansion of naïve progenitors observed by scRNA-seq (padj < 0.05; Table S9). Increased persistence of preleukemic ETV6::RUNX1+ HSCs has been reported previously.22, 40
The majority of HPCs were characterized as multipotent progenitors (MPP: LIN-CD34+CD38-CD90-CD45RA-) by flow cytometry, while scRNA-seq analysis revealed a large proportion of megakaryocyte- and erythrocyte-committed HPCs. This discordance between transcriptionally and immunophenotypically defined cell types underlines the strength of scRNA-seq for in-depth characterization of cellular states and detection of differentiation trajectories. Correlating protein and mRNA levels would require further analyses that combine proteome and transcriptome profiling on single-cell level, such as cellular indexing of transcriptomes and epitopes by sequencing (CITE-seq).
In colony forming assays, ETV6::RUNX1+ HPCs exclusively formed granulocyte-macrophage progenitor colonies (CFU-GM; Figure S8), while wild-type HPCs were also able to differentiate into common myeloid progenitor colonies (CFU-GEMM) and erythroid progenitors (BFU-E). This underlines the increased granulocyte/monocyte/DC lineage commitment that we observed in ETV6::RUNX1+ HPCs by scRNA-seq.
In summary, our preleukemic ETV6::RUNX1+ hiPSC model recapitulates the accumulation of phenotypic HSCs and exhibits increased commitment towards the granulocyte/monocyte/DC lineage during early hematopoiesis, as revealed by scRNA-seq analysis.
ETV6::RUNX1 induces H1-0 promoter activation
Given that our findings show strong association between ETV6::RUNX1 and H1-0 expression, we tested the potential of ETV6::RUNX1 to transactivate the H1-0 promoter. To this end, we cloned the H1-0 promoter region (−351 to +161 from TSS) into a luciferase reporter plasmid (Figure 4A), which was transfected into 293T cells along with either an empty vector or vectors containing FLAG-tagged ETV6::RUNX1 or RUNX1 sequences. Luciferase activity measurements confirmed that expression of ETV6::RUNX1 is sufficient to activate the H1-0 promoter (2.2-fold), while RUNX1 expression reduced luciferase activity (3.1-fold; Figure 4B). However, our previous analyses in murine cells8, 9 and analysis of the H1-0 promoter region using published chromatin immunoprecipitation sequencing (ChIP-seq) data of ETV6::RUNX1+ REH cells42, 43 did not show direct binding of either the fusion protein or RUNX1 to the H1-0 promoter region or distal enhancer regions upstream of H1-0 (Figure S9A), suggesting an indirect mechanism of H1-0 upregulation upon ETV6::RUNX1 expression.
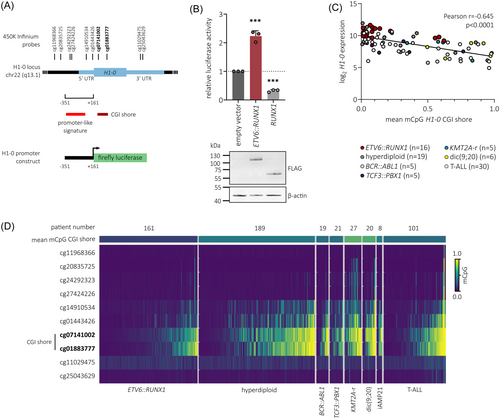
Additionally to transcriptional control via binding of transcription factors, differential DNA methylation of the H1-0 CpG island (CGI) shore has been reported to regulate H1-0 expression in various solid tumor types, acting as an enhancer element.27 Hence, we analyzed previously published 450K Infinium microarray DNA methylation data comprising patient samples of T-ALL and six B-ALL subtypes41 (n = 546). Indeed, the mean CGI shore methylation of H1-0, comprising probes cg07141002 and cg01883777, inversely correlated with H1-0 expression (Pearson r = −0.645, p < 0.0001; Figures 4C and S9B) and was lowest in ETV6::RUNX1+ BCP-ALL (Figure 4D), indicating that H1-0 expression is regulated via dynamic methylation of its CGI shore in leukemia. While the connection of ETV6::RUNX1 and H1-0 remains correlative, our data suggest that ETV6::RUNX1 induces upregulation of H1-0 in an indirect manner, possibly via the H1-0 promoter and CGI shore region.
H1-0 levels decrease during hematopoiesis
During hematopoiesis, H1-0 is expressed in undifferentiated, quiescent progenitor cells.44 To characterize H1-0 expression during B lymphopoiesis, we analyzed published RNA-seq data from adult and pediatric bone marrow,45 expression microarray data from umbilical cord blood and peripheral blood,46 and scRNA-seq data from fetal liver.47 Across these datasets, we observed a continuous decrease of H1-0 expression during B cell development (Figure 5A–C) and significant upregulation of H1-0 in ETV6::RUNX1+ ALL cells (n = 6) compared to HSCs and later B cell progenitor stages (Figure 5A).
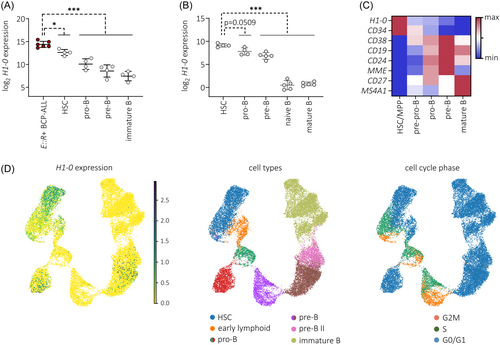
To examine H1-0 expression in the context of cell cycle activity and hematopoietic differentiation, we employed scRNA-seq data of B precursor cells derived from adult bone marrow.48 H1-0+ cell numbers decreased along the B lineage trajectory, clustering preferentially to G0/G1 cell cycle states, especially within the HSC, early lymphoid and pro-B populations (Figure 5D). Taken together, our data suggest that H1-0 is an indicator of differentiation state.
H1-0 is a key mediator of the ETV6::RUNX1-specific gene signature
To determine the contribution of H1-0 to ETV6::RUNX1+ BCP-ALL pathology, we knocked down H1-0 in the ETV6::RUNX1+ BCP-ALL cell line REH and performed gene set enrichment analysis (GSEA) on RNA-seq data. Knockdown reduced H1-0 RNA expression by ≈2.4-fold, translating to decreased protein levels compared to non-targeting siRNA (siCtrl) treatment (Figure 6A,B). Cell proliferation increased upon H1-0 knockdown (Figure 6C) along with a rise in apoptotic subG1 cells and reduced frequency of cells in G2/M (Figure 6D). GSEA using the canonical pathways collection (Human MSigDB Collections) revealed significant enrichment (cut-offs: p < 0.005, FDR q value of < 0.1) of gene signatures associated with DNA replication, histone modification, DNA repair and protein ubiquitination in siCtrl-treated REH cells (Figure 6E and Table S10), while no gene sets were identified as significantly enriched in REH cells treated with H1-0-targeting siRNA using the same cut-offs (Table S11). Notably, GSEA detected enrichment of gene sets linked to histone acetylation (Table S10 [in red]) in siCtrl-treated REH cells, consistent with previous reports highlighting strong correlation between H1-0 expression and chromatin acetylation.50, 51
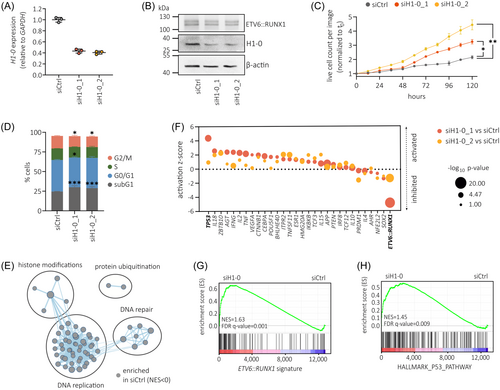
To ascertain common molecular drivers of gene expression changes observed upon H1-0 knockdown, we applied upstream regulator analysis using the Ingenuity Pathway Analysis (IPA) suite52 (Qiagen). Interestingly, the most significant potential driver detected by IPA upstream regulator analysis was ETV6::RUNX1, with p = 3.7 × 10⁻¹⁶ (for siH1-0_1 vs. siCtrl, Table S12) and p = 3.5 × 10⁻¹¹ (for siH1-0_2 vs. siCtrl, Table S13) respectively (Figure 6F). Negative activation z-scores indicated inhibition of the ETV6::RUNX1 transcription factor upon H1-0 knockdown. Given that ETV6::RUNX1 primarily functions as a repressor of RUNX1-regulated genes,53 we employed a set of genes downregulated by ETV6::RUNX1 (cut-offs: log2 fold change > 0.9 and p < 0.05)49 to validate our findings. Indeed, GSEA revealed significant upregulation of these ETV6::RUNX1 signature genes upon H1-0 knockdown (normalized enrichment score [NES] = 1.63, FDR q value = 0.001; Figure 6G and Figure S10A).
Furthermore, we detected significant activation of TP53 (encoding for the tumor suppressor p53) following H1-0 knockdown, as indicated by both upstream regulator analysis (Figure 6F) and GSEA (NES = 1.45, FDR q value = 0.009; Figure 6H). Indeed, previous studies have demonstrated that ETV6::RUNX1 suppresses p53 activity by upregulating MDM2.54 Accordingly, we detected downregulated MDM2 in REH cells upon H1-0 knockdown (Figure S10B). Moreover, both EPOR and RAG1, two genes upregulated by ETV6::RUNX1 and key factors in ETV6::RUNX1+ BCP-ALL pathophysiology,6, 42, 55, 56 exhibited reduced levels upon H1-0 knockdown (Figure S10B) as well as significant correlation with H1-0 RNA expression in ETV6::RUNX1+ BCP-ALL patient samples derived from the PeCan St. Jude cohort30, 31 (n = 87, Figure S10C). Taken together, these data imply that linker histone H1-0 is a novel key regulator of ETV6::RUNX1-induced expression changes.
H1-0 inducer Quisinostat synergizes with frontline drugs in ETV6::RUNX1+ leukemic cells
Due to their cytostatic activity, HDACis are potent inducers of H1-0 expression.50, 51 Importantly, H1-0 has been identified as a mediator of the antitumor effect induced by the pan-HDACi Quisinostat in various solid cancers.51 Hence, basal expression levels of H1-0 could be a marker for HDACi activity in BCP-ALL. Indeed, we found a striking inverse correlation between H1-0 protein levels and sensitivity towards HDACis in a panel of 25 BCP-ALL cell lines (data derived from the Functional Omics Resource of Acute Lymphoblastic Leukemia [FORALL] platform, https://proteomics.se/forall/57, 58), in particular with AR-42 and Vorinostat (p < 0.001), as well as 11 other HDACis, including Quisinostat (p < 0.01; Figure 7A). To examine the effect of H1-0 knockdown on Quisinostat sensitivity in ETV6::RUNX1+ BCP-ALL, REH cells were transduced with H1-0-targeting siRNA for 48 h and treated with Quisinostat (Figure S11A,B). While downregulation of H1-0 did not alter sensitivity towards single drug treatment with Quisinostat (Figure S11C), combination with the commonly used B-ALL chemotherapeutics Vincristine and Daunorubicin, or the proteasome inhibitor Bortezomib, increased drug synergism (Figure 7B).
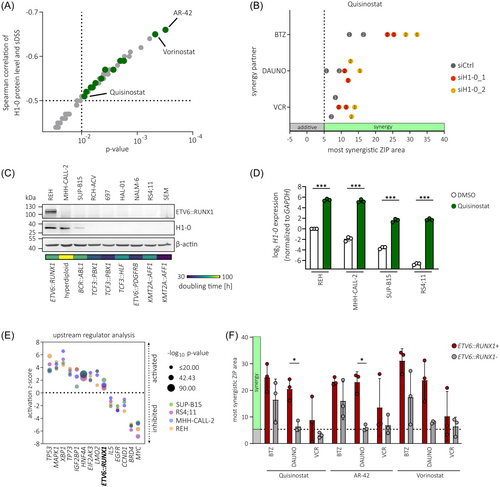
To confirm the H1-0-inducing properties of Quisinostat, we again performed H1-0 promoter luciferase assays in 293 T cells and treated with increasing sub-lethal concentrations of Quisinostat for 24 h. Indeed, Quisinostat induced H1-0 promoter activation (Figure S11D) and an increase of endogenous H1-0 levels (Figure S11E) in a dose-dependent manner. Moreover, BCP-ALL cell lines with varying levels of basal H1-0 expression (high levels: REH and MHH-CALL-2, medium level: SUP-B15, low level: RS4;11) strongly upregulated H1-0 upon treatment with 1 µM Quisinostat for 24 h (Figure 7C,D). As anticipated, basal H1-0 levels reflected doubling times of BCP-ALL cell lines (Figure 7C) and REH cells were most resistant to Quisinostat treatment, as indicated by lowest fraction of subG1 cells after 24-hour Quisinostat treatment (Figure S11F). Transcriptome analysis revealed a drug-induced shift in all four BCP-ALL cell lines and dysregulation of similar signaling pathways (Figure S11G–I and Tables S14–S17). These include inhibition of MYC59, 60 and BRD4,61 as described previously, as well as the activation of TP53 signaling due to induction of apoptosis (Figure 7E). Interestingly, the ETV6::RUNX1 signature was activated upon Quisinostat treatment, indicating a connection of histone acetylation and ETV6::RUNX1 target gene transcription, that has also been proposed previously.20
We further performed synergy drug screens with Quisinostat, as well as AR-42 and Vorinostat, the two HDACis that showed highest anti-correlation with H1-0 protein levels (Figure 7A). For this, we screened three ETV6::RUNX1- BCP-ALL cell lines (MHH-CALL-2, SUP-B15, and RS4;11) and the ETV6::RUNX1+ cell line REH as well as two ETV6::RUNX1+ PDX samples (Figures 7F and S12). Overall, simultaneous inhibition of HDACs and the proteasome showed high synergy. Clinical efficacy of combination treatment with Bortezomib and HDACis has been shown in previous studies targeting hematologic malignancies.62 Moreover, we found high synergy in ETV6::RUNX1+ samples using HDACis in combination with the topoisomerase II inhibitor Daunorubicin, while there was no or low synergy in ETV6::RUNX1− samples using this combination. Of note, Quisinostat induced effective killing in BCP-ALL cell lines at much lower concentration range (0.2–10 nM) than AR-42 (10–1000 nM) or Vorinostat (100–5000 nM; Tables S18S–20). Taken together, these analyses indicate that combinatorial drug treatment using Quisinostat in combination with Daunorubicin or Bortezomib might be beneficial for targeting ETV6::RUNX1+ leukemic cells.
DISCUSSION
In this study, we established preleukemic ETV6::RUNX1+ knock-in hiPSC models derived from two donors. Transcriptome analysis of these models revealed that ETV6::RUNX1 expression upregulates H1-0, a variant of the H1 linker histone family that promotes chromatin compaction.26, 63 We demonstrate that H1-0 regulates cellular quiescence and significantly contributes to the repressive expression signature conferred by ETV6::RUNX1. Moreover, we found that H1-0 downregulation increased drug synergism of the HDACi Quisinostat with common B-ALL chemotherapeutics.
High H1-0 levels observed in HSCs are in line with the largely quiescent nature of these cells.44 The progressive decrease of H1-0 levels during hematopoiesis supports the notion that H1-0 accumulates in quiescent cells that have high proliferative capacity.27, 34 Increased quiescence of ETV6::RUNX1+ preleukemic cells is in keeping with our previous detection of these cells in cord blood of approximately 5% of healthy newborns,2 offering a potential explanation for prolonged latency periods of ETV6::RUNX1+ leukemia, which can extend up to 14 years.64
The relationship between ETV6::RUNX1 and H1-0 remains correlative, and further studies are needed to explore the role of chromatin compaction and histone acetylation in BCP-ALL development, as well as the impact of H1-0 during hematopoietic differentiation, to establish a clearer connection. Interestingly, increased H1-0 levels were also observed in leukemic BCP-ALL patient samples, suggesting retention of chromatin compaction throughout ETV6::RUNX1+ BCP-ALL development. This is consistent with a recent report of reduced global chromatin accessibility in ETV6::RUNX1+ BCP-ALL compared to other ALL subtypes.65 Similar loss of chromatin accessibility and cell cycle arrest has been detected in myeloid progenitors harboring the RUNX1::ETO translocation that retains the DNA-binding RHD, allowing it to bind to RUNX1 target sites.66
Aberrant co-expression of myeloid genes has been previously identified in preleukemic ETV6::RUNX1+ pro-B cells10 and we show here that early hematopoiesis of ETV6::RUNX1+ hiPSCs is skewed towards myeloid lineage precursors, specifically towards granulocyte/monocyte/DC commitment. It is conceivable that this myeloid bias induced by ETV6::RUNX1 impedes B lineage commitment, highlighting the need for second hit mutations for the expansion of B lineage cells. In future studies, our model could be used to study the effect of common secondary mutations (such as deletions of PAX5, CDKN2A, or the second ETV6 allele) on BCP-ALL development.
The H1-0 inducer Quisinostat has demonstrated high potency and bioavailability at low nanomolar concentrations,67, 68 while preserving normal stem cell function.51, 69, 70 However, the predominantly cytostatic activity of HDACis in vivo suggests that single-drug treatment is not sufficient to induce cancer remission. Using leukemic cell lines and PDX models, we show here that combinatorial treatment using the pan-HDACi Quisinostat is a promising approach to enhance treatment of ETV6::RUNX1+ BCP-ALL when administered alongside Daunorubicin or Bortezomib. Indeed, combination of Bortezomib with Quisinostat showed favorable treatment outcomes in a multiple myeloma mouse model,71 and a previous study also reported efficacy of other pan-HDACis used in combination with Bortezomib in preclinical B-ALL models, particularly in relapsed ALL.72 While the majority of ETV6::RUNX1+ BCP-ALL patients responds well to current treatment protocols, relapse still occurs in approximately 5% of patients.7 Upon relapse, combination therapy with Quisinostat may serve as an alternative treatment option, especially in patients who fail to respond to bispecific antibodies such as Blinatumomab (CD19/CD3).
In conclusion, our data demonstrate that H1-0 contributes to quiescence of ETV6::RUNX1+ cells. Unraveling mechanisms involved in quiescence of ETV6::RUNX1+ preleukemic cells may offer new opportunities for enhancing patient treatment.
ACKNOWLEDGMENTS
The authors thank Judith Bartel at the Institute of Human Genetics (Hannover Medical School [MHH], Germany) for performing karyotype analyses of hiPSC lines. Computational infrastructure and support were provided by the Centre for Information and Media Technology (ZIM) at Heinrich Heine University Düsseldorf (Germany). Open Access funding enabled and organized by Projekt DEAL.
AUTHOR CONTRIBUTIONS
Vera H. Jepsen: Conceptualization; investigation; data curation; validation; methodology; formal analysis; visualization; writing—original draft; writing—review and editing. Andrea Hanel: Formal analysis; software; methodology; writing—review and editing. Daniel Picard: Formal analysis; software. Rigveda Bhave: Investigation; methodology; resources. Rebecca Hasselmann: Investigation; formal analysis; visualization; writing—review and editing. Juha Mehtonen: Formal analysis. Julian Schliehe-Diecks: Investigation; formal analysis; methodology. Carla-Johanna Kath: Investigation; methodology. Vithusan Suppiyar: Formal analysis; software. Yash Prasad: Formal analysis; software. Katerina Schaal: Investigation. Jia-Wey Tu: Investigation. Nadine Rüchel: Resources. Ersen Kameri: Resources. Nan Qin: Resources. Herui Wang: Resources. Zhengping Zhuang: Resources. Rabea Wagener: Data curation; formal analysis. Lena Blümel: Resources. Tobias Lautwein: Formal analysis; software. Daniel Hein: Supervision; funding acquisition; conceptualization. David Koppstein: Supervision; resources. Gesine Kögler: Resources. Marc Remke: Resources. Sanil Bhatia: Supervision; resources; writing—review and editing. Merja Heinäniemi: Supervision; writing—review and editing. Arndt Borkhardt: Funding acquisition; supervision; writing—review and editing. Ute Fischer: Funding acquisition; conceptualization; supervision; writing—review and editing.
CONFLICT OF INTEREST STATEMENT
The authors declare no conflict of interest.
FUNDING
This work was funded by the German Research Foundation (DFG, 495318549, GRK2578: 417677437), German Cancer Aid (Deutsche Krebshilfe, 70114736), Deutsche José-Carreras Leukämie-Stiftung (DJCLS, 18R/2021), Deutsche Kinderkrebsstiftung (DKKS, A2023/31), the German Ministry for Education and Research (BMBF, 01KD2410A (EDI-4-ALL)), the German Federal Office for Radiation Protection (BfS, 3622S32231), the Parents' initiative Löwenstern e.V., and the Katharina Hardt-Stiftung.
Open Research
DATA AVAILABILITY STATEMENT
-
RNA-seq data: Gene Expression Omnibus GSE270944 and GSE283119.
-
scRNA-seq data: Gene Expression Omnibus GSE270945.


