Results of the prospective EORTC Children Leukemia Group study 58081 in precursor B- and T-cell acute lymphoblastic leukemia
These results were presented in part at the Annual Meeting of the European Hematology Association in June 2021 (abstract # EHA-1783).
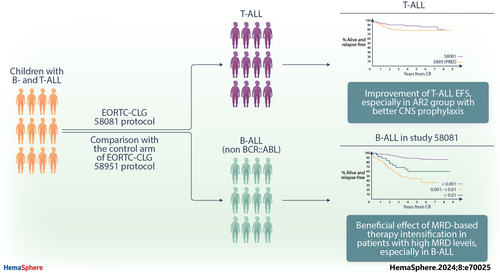
Graphical Abstract
Abstract
Here, we report the results of the prospective cohort study EORTC-CLG 58081 and compare them to the control arm of the randomized phase 3 trial EORTC-CLG 58951, on which treatment recommendations were built. In both studies, patients aged 1–18 years with BCR::ABL1 negative acute lymphoblastic leukemia of the B-lineage (B-ALL) or T-lineage (T-ALL) were treated using a BFM backbone without cranial irradiation. Similarly to the control arm of 58951, prednisolone (PRED) 60 mg/m2/day was used for induction therapy, but a few modifications were made. Dexamethasone (DXM) was used in average-risk 2 (AR2) T-ALL and B-ALL during induction, 10 and 6 mg/m2/day, respectively. Leucovorin rescue was delayed to 42 h instead of 36 h after initiation of high-dose methotrexate, and a postconsolidation MRD time point was added to stratify patients. Between 2011 and 2017, 835 patients were prospectively enrolled in the 58081 study. Overall, the 5-year event-free survival (EFS) was 84.8% versus 83.6% (hazard ratio [HR], 0.96 [95% confidence interval [CI]: 0.76–1.21]) for 58081 versus 58951 considered as a control group, respectively, 84.3% versus 84.9% (HR, 1.06 [99% CI: 0.75–1.49]) in B-ALL but 87.3% versus 76.6% (HR, 0.59 [99% CI: 0.28–1.24]) in T-ALL. The comparison between the two studies regarding EFS differed by risk group (p = 0.012). The HR was 2.15 (99% CI: 0.67–6.85) for very low-risk but 0.34 (99% CI: 0.13–0.89) for AR2. The particularly favorable results observed in the T-ALLs and AR2 subgroups suggest the benefit of using DXM in specific patient groups and highlight the importance of risk stratification.
INTRODUCTION
Acute lymphoblastic leukemia (ALL) is the most frequent cancer in children.1 Remarkable progress has been made in treatment, with better risk stratification of patients based on clinical, biological, and genetic features, and implementation of minimal residual disease (MRD) monitoring for risk assessment.2-6 These advances have resulted in a striking improvement of outcomes in developed countries over the past 30 years, with 5-year overall survival (OS) rates close to or higher than 85% for B-ALL in most recent trials.7 However, T-ALL outcome remains inferior to B-ALL, with an average 5-year OS of 80%, despite the frequent use of cranial irradiation.8
Our previous study, the EORTC 58951 trial (1998–2008), comparing dexamethasone (DXM) 6 mg/m²/day with prednisolone (PRED) 60 mg/m²/day during induction, provided no evidence that DXM was more effective than PRED in the whole population.9 However, in the average risk group 2 (AR2) (i.e., non, very high-risk [VHR] T-ALL patients, or B-ALL patients with a white blood cell count [WBC] greater than 100 × 109/L and/or central nervous system [CNS] 2 status), the use of DXM was possibly associated with prolonged event-free survival (EFS) (hazard ratio [HR], 0.76) and a decreased incidence of CNS relapse. However, in the entire T-ALL patient population, no EFS improvement was noticed (HR, 1.26) in the DXM arm compared to the PRED. Interestingly, the AIEOP-BFM group later reported improved survival for T-ALL patients treated with DXM 10 mg/m2/day versus PRED 60 mg/m2/day, but it also had a higher toxicity.10
Taking these findings into account, in the EORTC 58081 study, all patients were treated with PRED, but those with B- and T-ALL in the AR2 group, received DXM 6 and 10 mg/m2/day, respectively. In addition, the MRD-based risk stratification was slightly modified with the introduction of a second-time point. Intrathecal treatment was intensified in patients with CNS-2 and CNS-3 status,11 and the post-high-dose methotrexate (MTX, 5 g/m2) leucovorin rescue was delayed to 42 h instead of 36 h after initiation of high-dose MTX.
Here, we report the outcome of patients enrolled in the EORTC 58081 study. We compared these results, overall and by predefined subgroups, with those obtained for the PRED arm of the previous EORTC 58951 study, which had similar eligibility criteria to the 58081 study.9 In addition, we have evaluated the prognostic importance of the MRD level at the end of induction in the EORTC 58081 study.
PATIENTS AND METHODS
Patients
The EORTC 58081 study was a prospective observational study, in which children newly diagnosed with ALL in the EORTC Children Leukemia Group (EORTC-CLG) centers in France and Belgium were enrolled between 2011 and 2017. The objective was to investigate new prognostic factors to guide risk stratification for B- and T-ALL. Inclusion criteria and treating centers remained unchanged from the previous 58951 study. Patients under 18 and above 1 year of age with previously untreated ALL were eligible for the 58081 study. Patients who had been treated with corticosteroids for more than 7 days and patients with a FAB-L3 ALL morphology or BCR::ABL1-positive ALL (treated according to the EsPhALL protocol) were excluded. Diagnosis of ALL was based on cytomorphological, immunophenotypic, and genetic criteria. Retrospective inclusion was due to the temporary closure of the trial pending approval of its extension. Patients treated during this period (n = 176) could be enrolled retrospectively but were not included in the final analyses to avoid potential selection bias in retrospectively enrolling patients with early events (Supporting Information S1: Figure 1).
Informed consent from the parents or the legal guardian was provided before entry into the study according to the Declaration of Helsinki. The protocol was approved by the EORTC Protocol Review Committee and by the local institutional ethical committees.
Patients were assigned to different risk groups: very low risk (VLR), average risk (AR), and very high risk (VHR). VLR was defined as B-ALL with all of the following characteristics: no VHR features, WBC counts below 10 × 109/L at diagnosis, hyperdiploid karyotype (51-66 chromosomes) or DNA index >1.16 and <1.5, and the absence of CNS (i.e., CNS-1 was required) and gonadal involvement. Patients were classified as VHR if they had at least one of the following characteristics: blast count in peripheral blood ≥1 × 10⁹/L at completion of the prephase (Day 8), presence of a KMT2A rearrangement, near-haploidy or hypodiploidy, acute undifferentiated leukemia, MRD ≥10−2 at completion of induction (IA, Day 35, TP1), MRD ≥10−3 at completion of consolidation (IB, TP2), failure to achieve complete remission (CR) or T-ALL with CNS-3. AR group included non-VLR and non-VHR stratified patients. B-ALL patients with WBC <100 × 109/L and no gonadal or CNS involvement were AR1. B-ALL patients with WBC ≥100 × 109/L and/or CNS-3 or CNS-2 status at diagnosis and without VHR criteria were considered as AR2. B-ALL patients with CNS-2 were allocated to the AR2 group in the 58081 study, which was not the case in the 58951 study. All T-ALL patients without CNS-3 involvement and without VHR characteristics were classified as AR2. There was no difference in risk stratification between the two studies for T-ALL patients treated in the AR2 group based on CNS-1 and CNS-2 involvement.
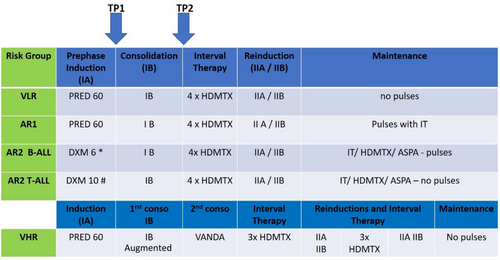
The treatment was based on a BFM backbone, without cranial or local irradiation. The general scheme is shown in Figure 1, and the protocol is described in Supporting Information S1: Tables S1-S3. As compared to the PRED arm from the 58951 trial,9, 12, 13 the following adaptations were applied in the EORTC 58081 protocol: increase of the DXM dose to 10 mg/m2/day during induction and late intensification phase (=reinduction phase, IIA) for AR2 T-ALL patients, the stratification of the T-ALL CNS3 in the VHR group, the use of DXM 6 mg/m²/day in induction for AR2 B-ALL patients, and the start of leucovorin rescue at 42 instead of 36 hours from the initiation of high-dose methotrexate. As in the 58951 protocol, patients with a CNS-2 or CNS-3 involvement underwent intrathecal treatment intensification. The VLR group received 10 simple intrathecal (IT) therapies (methotrexate), whereas the AR and VHR groups received 16 and 17 triple IT therapies, respectively. Patients in the AR2 subgroup received HD MTX in maintenance to reduce the CNS relapse incidence, instead of radiotherapy, no longer used in EORTC CLG protocols. All VHR patients were eligible for hematopoietic stem cell transplantation with the exception of those who were classified as VHR only because of a “poor prednisone response” on Day 8 of prephase but who were good MRD responders, which was the same as in the 58951 trial.
Definitions
CNS disease was graded according to the classification proposed by Pui.14 Briefly, CNS-1 was defined by a WBC count <5/µL and cytospin negative, CNS-3 as a WBC count >5/µL and cytospin positive, and CNS-2 as a WBC count ≤5/µL and cytospin positive. CR was defined as a disappearance of all symptoms, physical and radiological signs related to leukemia, in combination with fewer than 5% leukemic cells in the bone marrow with signs of recovering hematopoiesis and absence of blasts in the cerebrospinal fluid (CSF). Relapse was defined as the reappearance of more than 20% of leukemic cells in the bone marrow or of any leukemic cell at any extramedullary site. EFS was defined for patients who achieved CR during the induction or consolidation phase as the time from the first CR to the first relapse or death, whichever occurred first. The second malignant neoplasm was not considered an event in the EFS analysis. For patients who did not achieve CR during induction or consolidation, the duration of EFS was assumed to be 0. OS was defined as the time from treatment start to the date of death, whatever the cause. Disease-free survival (DFS) was defined as the time from the first CR achieved during the induction or the consolidation therapy to relapse or death, whichever occurred first. Time to relapse was defined as the time from the date of the first CR achieved in the induction or consolidation phase to the date of the first relapse. Time to death without relapse was defined as the time from the date of the first CR achieved in the induction or consolidation phase to the date of death in the first CR.
MRD evaluation
Quantitative evaluation of MRD was performed on DNA obtained from bone marrow (BM) mononucleated cells. The assay was performed by allele-specific real-time PCR with TaqMan detection (ASO-PCR) using clono-specific rearrangements of the immunoglobulin and T-cell receptor genes (IG/TCR). ASO-PCR was performed and interpreted according to EuroMRD guidelines.15 MRD results were centrally reviewed.
MRD was measured at two-time points: TP1 at the end of induction (phase IA) (Day 35) and TP2 at the end of consolidation (phase IB) (Figure 1). If MRD was ≥10−2 at TP1 or ≥10−3 at TP2, patients initially categorized as VLR, AR1, or AR2 were switched to the VHR group. If no valid MRD was available by PCR, it was replaced by flow cytometry.
Statistical analysis
EFS, DFS, and OS were estimated using the Kaplan–Meier technique.16 The confidence intervals (CI) were constructed using the normal approximation of the distribution of log(-log(survival)) and the Greenwood formula.17 The log-rank test was used for comparisons of these endpoints between groups. The cumulative incidence of relapse (CIR) and death without relapse were estimated using the Aalen-Johansen estimator.18 The CIs were constructed using the normal approximation of the distribution of log(-log(cumulative incidence)) and the Aalen variance estimator.19 Cox model was used to estimate the hazard ratios for EFS, DFS, and OS.20 The presence of effect modification was investigated by testing the interaction in a Cox model, including two covariates of interest and the interaction term. The Fine and Gray model was used to compare cumulative incidences.21 The date of the last visit was used to calculate the censoring time. In the analyses of relapse, death without relapse was treated as a competing event. In the analyses of death without relapse, relapse was treated as a competing event. In order to make the duration of the follow-up more comparable between the two cohorts, patients from the 58951 trial with a follow-up duration longer than the maximum follow-up duration in the 58081 study were censored at this maximum follow-up duration. The analysis was performed in SAS version 9.4.
RESULTS
Patient characteristics
From June 2011 to June 2017, 835 patients were eligible and prospectively enrolled in the EORTC 58081 study. This cohort is hereafter referred to as Study 58081. The PRED arm of the 58951 trial, hereafter referred to as Study 58951PRED included 951 BCR::ABL1-negative patients from December 1998 to August 2008. The distribution of patients and disease characteristics was similar between the two cohorts, except for a higher proportion of NCI high-risk T-ALL in Study 58081 (Table 1). CNS-3 rates were similar in both cohorts. However, more patients were considered to have CNS-2 in Study 58081 (which may be due to improvements in the sensitivity of cytologic techniques over time with staining technique change). This was true for B-ALL and even more so for T-ALL, where there were almost 5 times more patients with CNS-2 in Study 58081 than in Study 58951PRED (Table 1). In Study 58081, 75 (9.0%) patients were allocated to the VLR, 511 (61.2%) to the AR1, 121 (14.5%, 48 B-ALL and 73 T-ALL) to the AR2 and 128 (15.3%, 61 B-ALL and 67 T-ALL) to the VHR group after the prephase. The risk group distribution of patients was similar between the two cohorts for the AR groups (AR1, AR2), whereas the more strictly defined VLR group of Study 58081 contained fewer patients (9.0 vs. 12.6%) while the VHR group contained a larger proportion of patients (15.3% vs. 10.2%) than in Study 58951PRED (Table 1). This increase was particularly apparent for patients with T-ALL, with 67 (47.9%) VHR patients versus only 51 (34.7%) in study 58951 (Table 1). Supporting Information S1: Table 4 provides the group stratifications after TP1 and TP2 determination. The number of patients in the VHR group increased from 128 (15.3%) after prephase to 153 (18.3%) after TP2 in Study 58081, the switch typically occurring from the AR1 group. Furthermore, Supporting Information S1: Table 5 resumes the EORTC risk group after prephase according to the ETV6::RUNX1 translocation.
| 58081 | 58951PRED | |||||
|---|---|---|---|---|---|---|
B-ALL (N = 695) N (%) |
T-ALL (N = 140) N (%) |
All patients (N = 835) N (%) |
B-ALL (N = 803) N (%) |
T-ALL (N = 148) N (%) |
All patients (N = 951) N (%) |
|
| Sex | ||||||
| Boy | 366 (52.7) | 101 (72.1) | 467 (55.9) | 418 (52.1) | 105 (70.9) | 523 (55.0) |
| Girl | 329 (47.3) | 39 (27.9) | 368 (44.1) | 385 (47.9) | 43 (29.1) | 428 (45.0) |
| Age (years) | ||||||
| <5 | 382 (55.0) | 24 (17.1) | 406 (48.6) | 392 (48.8) | 28 (18.9) | 420 (44.2) |
| 5–9 | 160 (23.0) | 56 (40.0) | 216 (25.9) | 231 (28.8) | 67 (45.3) | 298 (31.3) |
| ≥10 | 153 (22.0) | 60 (42.9) | 213 (25.5) | 180 (22.4) | 53 (35.8) | 233 (24.5) |
| WBC (×109/L) | ||||||
| <10 | 392 (56.4) | 18 (12.9) | 410 (49.1) | 460 (57.3) | 23 (15.5) | 483 (50.8) |
| 10–<50 | 218 (31.4) | 34 (24.3) | 252 (30.2) | 250 (31.1) | 56 (37.8) | 306 (32.2) |
| 50–<100 | 51 (7.3) | 22 (15.7) | 73 (8.7) | 48 (6.0) | 20 (13.5) | 68 (7.2) |
| ≥100 | 34 (4.9) | 65 (46.4) | 99 (11.9) | 45 (5.6) | 49 (33.1) | 94 (9.9) |
| Missing | 0 (0.0) | 1 (0.7) | 1 (0.1) | 0 (0.0) | 0 (0.0) | 0 (0.0) |
| NCI risk group | ||||||
| Standard risk | 477 (68.6) | 28 (20.0) | 505 (60.5) | 543 (67.6) | 47 (31.8) | 590 (62.0) |
| High risk | 218 (31.4) | 111 (79.3) | 329 (39.4) | 260 (32.4) | 101 (68.2) | 361 (38.0) |
| Missing | 0 (0.0) | 1 (0.7) | 1 (0.1) | 0 (0.0) | 0 (0.0) | 0 (0.0) |
| CSF status | ||||||
| CNS-1 | 602 (86.6) | 97 (69.3) | 699 (83.7) | 748 (93.2) | 130 (87.8) | 878 (92.3) |
| CNS-2 | 81 (11.7) | 35 (25.0) | 116 (13.9) | 43 (5.4) | 8 (5.4) | 51 (5.4) |
| CNS-3 | 12 (1.7) | 8 (5.7) | 20 (2.4) | 9 (1.1) | 7 (4.7) | 16 (1.7) |
| Missing | 0 (0.0) | 0 (0.0) | 0 (0.0) | 3 (0.4) | 3 (2.0) | 6 (0.6) |
| Response to prephase (Day 8 blasts/μL) | ||||||
| ≥1000 | 37 (5.3) | 52 (37.1) | 89 (10.7) | 37 (4.6) | 48 (32.4) | 85 (8.9) |
| <1000 | 651 (93.7) | 87 (62.1) | 738 (88.4) | 766 (95.4) | 99 (66.9) | 865 (91.0) |
| Missing | 7 (1.0) | 1 (0.7) | 8 (1.0) | 1 (0.7) | 1 (0.7) | 1 (0.1) |
| Hypodiploidy or near haploidy | ||||||
| Absent | 541 (77.8) | 112 (80.0) | 653 (78.2) | 780 (97.1) | 143 (96.6) | 923 (97.1) |
| Present | 6 (0.9) | 0 (0) | 6 (0.7) | 6 (0.7) | 0 (0) | 6 (0.6) |
| Missing | 148 (21.3) | 28 (20.0) | 176 (21.1) | 17 (2.1) | 5 (3.4) | 22 (2.3) |
| KMT2A rearrangement | ||||||
| Absent | 544 (78.3) | 104 (74.3) | 648 (77.6) | 694 (86.4) | 138 (93.2) | 832 (87.5) |
| Present | 13 (1.9) | 5 (3.6) | 18 (2.2) | 16 (2.0) | 3 (2.0) | 19 (2.0) |
| Missing | 138 (19.9) | 31 (22.1) | 169 (20.2) | 93 (11.6) | 7 (4.7) | 100 (10.5) |
| EORTC risk groupa | ||||||
| Very low risk | 75 (10.8) | 0 (0.0) | 75 (9.0) | 120 (14.9) | 0 (0.0) | 120 (12.6) |
| Average risk 1 | 511 (73.5) | 0 (0.0) | 511 (61.2) | 581 (72.4) | 2 (1.4) | 583 (61.3) |
| Average risk 2 | 48 (6.9) | 73 (52.1) | 121 (14.5) | 56 (7.0) | 94 (63.5) | 150 (15.8) |
| Very high risk | 61 (8.8) | 67 (47.9) | 128 (15.3) | 46 (5.7) | 51 (34.5) | 97 (10.2) |
| Missing | 0 (0.0) | 0 (0.0) | 0 (0.0) | 0 (0.0) | 1 (0.7) | 1 (0.1) |
- Abbreviations: CNS, central nervous system; CSF, cerebrospinal fluid; NCI, National Cancer Institute; WBC, white blood cells.
- a After prephase.
Thirty-seven (4.4%) patients were transplanted in the first CR in Study 58081, which was roughly similar to Study 58951PRED (3.4%). In Study 58081, 237 (28.4%) Belgium patients received the pegylated form of Escherichia coli asparaginase from January 2013 onwards, and 598 (71.6%) patients, including those who started their treatment in Belgium before January 2013 or those who were treated in France and Portugal received the native E. coli asparaginase for reimbursement reasons.
Overall outcome
Median follow-up was 5.5 years (interquartile range [IQR] 4.0–6.6 years) in Study 58081 and 7.0 years (IQR 5.0–8.9 years) in Study 58951PRED.
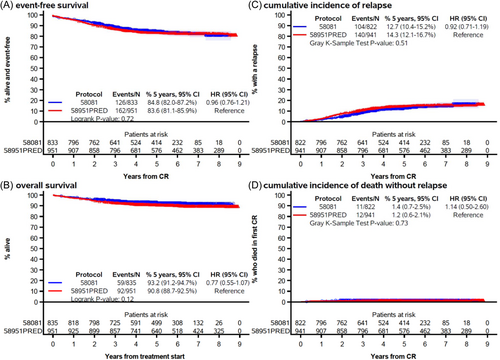
In Study 58081, EFS and response were analyzed among 833 out of 835 patients for whom response data were available (Supporting Information S1: Figure 1). Among these 833 patients, 11 (1.3%) did not achieve CR (Table 2). The 5-year EFS and OS rates were 84.8% (95% CI: 82.0%–87.2%) and 93.2% (95% CI: 91.2%–94.7%), respectively (Figure 2). The 5-year CIR and cumulative incidence of death without relapse were 12.7% (95% CI: 10.4%–15.2%) and 1.4% (95% CI: 0.7%–2.5%), respectively. Overall, these results were similar to those obtained in Study 58951PRED.
| 58081 | 58951PRED | |||||
|---|---|---|---|---|---|---|
B-ALL (N = 695) |
T-ALL (N = 140) |
All patients (N = 835) |
B-ALL (N = 803) |
T-ALL (N = 148) |
All patients (N = 951) |
|
| N (%) | N (%) | N (%) | N (%) | N (%) | N (%) | |
| MRD evaluation at TP1 | ||||||
| Patients with available information | 667 (96.0) | 129 (92.1) | 796 (95.3) | 696 (86.7) | 118 (79.7) | 814 (85.6) |
| ≥10−2 | 29 (4.3) | 26 (20.2) | 55 (6.9) | 23 (3.3) | 17 (14.4) | 40 (4.9) |
| MRD evaluation at TP2 | ||||||
| Patients with available information | 631 (90.8) | 119 (85.0) | 750 (89.8) | NA | NA | NA |
| ≥10−3 | 22 (3.5) | 8 (6.7) | 30 (4.0) | |||
| Outcome after induction/consolidation | ||||||
| Patients with available information | 693 (99.7) | 140 (100.0) | 833 (99.8) | 803 (100.0) | 148 (100.0) | 951 (100.0) |
| No CR | 7 (1.0) | 4 (2.9) | 11 (1.3) | 7 (0.9) | 3 (2.0) | 10 (1.1) |
| Relapse | 90 (13.0) | 14 (10.0) | 104 (12.5) | 111 (13.8) | 29 (19.6) | 140 (14.7) |
| Isolated bone marrow relapse | 63 (9.1) | 6 (4.3) | 69 (8.3) | 69 (8.6) | 11 (7.4) | 80 (8.4) |
| Isolated CNS relapse | 4 (0.6) | 3 (2.1) | 7 (0.8) | 10 (1.2) | 8 (5.4) | 18 (1.9) |
| Combined CNS-positive relapse | 9 (1.3) | 3 (2.1) | 12 (1.4) | 17 (2.1) | 6 (4.1) | 23 (2.4) |
| Other | 14 (2.0) | 2 (1.4) | 16 (1.9) | 15 (1.9) | 4 (2.7) | 19 (2.0) |
| Death without relapse | 10 (1.4) | 1 (0.7) | 11 (1.3) | 10 (1.2) | 2 (1.4) | 12 (1.3) |
| Alive in first CR | 586 (84.6) | 121 (86.4) | 707 (84.9) | 675 (84.1) | 114 (77.0) | 789 (83.0) |
- Abbreviations: CNS, central nervous system; CR, complete remission; MRD, minimal residual disease evaluated by Ig-TCR techniques; NA, not applicable; TP, time point.
Outcome by EORTC risk group
In Study 58081, the estimated EFS at 5 years varied according to the risk group (Figure 3). While patients in the VHR group had the worst EFS (73.5%), the best EFS (93.0%) was observed in patients in the AR2 group.
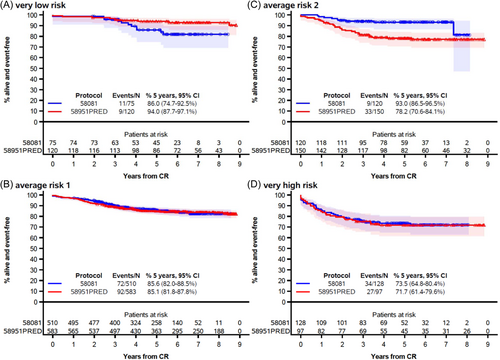
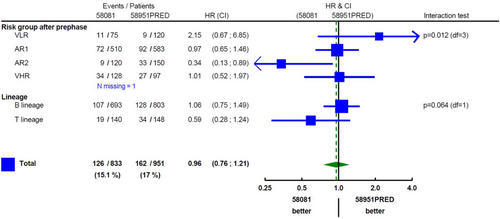
The interaction test showed that there was a difference in EFS by risk group depending on the study (p = 0.012; Figure 4). The EFS of patients in the VHR and AR1 groups remained unchanged. In contrast, the VLR patients tended to have a poorer outcome in Study 58081 as compared with Study 58951PRED (HR = 2.15 [99% CI: 0.67–6.85], 5-year EFS: 86.0% [95% CI: 74.7–92.5%] vs. 94.0% [95% CI: 87.7%–97.1%]). In Study 58081, the 11 events observed in VLR patients consisted of one death in induction (invasive mucormycosis) and 10 relapses (including seven isolated BM relapses and one CNS relapse). None had an IKZF1 deletion and all had a modal number ≥55 at karyotype. However, MRD at TP1 was ≥10−2 for 1 patient (subsequently switched to the VHR group), and between 10−2 and 10−3 for three patients. Notably, the lower EFS in VLR patients from Study 58081 did not translate into a lower OS (at 5 years: 98.7% [95% CI: 90.9%–99.8%] vs. 97.4% [95% CI: 92.1%–99.2%] in Study 58951PRED; Supporting Information S1: Figure 2). On the other hand, patients stratified into the AR2 group had a higher EFS in study 58081 than in study 58951PRED (HR = 0.34 [99% CI: 0.13–0.89], at 5 years: 93.0% [95% CI: 86.5%–96.5%] vs. 78.2% [95% CI: 70.6%–84.1%]). Improved EFS in AR2 patients was due to a dramatic decrease in relapse incidence in Study 58081 (at 5 years: 5.3% [95% CI: 2.1%–10.6%] vs. 20.8% [95% CI: 14.5%–27.8%]) (Supporting Information S1: Figure 3). Only 7 AR2 patients relapsed in Study 58081, including four isolated BM relapses and two CNS relapses (1 B-ALL, 1 T-ALL). The improved EFS in Study 58081 also appeared to result in a better OS in AR2 patients (Supporting Information S1: Figure 2).
Outcome by immunophenotype
Overall, the results for B-ALL were similar between the two studies (Figures 4 and 5). In contrast, patients with T-ALL showed improved results in study 58081 (5-year EFS: 87.3% [95% CI: 80.3%–92.0%] vs. 76.6% [95% CI: 68.9%–82.7%]).
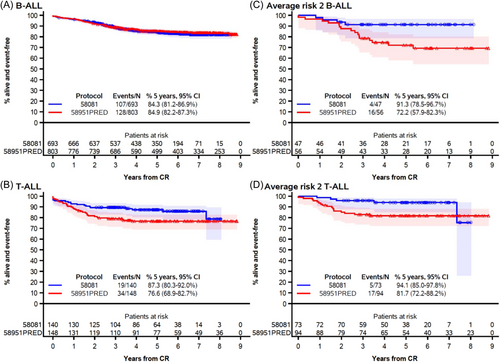
While T-ALL was distributed almost equally into AR2 (52%) and VHR (48%), the improvement in EFS was observed in the AR2 subgroup only (Figure 5). The AR2 group contained both B-ALL and T-ALL patients and there was no evidence that the improvement in EFS in this risk group depended on the immunophenotype (interaction test: p = 0.80, at 5 years in Study 58081 vs. 58951PRED: 91.3% [95% CI: 78.5%–96.7%] vs. 72.2%, [95% CI: 57.9%–82.3%] in B-ALL and 94.1% [95% CI: 85.0%–97.8%] vs. 81.7% [95% CI: 72.2%–88.2%], in T-ALL). However, because AR2 patients account for only 6.9% of B-ALL, the overall effect was minor on B-ALL outcome.
Prognostic factors in the 58081 study
We first questioned how the changes in MRD assessment introduced in Study 58081 affected the risk allocation of patients.
The proportion of patients with successful MRD assessment at completion of induction (TP1) was increased in Study 58081 (95.3% vs. 85.6% in Study 58951PRED). This improvement was mainly observed in T-ALL, for which MRD assessment reached 92.1% in Study 58081 compared to only 79.7% in Study 58951PRED (Table 2). In study 58081, 55 patients out of 835 (6.6%) had a TP1 MRD ≥10−2, and 24 out of 835 (2.9%, 1 VLR patient, 18 AR1 patients, and 5 AR2 patients) switched to the VHR risk group at the end of induction (Table 2). In study 58951PRED, 40 out of 951 (4.2%) patients had an MRD ≥10−2 at TP1 and 29 out of 951 (3.0%, 22 B-ALL, and 7 T-ALL) were switched to the VHR group (Table 2).
In addition, in Study 58081, a second-time point was added at the completion of consolidation (TP2). At TP2, 30 patients out of 835 (3.6%) had an MRD ≥10−3 (Table 2), and 6 (4 AR1, 2 AR2) were thus switched to VHR at the end of consolidation. Altogether, in study 58081, 30 out of 835 (3.6%) patients (28 B-ALL and 2 T-ALL) were switched to VHR either at the end of induction or consolidation in study 58081.
We then questioned whether the prognostic value of factors used to tailor therapy based on risk was changed.
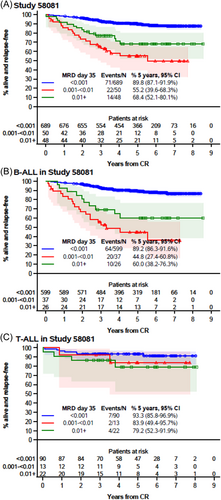
In the 58081 study, patients with an MRD <10−3 at the end of induction (TP1) had the highest DFS, as expected (Figure 6). However, DFS estimates were higher for patients with MRD ≥10−2 than for those with MRD between 10−2 and 10−3, who have not benefited from MRD-based treatment intensification. An analysis by immunophenotype suggested that contrary to the 58951PRED group, differences in EFS between MRD categories were possibly greater for B-ALL than for T-ALL in Study 58081 (Figure 6; Supporting Information S1: Figure 4). However, only eight patients with T-ALL had MRD ≥10−3 at TP2. This number was much too small to allow any meaningful analyses. In stark contrast to previous studies, T-ALL patients in Study 58081 had good outcomes even in the presence of MRD positivity, high WBC count at diagnosis, or blasts count ≥1000/µL after prephase (Supporting Information S1: Figures 4–6).
DISCUSSION
The EORTC 58951 ALL frontline treatment study was conducted by the Children Leukemia Group from 1998 to 2008.9 The 58951 study failed to demonstrate superiority of dexamethasone (6 mg/m2/day) over prednisone (60 mg/m2/day) (1:10 ratio) after randomization of approximately 2000 patients.
In the next 58081 study, in which patients participated from 2011 to 2017, the eligibility criteria and general treatment scheme remained unchanged, but some modifications were introduced. These modifications were aimed at improving the CNS prophylaxis and were mainly focused on AR2 and high-risk patients. Indeed, in the 58951 study, the CNS-relapse incidence was suboptimal in high-risk patients. The improved outcomes we observed in T-ALL patients in Study 58081 are likely to be explained by these changes. In comparison, very few changes were made to the treatment and risk stratification of VLR and AR1 patients, who represent the majority of B-ALL patients, except for the introduction of more stringent inclusion criteria for VLR patients in Study 58081.
Overall, the 5-year EFS and OS rates obtained in the 58081 study were similar to the PRED arm from the EORTC 58951 protocol that we used in comparison as representing the standard of care. However, in T-ALL, the 5-year EFS reached 87.3% in Study 58081, which is considerably higher than in the PRED arm of the previous study (76.6%).9, 22
Some of the modifications that were introduced in Study 58081 could specifically explain the improved outcome in T-ALL, especially in the AR2 group. CNS prophylaxis consisted of systemic chemotherapy (HD-MTX 5 g/m2) with longer high-dose MTX activity by using delayed leucovorin rescue. In addition, a more sensitive assessment of the CNS-2 status appeared to help increase the target population at risk of CNS relapse and to intensify intrathecal treatment. Furthermore, the T-ALL AR2 group received DXM at 10 mg/m2/day during the induction and late intensification (=reinduction and reconsolidation phases) based on the results of the AIEOP-BFM 2000 study.10 At last, the eight patients with a T-ALL CNS3 (5.7%) were intensified in the VHR group.
Increased dose intensity of treatment with DXM and asparaginase was reported to improve the outcome of patients with T-ALL,23 whereas the number of reported severe adverse events increased as well.24 However, the EORTC group previously reported that the outcome of AR patients with T-ALL did not improve with prolonged treatment with native E. coli asparaginase.13 Furthermore, most EORTC 58081 patients received native E. coli asparaginase (72% received native vs. 28% pegylated form).
In the EORTC 58081 study, the higher 5-year EFS rate in the AR2 group was driven by a lower relapse incidence (Supporting Information S1: Figure 3) than in the 58951PRED group (5.3% vs. 20.8%). Of note, only one T-ALL AR2 patient had a CNS relapse. Similar results were obtained by the COG group in the Capizzi arm25 using lower doses of MTX but in association with cranial prophylactic irradiation (except for low-risk patients) and intensifying IT therapy. It appears that, in our study, the addition of TP2 in the MRD stratification could contribute to the outcome improvement of these patients.3, 26
In the literature, the reported 5-year EFS for T-ALL patients ranges from around 69% to 84%.25-31 T-ALL patients that would be classified as AR2 using the EORTC risk group classification, that is, patients with no CNS-3 involvement, a blast count in peripheral blood ≤1 × 10⁹/L at Day 8, and MRD < 10−2 at TP1, were reported to have the best EFS (>80% in recent studies, even without prophylactic brain irradiation)25, 31 whereas in our study, the 5-year EFS rate reached 94.1% for these patients. These results suggest that the modifications introduced were effective in this subgroup of patients. However, due to the relatively small sample size in this particular subgroup reflected in the wide confidence intervals, our conclusions will have to be validated by other studies.
In B-ALL, the 5-year EFS rates were similar in the two consecutive EORTC studies, and in the range of those reported for B-ALL in recent trials.2, 3, 9, 26, 29, 32-37 The higher EFS of the patients enrolled in the AR2 group was offset by the lower EFS of the VLR patients in the current study.
In the VLR group, there was no change in treatment between the two protocols, except for the use of stricter criteria for VLR classification with the addition of an upper age limit of 10 years. It is, therefore, unclear why 10 relapses, including 7 BM isolated relapses, occurred in the 75 VLR patients. Hyperdiploid patients who relapsed had modal numbers previously reported by our group to be associated with an excellent outcome38 and did not have IKZF1 deletion, and—even so—two studies have shown that patients with IKZF1 deletion and negativity for MRD (≤10−4) at the end of induction therapy currently have very favorable outcomes, even when treated with low-intensity therapies.39-42 Yet, about half of them had a suboptimal early response to treatment, as shown by MRD results at TP1. More in-depth biological studies are needed to explain why the VLR patients in 58081 had a worse outcome. Nevertheless, the relapsed VLR patients in the current study were rescued with second-line treatments, leading to a comparable estimated OS as in the previous protocol.
Interestingly, the new pattern of EFS by MRD level observed in Study 58081 reflects the beneficial effect of MRD-based therapy intensification in patients with high end of induction MRD levels, and supports a lowering of the threshold for escalation, at least to 10−3 in B-ALL, as it is the case in several ongoing protocols. The “classical” prognostic factors, such as good response to the prephase (Day 8) in T-ALL, are not found in our study. This highlights how “classical” prognostic factors depend on the patient's outcome and need to be adapted accordingly. For T-ALL, which may respond more slowly, TP2 is now used to make the decision.3, 10, 26 Indeed, MRD in T-ALL treated in study 58081 did not appear to be as good a prognostic factor as in B-ALL at TP1. In addition, adjusting the MRD thresholds to cytogenetic and molecular abnormalities may further improve the ability of MRD to distinguish between good and poor prognosis patients.7, 41 For instance, using a cut-off of 10−4 at TP1 in patients with IKZF1 deletion can help to improve the outcomes of patients with this particular abnormality.39-42 MRD and detailed genetic results should be applied together in the future frontline therapy protocols, also allowing de-escalation of treatment for good prognosis patients with an excellent MRD response at TP1, as is the case in the ongoing ALLTogether-1 protocol (EudraCT number: 2018-001795-38).
ACKNOWLEDGMENTS
The authors thank the personnel involved in the trial EORTC-CLG 58081, in particular the EORTC Headquarters Data Managers (M-A. Lentz, L. Meirlaen, S. Rossi), Project Manager (G. de Schaetzen). We would also like to thank all those who were involved in the 58951 trial and are not authors of this study, including those from France: Grenoble: D. Plantaz, C Armari-Alla; Lille: B. Nelken, F. Mazingue, C. Preudhomme, Lyon: S. Girard, Montpellier: N. Sirvent; Nice:, C. Soler, A. Deville; Paris: A Caye-Eude, J. Vivent; Reims: C. Behar, M. Munzer, C. Dufour; Strasbourg: A. Babin-Boilletot, P. Lutz; Toulouse: G Plat, I Luquet, E. Delabesse and from Belgium: Brussels: J. Van der Werff-Ten Bosch; Gent: Y. Benoit, V. Mondelaers, T. Lammens, N. Van Roy; Leuven: H. Segers; Liège: M.-F. Dresse.
AUTHOR CONTRIBUTIONS
Carine Domenech, Stefan Suciu, Michal Kicinski, Hélène Cavé, and Yves Bertrand designed research. Carine Domenech, Barbara De Moerloose, Caroline Piette, Wadih A. Chahla, Laure Kornreich, Marlène Pasquet, Anne Uyttebroeck, Alexandre Theron, Marlène Pasquet, Chloé Arfeuille, Marleen Bakkus, Nathalie Grardel, Catherine Paillard, Claire Freycon, Frédéric Millot, Pauline Simon, Pierre Philippet, Claire Pluchart, Pierre Rohrlich, Yves Bertrand, Hélène Cavé performed research. Michal Kicinski and Stefan Suciu contributed analytical tools. Carine Domenech, Michal Kicinski, Stefan Suciu, Pierre Rohrlich, Hélène Cavé, Barbara De Moerloose, and Yves Bertrand analyzed data, and Carine Domenech, Michal Kicinski, Stefan Suciu, Barbara De Moerloose, Caroline Piette, Wadih A. Chahla, Laure Kornreich, Marlène Pasquet, Anne Uyttebroeck, Alexandre Theron, Marilyne Poirée, Chloé Arfeuille, Marleen Bakkus, Nathalie Grardel, Catherine Paillard, Claire Freycon, Frédéric Millot, Pauline Simon, Pierre Philippet, Claire Pluchart, Pierre Rohrlich, Yves Bertrand, and Hélène Cavé wrote the paper. All authors approved the final manuscript as submitted and agree to be accountable for all aspects of the work.
CONFLICT OF INTEREST STATEMENT
All authors declare no conflict of interest.
FUNDING
The project was supported by the ERA-NET TRANSCAN/European Commission under the 7th Framework Programme (FP7), granted by Fondation ARC (www.fondation-arc.org), Enfants & Cancer on behalf of the SFCE; the national cancer plan in Belgium (KPC 29 011), Stand Up against Cancer/Flemish League against Cancer and Kinderkankerfonds VZW; the Grants of Télévie for Belgium.
Open Research
DATA AVAILABILITY STATEMENT
Data that support the findings of this study are available from the corresponding author upon reasonable request.


