Abnormal functional connectivities patterns of multidomain cognitive impairments in pontine stroke patients
Yingying Wang and Caihong Wang have the equal work.
Funding information: National Natural Science Foundation of China, Grant/Award Number: 81871327; Young Talents Promotion Program of Henan Province, Grant/Award Number: 2021HYTP012
Abstract
Cognitive dysfunction in patients with infratentorial stroke has been paid little attention. Brainstem stroke may disrupt network connectivity across the whole brain and affect multidomain cognition, but the details of this process remain unclear. The study aimed to investigate the effects of stroke-induced pontine injury on whole-brain network connectivity and cognitive function. We included 47 patients with pontine stroke and 56 healthy comparisons (HC), who underwent cognitive tests and functional magnetic resonance imaging (fMRI). Seven meaningful brain networks were identified using independent component analysis (ICA). Patients with pontine stroke had decreased intra-network functional connectivities (FCs) in the primary perceptual and higher cognitive control networks, including sensorimotor network (SMN), visual network (VIS), default mode network (DMN), and salience network (SAN), as well as decreased inter-network FCs in the primary perceptual (VIS-SMN) and higher cognitive control networks (bilateral frontoparietal networks, rFPN-lFPN). While the FCs between the primary perceptual and higher cognitive control networks (VIS-DMN, VIS-rFPN, VIS-lFPN) were increased. Furthermore, the alterations in these FCs correlated with patients' cognitive measurements. These findings suggested that the infratentorial stroke can induce dysfunctional connectivity in both primary perceptual and higher cognitive control networks at the whole-brain level, which may be attributable to the neural substrates of multidomain cognitive deficits in these patients.
1 INTRODUCTION
Cognitive deficits caused by posterior circulation stroke are commonly encountered in the clinic; however, previous studies on this topic rarely included infratentorial brain tissues, such as pons or medulla oblongata (Maeshima et al., 2012). While clinical studies have found that brainstem lesions can cause cognitive disorders, cognitive dysfunction after infratentorial stroke is often overlooked, as compared to cortical lesions (Obayashi, 2019). In addition, several studies have suggested that lesions in the infratentorial brain region (e.g., pons) can cause a variety of neuropsychological defects, such as executive dysfunction, inattention, memory decline, and reduced information processing speed (Knopman et al., 2009; Zandvoort et al., 2003), which seriously affect the quality of life and outcomes of patients. However, the neural substrates underlying multidomain cognitive deficits in patients with infratentorial stroke remain largely unknown.
Several reports have indicated that cognitive decline following brainstem stroke might damage the fronto-cerebellar-thalamic loop via the brainstem (Fazekas et al., 1993; Obayashi, 2019). Studies have also found that prefrontal hypoactivity is related to cognitive dysfunction in brainstem stroke patients (Chen et al., 2019), whereas the neurological underpinnings of this phenomenon remain unclear. In addition, dynamic functional connectivity analysis found that an imbalance between functional segregation and integration may lead to poor recovery of memory function in pontine stroke (PS) patients (Wang et al., 2020). Multimodal neuroimaging studies found that decreased gray matter volume (Wei et al., 2020), changes in cerebral blood flow (Wei et al., 2020), and voxel-mirrored homotopic connectivity (Wu et al., 2021) may underlie memory impairment and recovery in PS patients. However, the above studies have mainly focused on memory deficits, and little is known about the neural mechanisms in other domains of cognitive impairment and their underlying correlations with these cognitive domains in patients with infratentorial stroke. In addition, changes in patterns of functional connectivity (FC) at the regional and global levels in infratentorial stroke patients with cognitive dysfunction are not well understood.
The brain is a complex network composed of multiple functional sub-networks that interact with each other to maintain whole-brain activity (Power et al., 2011). A focal lesion can cause changes in the corresponding sub-network, thus affecting the efficiency of whole-brain activity, resulting in complex neurological symptoms (Wang et al., 2014). For instance, functional magnetic resonance imaging (fMRI) has demonstrated that subcortical stroke may induce connectivity changes in multiple functional networks, affecting not only the functional connectivity within resting-state network but also between these brain networks (Hong et al., 2019; Wang et al., 2014; Zhao et al., 2018). Moreover, brain morphometric studies based on structural MRI have revealed that chronic subcortical stroke patients have extensively disordered anatomical connections involving whole-brain level networks (Olafson et al., 2021).
In this study, we aimed: (a) to investigate the alterations of intra- and inter-network FCs at the whole-brain level in PS patients; (b) to explore the relationships between the altered FCs of these brain networks and cognitive behavior; (c) to elaborate the neural substrates for underlying multidomain cognitive deficits in patients with infratentorial stroke.
2 MATERIALS AND METHODS
2.1 Participants
This study was conducted at the First Affiliated Hospital of Zhengzhou University and Tianjin Medical University General Hospital. The institutional ethics committee of the local hospitals approved the study, and all participants signed the informed consent form. G* Power software (version 3.1.9.7) was used for sample size estimation. According to the previous studies (Cohen, 1988; Wang et al., 2021), we chose a two-tailed analysis, with effect size d = 0.8, alpha error probability = 0.05, power = 0.8, and allocation ratio = 1; the sample size of each group was 26.
The inclusion criteria for PS patients were as follows: (1) first-onset ischemic stroke; (2) single lesion of ischemic infarct involving the pons; (3) right-handedness before stroke, as ascertained with the Chinese edition of the Edinburgh Handedness Inventory; (4) time after pontine stroke onset >6 months; (5) showing neurological deficit (NIH stroke scale, NIHSS >3) at acute onset; and (6) age ranging from 40 to 80 years. The exclusion criteria for PS patients were as follows: (1) recurrent stroke; (2) a history of any other brain abnormalities that affected neurological function; (3) any other brain structure damage identified by MRI examinations; (4) a history of alcohol or drug dependency; (5) MRI contraindications or poor physical condition that may influence image acquisition; (6) Fazekas scale score for white matter hyperintensity >1 on T2 fluid-attenuated inversion recovery (T2 FLAIR) images (Fazekas et al., 1987); and (7) presence of lacunes (based on T2 FLAIR). The HC were recruited from the local community and the recruitment requirements were as follows: (1) sex-, age-, and education- matched with the PS group; (2) the absence of any neurological dysfunction; (3) no brain structure damage identified by MRI examinations; (4) no history of alcohol or drug dependency; (5) good physical condition for image acquisition and behavior assessment; (6) Fazekas scale score for white matter hyperintensity ≤1 on T2 FLAIR images; (7) the absence of lacunes (based on T2 FLAIR). After data quality control, 47 PS patients (26 left- and 21 right-sided PS) and 56 HC were enrolled in this study.
2.2 Behavioral Assessment
In the present study, E-Prime 2.0 software (https://pstnet.com/products/e-prime/) was used to present stimuli and collect cognitive data. Visual attention was assessed using an arrow version of the Flanker task (FT) (Eriksen & Eriksen, 1974), in which participants were requested to press the left or right computer mouse button according to the center target's direction while ignoring an array of “flanking” arrows. The working memory and spatial memory were tested using the modified versions of number back task (NBT) (Stollstorff et al., 2010) and spatial back task (SBT) (Vuontela et al., 2003), respectively. Both tasks comprise 1-back conditions, with 61 trials in each condition. The participants were asked to memorize and recognize the constantly refreshing visual number or spatial stimuli, comparing the stimulus information currently presented with the stimulus preceded one position prior, and to present responses with the computer mouse. In the above tasks, the mean reaction time (RT) for correct responses and the accuracy were calculated as cognitive indicators to assess visual attention, working memory, and spatial memory of each participant. Executive function was observed using the Trail Making Test (TMT) (Llinàs-Reglà et al., 2017), which consists of two parts (TMT-A and TMT-B). In TMT-A, participants were requested to connect randomly positioned numbered circles from 1 to 25 following the number sequence; the TMT-B is similar to TMT-A, but participants were required to connect the circles alternating between numbers and letters in order (e.g., 1 to A to 2 to B, …). The participants were requested to complete the tests as quickly as possible, and the scores were calculated in terms of the time taken to complete the test. In addition, the motor function of stroke patients was also recorded using the Fugl–Meyer test (FMT), including the whole extremity and the upper limb tests.
2.3 Data Acquisition
The MR images of all subjects were collected on two same-type scanners (Discovery MR750 3.0 Tesla, General Electric, Milwaukee, WI, USA) using the same parameters at both participating medical centers. Before MRI examinations, subjects were required to rest for 30 min. All subjects were instructed to close their eyes and remain motionless during the scan. For each subject, resting-state fMRI data were obtained using a gradient-echo single-shot echo-planar imaging sequence with the following parameters: repetition time (TR) /echo time (TE) = 2000 ms/30 ms, flip angle = 90°, field-of-view (FOV) = 220 mm × 220 mm, matrix = 64 × 64, slice thickness = 4.0 mm, gap = 0.5 mm, slices = 32, and volumes = 180, and the total time = 360 seconds. Sagittal three-dimensional T1-weighted images (3D-T1WI) were acquired by a brain volume sequence with the following parameters: TR/TE = 8.2 ms /3.2 ms, flip angle = 12°, FOV = 256 mm × 256 mm, matrix = 256 × 256, slice thickness = 1.0 mm, no gap, slices = 188, and voxel size = 1 mm × 1 mm × 1 mm, and the total time = 259 s. T2 FLAIR images were acquired with the following parameters: TR/TE = 8400 ms/155 ms, thickness = 5.0 mm, FOV = 240 mm × 240 mm; and slices = 21.
2.4 Image processing
Before data preprocessing, we flipped the imaging data from right to left along the midsagittal line in patients with right lesions to improve the statistical power. The flipped data were examined by a professional senior neuroradiologist via visual inspection to ensure that each lesion was flipped correctly. After this process, the left side of all stroke images represent the ipsilesional (affected) hemisphere while the right side represent the contralesional (unaffected) hemisphere. A probability map of lesion location is shown in Figure 1. The lesion location of each stroke patient was determined by an experienced neuroradiologist on 3D-T1WI. First, the 3D-T1WI were spatially normalized to a standard Montreal Neurological Institute (MNI) space (MNI152 T1, 1 mm). Then, the lesions were artificially delineated on the normalized 3D-T1WI layer by layer with the MRIcron software (http://www.mccauslandcenter.sc.edu/mricro/mricron/). Accordingly, the lesion mask was generated for each patient. Subsequently, the lesion masks of all patients were superimposed to average the lesion masks. Finally, the average lesion mask was overlaid on a standard MNI template (MNI152 T1, 1 mm).

All MRI data were preprocessed using Data Processing & Analysis for Brain Imaging software (DPABI; http://rfmri.org/DPABI). The following steps were adopted: (1) checking the image quality of each participant, converting raw DICOM images to NIfTI files; (2) the first ten time points from each subject were discarded for steady-state magnetization; (3) the remaining 170 time-points were corrected to ensure that the image acquisition time was consistent among slices; (4) realignment for head-motion correction was performed to eliminate the influence of motion on FC; (5) the functional images were spatially normalized to the standard MNI templates, resampling voxel size was set to 3 mm × 3 mm × 3 mm, using Diffeomorphic Anatomical Registration Through Exponentiated Lie algebra (DARTEL) (Ashburner, 2007); (6) finally, the normalized images were smoothed with a Gaussian kernel of 8 mm × 8 mm × 8 mm full-width at half-maximum to increase the signal-to-noise ratio. To eliminate the influence of motion on FC, we excluded participants with a maximum displacement of 2 mm, maximum rotation above second degrees, or mean framewise displacement (FD) > 0.5, which was calculated by averaging the FD of each participant across the time points (Power et al., 2012). In practice, none of the subjects were excluded from the study. We also found no significant differences in mean FD between the PS and HC groups (p = .171).
2.5 Identification of resting-state networks
Spatial independent component analysis (ICA) was performed to define resting-state networks (RSNs) using the Group ICA of fMRI Toolbox software (GIFT version 4.0b; http://icatb.sourceforge.net). The toolbox supports a group ICA approach that first concatenates individual data across time and subsequently computes subject-specific components and time-courses. First, principal component analysis (PCA) was used for data reduction in group ICA of fMRI data. Then, the Infomax algorithm was used to extract independent spatial maps and time-courses for each component. The subject order independent group ICA (SOI-GICA) algorithm was adopted and performed 100 times to produce the independent components (ICs). Finally, the individual-level components were obtained from back-reconstruction. The number of independent components was estimated to be 23 using GICA software. The intensity of connectivity within each independent component and each subject was converted to z-scores, which reflect the correlation between the time series of a given voxel and the average time series of the corresponding components. The higher was the z value, the stronger was the FC.
2.6 Intra-network Functional Connectivity Analysis
Statistical Parametric Mapping 12 (SPM12; http://www.fifil.ion.ucl.ac.uk/spm) was used to create statistical parametric maps for each ICA component. In this analysis, each RSN based on both patients and comparisons was entered into a random-effect one-sample t-test using a voxel-level family-wise error (FWE, p < .05) correction with a cluster size of >100 voxels. Accordingly, each sample-specific spatial map was generated for intra-network FC analysis. Subsequently, the differences within each RSN were compared between the two groups in a voxel manner, using two-sample t-tests, with age, sex, years of education, and mean FD as covariates for regression. Multiple comparisons were corrected using the cluster-level FWE (cFWE) method, with a voxel p < .001 and a correction threshold of p < .05. For each participant, the FC intensity of each cluster with a significant group difference in each network was extracted and Cohen's d (Parker & Hagan-Burke, 2007) was used to describe the effect size (ES) of each cluster.
2.7 Inter-network functional connectivity analysis
Before calculating the FCs between each pair of RSNs, additional post-processing steps were performed on the time-courses of the RSNs considered meaningful including: (a) removing linear, quadratic, and cubic detrends; (b) regressing out six realignment parameters and their temporal derivatives (in the x-, y-, and z-directions, as well as pitch, roll, and yaw); (c) low-pass filtering 0.15 Hz; and (d) removing spikes to ensure that artifactual spikes did not negatively impact the signal analysis. Next, the mean time-course of each RSN for each subject was extracted by averaging the time-course of all voxels within the sample-specific RSN mask. Pearson's correlation coefficients (r) of the mean time-courses between all pairs of RSNs were calculated for each subject. This resulted in a C × C connectivity matrix (C is the number of RSNs identified) for each participant. Subsequently, the r-value was transformed to z-value using Fisher's r-to-z transformation to improve normality for further random-effects between-group analyses. Significance testing for differences between the two groups was performed using a two-sample t-test with age, sex, years of education, and mean FD as covariates for regression (p < .05, uncorrected).
2.8 Validation analyses
To validate the robustness of the results, the same processing steps and statistical analysis were applied to the non-flipped data of PS patients with left and right lesions (PS_L and PS_R), respectively (see detailed information in part 1 of the Appendix S1).
2.9 Statistical analyses
A two-sample t-test was used to detect differences in age and years of education, and a chi-square test was used to compare sex differences between the PS and HC groups. A general linear model was used to test the differences of cognitive assessment (FT, NBT, SBT, and TMT) between the two groups controlling for age, sex, and years of education; as well as the differences of intra- and inter-network FCs between the two groups with age, sex, years of education, and mean FD as covariates. Pearson's correlation analysis was used to calculate the correlation between cognitive variables and altered intra- and inter-network FCs in patients group (p < .05). In addition, a multiple regression model was used to evaluate the effects of group membership and cognitive variables on the altered intra-network FCs. Statistical significance was set at p < .05 (see detailed information in Part 2 of the Appendix S1).
3 RESULTS
3.1 Demographic and clinical parameters
Detailed demographic, clinical, and behavioral data are described in Table 1. No significant intergroup differences were observed in terms of age (p = .200), sex (p = .712), or years of education (p = .087). Compared with HC, PS patients performed worse in the working memory task (NBT_accuracy, p = .036; NBT_RT, p = .013), spatial memory task (SBT_RT: p = .002), and executive function (TMT-B, p = .036).
| Variables | PS patients | HC | p-Value |
|---|---|---|---|
| Gender (male/female) | 26/21 | 33/23 | .712 |
| Mean age (years) | 57.75 ± 7.40 | 55.77 ± 8.03 | .200 |
| Education (years) | 9.81 ± 3.49 | 10.86 ± 2.65 | .087 |
| Mean FD | 0.15 ± 0.09 | 0.13 ± 0.07 | .171 |
| Lesion side (left/right) | 26/21 | – | – |
| Lesion volume (voxels) | 116.17 ± 99.03 | – | – |
| FMT-Upper | 62.45 ± 8.82 | – | – |
| FMT-Whole | 94.89 ± 11.98 | – | – |
| FT-accuracy | 0.96 ± 0.07 | 0.97 ± 0.04 | .243 |
| FT-RT | 688.09 ± 221.17 | 614.83 ± 204.28 | .081 |
| NBT-accuracy | 0.90 ± 0.10 | 0.94 ± 0.04 | .036 |
| NBT-RT | 923.38 ± 236.52 | 815.96 ± 211.50 | .013 |
| SBT-accuracy | 0.90 ± 0.08 | 0.92 ± 0.05 | .328 |
| SBT-RT | 959.26 ± 248.47 | 843.10 ± 196.43 | .002 |
| TMT-A | 68,264.76 ± 34,041.99 | 59,516.00 ± 28,151.99 | .849 |
| TMT-B | 148,154.82 ± 69,767.94 | 121,591.93 ± 44,440.90 | .036 |
- Data are presented as mean ± SD; Statistical significance was set to p < .05.
- Abbreviations: FT-accuracy, accuracy of Flanker task; FT-RT, reaction time of Flanker task; HC, healthy comparisons; NBT-accuracy, accuracy of number back task; NBT-RT, reaction time of number back task; PS, pontine stroke; SBT-accuracy, accuracy of spatial back task; SBT-RT, reaction time of spatial back task; TMT-A, Trail Making Test A; TMT-B, Trail Making Test B.
3.2 Components of the resting-state networks
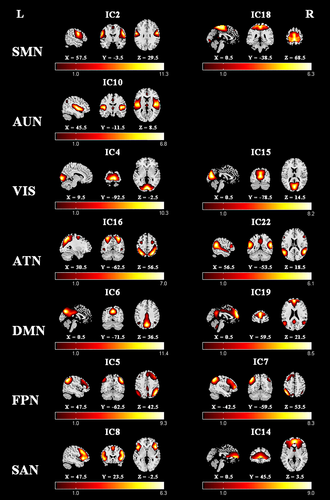
Seven meaningful RSNs were identified via the group ICA method for both flipped and nonflipped data (see Part 1 of Appendix S1), including sensorimotor network (SMN: IC2, IC18), auditory network (AUN: IC10), visual network (VIS: IC4, IC15), attention network (ATN: IC16, IC22), default mode network (DMN: IC6, IC19), right frontoparietal network (rFPN: IC5), left frontoparietal network (lFPN: IC7), and salience network (SAN: IC8, IC14). The components and locations of these RSNs were consistent with previous studies (Seeley et al., 2007; Stephen M. Smith et al., 2009), and the details of the spatial distribution of these networks are presented in Figure 2.
3.3 Altered intra-network functional connectivity
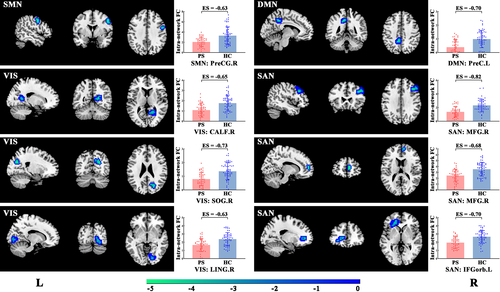
The significant inter-group differences in the intra-network FCs between the patient and control groups were assessed in a voxel-wise manner, as shown in Figure 3 and Table 2. The FC values of each brain region with significant inter-group differences, involving SMN, VIS, DMN, and SAN, were extracted to facilitate further analysis. Specifically, PS patients exhibited significantly decreased intra-network FCs in the right precentral gyrus (PreCG.R) of the SMN, right calcarine fissure (CALF.R), right superior occipital gyrus (SOG.R), and right lingual gyrus (LING.R) of the VIS, the left precuneus (PreC.L) of the DMN, the right middle frontal gyrus (MFG.R), and the orbital part of left inferior frontal gyrus (IFGorb.L) of the SAN.
| Brain region | RSN | Cluster size (voxels) | Peak z-score | MNI Coordinates (x,y,z) |
|---|---|---|---|---|
| right precentral gyrus (PreCG.R) | SMN | 45 | −4.824 | 51, 0, 42 |
| right calcarine fissure (CALF.R) | VIS | 51 | −5.095 | 21, −54, 12 |
| right superior occipital gyrus (SOG.R) | VIS | 65 | −4.741 | 24, −69, 27 |
| right lingual gyrus (LING.R) | VIS | 48 | −4.081 | 18, −84, −3 |
| left precuneus (PreC.L) | DMN | 47 | −5.145 | −9, −42, 42 |
| right middle frontal gyrus (MFG.R) | SAN | 70 | −4.970 | 42, 24, 33 |
| right middle frontal gyrus (MFG.R) | SAN | 32 | −4.578 | 9, 54, 6 |
| the orbital part of left inferior frontal gyrus (IFGorb.L) | SAN | 82 | −4.802 | −27, 30, −6 |
- Abbreviations: DMN, default mode network; SMN, sensorimotor network; SAN, salience network; VIS, visual network.
3.4 Altered inter-network functional connectivity
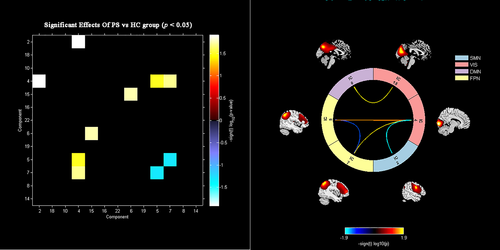
The inter-group differences in inter-network FC are shown in Figure 4 and Table 3. Compared with control subjects, stroke patients showed decreased inter-network FCs between SMN (IC2) and VIS (IC4), and between bilateral FPN (IC5-IC7). Stroke patients also displayed increased inter-network FCs between VIS (IC15) and DMN (IC6), between the VIS and rFPN (IC4-IC5), and between the VIS and lFPN (IC4-IC7). However, none of these inter-network FCs differences remained significant after correcting for multiple comparisons using either the FWE or false discovery rate method.
| Network | PS patients | HC | t-Value | p-Value |
|---|---|---|---|---|
| SMN (IC2)-VIS(IC4) | 0.11 ± 0.31 | 0.26 ± 0.33 | −2.554 | .012 |
| rFPN (IC5)-lFPN (IC7) | 0.27 ± 0.39 | 0.44 ± 0.29 | −1.998 | .049 |
| VIS (IC15)-DMN (IC6) | 0.28 ± 0.35 | 0.14 ± 0.30 | 2.415 | .018 |
| VIS (IC4)-rFPN (IC5) | −0.01 ± 0.29 | −0.12 ± 0.31 | 2.171 | .032 |
| VIS (IC4)-lFPN (IC7) | 0.04 ± 0.31 | −0.08 ± 0.29 | 2.361 | .020 |
- Data are presented as mean ± SD; Statistical significance was set to p < .05.
- Abbreviations: DMN, default mode network; HC, healthy comparisons; lFPN, left frontoparietal network; PS, pontine stroke; rFPN, right frontoparietal network; SMN, sensorimotor network; VIS, visual network.
3.5 Correlation analyses
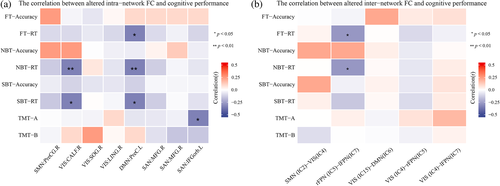
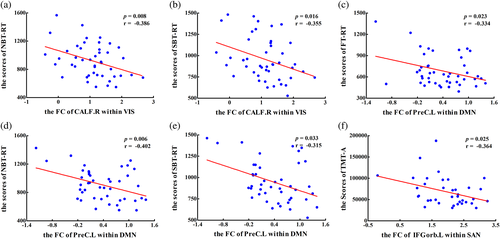
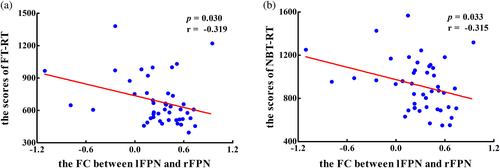
The heat maps of the correlation matrix that showed the correlations between clinical assessments and the altered intra- and inter-network FCs are displayed Figure 5 (see detailed information in Part 3 of the Appendix S1). In terms of intra-network, the PS patients displayed a significant negative correlation between the decreased FC of CALF.R within VIS and working memory scores (pNBT-RT = 0.008, rNBT-RT = −0.386, Figure 6a), spatial memory scores (pSBT-RT = 0.016, rSBT-RT = −0.355, Figure 6b); between the decreased FC of PreC.L within DMN and visual attention scores (pFT-RT = 0.023, rFT-RT = −0.334, Figure 6c), working memory scores (pNBT-RT = 0.006, rNBT-RT = −0.402, Figure 6d) and spatial memory scores (pSBT-RT = 0.033, rSBT-RT = −0.315, Figure 6e); between the decreased FC of IFGorb.L within SAN and the execution function scores (pTMT-A = 0.025, rTMT-A = −0.364, Figure 6f). For the inter-network, PS patients showed a significant negative correlation between the altered FCs between lFPN and FPN and visual attention scores (pFT-RT = 0.030, rFT-RT = −0.319, Figure 7a) and working memory scores (pNBT-RT = 0.033, rNBT-RT = −0.315, Figure 7b).
4 DISCUSSION
This study investigated abnormalities of intra- and inter-network FCs at the whole-brain level in PS patients. We found decreased connectivity within both primary perceptual (including SMN and VIS) and higher cognitive control networks (involving DMN and SAN) in PS patients. We also detected decreased connectivity between primary perceptual networks (VIS-SMN) as well as between higher cognitive control networks (rFPN-lFPN). Intriguingly, we further found increased connectivity between primary perceptual and higher cognitive control networks (VIS-DMN, VIS-rFPN, VIS-lFPN). In addition, the study also detected significant correlations between cognitive scales and altered FCs of intra- and inter-networks.
4.1 Decreased FCs within and between primary perceptual networks
In this study, we found decreased FCs in primary perceptual networks involving the SMN and VIS in PS patients, which was in line with previous studies (Zhao et al., 2018). PS patients exhibited decreased intra-network FC in the right precentral gyrus of SMN, which is a typical primary motor cortex (M1). M1 is an important node in motor network (Pearson, 2000) and corticospinal tract (Liu et al., 2015), which is related to motor performance and execution function (Bhattacharjee et al., 2021). In other words, there are dense anatomical connections between pontine lesions and their corresponding affected regions. Thus, the decreased FC in M1 may indicate motor dysfunction in the PS patients in the study, which was consistent with previous functional (Wang et al., 2019) and morphometric (Jiang et al., 2017) studies on PS patients.
VIS is a part of the visual information system. The decreased intra-network FC in the right calcarine fissure, right superior occipital gyrus, and right lingual gyrus of VIS may reflect functional interruption of the visual system after PS. The occipital lobe, as the visual cortex, mainly participates in the functional activities related to visual formation and visual perception (Yu et al., 2017). In addition, the superior occipital gyrus is a crucial part of the dorsal extrastriate cortex, which is involved in higher-level visual association processes (Luo et al., 2020; Uddén et al., 2017). The lingual gyrus is an early visual processing area, which is associated with visual memory (Benedek et al., 2016). Anatomically, the occipital cortex is an important part of corticopontocerebellar circuit, and the pontine lesions may cause damage to corticopontine tract and altered corresponding cortical function. The decreased FC in VIS may indicate interruption of visual information transmission processing in PS patients. In addition, we found that PS patients displayed significant correlations between decreased FC within VIS and working memory and spatial memory, suggesting the disruption in visual cortex may underline the poor behavior of visuospatial working memory (Wu et al., 2021).
Furthermore, the study found that PS patients displayed a dysconnectivity between SMN and VIS, suggesting the destruction of integration of sensory information and the cooperation between primary perceptual networks in PS patients. This result was consistent with previous findings indicating that cognitive impairment may affect somatomotor-visual integration (Freiherr et al., 2013; Mahoney & Verghese, 2020), as selective visual attention is thought to modulate multi-sensory integration processes (Woolgar et al., 2016).
4.2 Decreased FCs within and between higher cognitive control networks
We found that the intra-network FC of DMN and SAN was weakened in stroke patients. It may be that the brainstem lesion destroyed the direct or indirect anatomical connectivities between brainstem and regions of DMN and SAN (i.e., prefrontal cortex, precuneus, cingulate cortex and anterior insular, etc.), which may be damaged through secondary axonal degeneration (Jiang et al., 2018). The DMN was originally discovered as a collection of medial prefrontal cortex, anterior and posterior cingulate cortex, and precuneus, which is often associated with internally directed cognition, emotional processes, social cognition, and situational content of episodes (Cavanna & Trimble, 2006; Raichle, 2015; Raichle et al., 2001). The altered FC of DMN in these patients is consistent with a previous study that reported a dysfunction of DMN FC in PS patients (Chen et al., 2019). In addition, we found that the decreased FC within DMN was negatively correlated with the RT of visual attention, working memory, and spatial memory tests, which might indicate that the disordered connectivity within DMN attribute to multidomain cognitive deficits in PS patients.
The SAN is regarded as the cooperator of the DMN in brain networks. It is often involved in cognitive control by integrating sensory information and other important emotional stimuli, receiving sensory input, and regulating the functions of related brain–behavioral networks (Peters et al., 2016). The SAN includes the dorsal anterior cingulate cortex, bilateral anterior insula, and specific regions of the dorsolateral prefrontal cortex (dlPFC) (Peters et al., 2016). The dlPFC is a key node of cognitive control that mediates executive function, including planning, working memory, selective attention, and set shifting (John et al., 2006; Kuo & Nitsche, 2012). In our study, we found decreased FC in MFG.R and IFGorb.L, which pertains to dlPFC, within SAN. This decreased FC had a significant negative correlation with execution function, suggesting damaged cognitive control function in PS patients.
In addition, the study further detected decreased FC between bilateral FPNs. The FPN is also known as the multiple-demand (MD) network (Duncan, 2010), cognitive control network (Niendam et al., 2012), or task positive network (Fox et al., 2005), which comprising regions of lateral frontal, insular, dorsomedial frontal, and parietal cortex. The characteristic of fronto-parietal “multiple-demand” regions is increased activity during externally directed higher-order cognitive function or diverse demanding tasks, and has been linked to numerous important constructs such as cognitive control, working memory, decision-making, goal-directed behavior, and visual attention (Liang et al., 2016; Wen et al., 2018). In other words, the FPN is a functional hub that affects whole-brain communication to meet MD tasks (Marek & Dosenbach, 2018). In the present study, the decreased FC in the MD network might suggest that execution ability in complex MD tasks in PS patients had declined. The study also found that decreased FC of MD network was negatively correlated with the RT of visual attention and working memory test, suggesting that disruption of FPN might lead to impairment of these higher cognitive tasks.
4.3 Increased FCs between primary perceptual and higher cognitive control networks
In above, we found decreased connectivity both within and between the primary perceptual networks as well as the higher cognitive control networks. Intriguingly, we further found that the FCs between primary perceptual and higher cognitive control networks were increased in PS patients. Specifically, there were increased inter-network FCs between VIS and DMN, lFPN, and rFPN.
The DMN is characterized by strong functional activation in the resting-state and decreased activation during most externally driven tasks (Raichle, 2015). It is involved in introspection activities and externally directed task switching. One proposed neural mechanism is that neurocognitive deficits are related to the inability of patients to deactivate the DMN during cognitive tasks (Pomarol-Clotet et al., 2008; Whitfield-Gabrieli et al., 2009). In the present study, the tight inter-network FC between VIS and DMN might be related to this pathological process, leading to cognitive deficits in PS patients.
As outlined above, the FPN or MD network is important in cognitive control (Crittenden et al., 2016), and may orchestrate the allocation of visual attentional resources to individual parts of a complex task for the requirements of the task. That is, the FPN has been suggested to control goal-directed behavior, such as implementing top-down visual attentional control and optimally focusing processing for the requirements of a current task (Broyd et al., 2009). The increased inter-network FCs between the VIS and bilateral FPNs in this study might suggest top-down modulation of FPN to enhance sensory processing in visual cortex in perceptual tasks (Wen et al., 2018), to compensate for the deficit of primary perceptual networks.
4.4 Limitations
This was a cross-sectional study, and it is important for future studies to trace the dynamic evolution of intra- and inter-network FCs in PS patients. Besides, this study was that the inter-network FCs did not reach statistical significance after correction for multiple comparisons using either FWE or the false discovery rate method; further studies should recruit a larger sample of PS patients to validate our findings, particularly in terms of left- or right-sided stroke patients, respectively. In addition, future work is also needed to evaluate the differences in functional network connectivities between the pontine stroke and strokes elsewhere, especially the other infratentorial brain regions. Lastly, we only collected PS patients with NIHSS defects, which might lead to sampling bias, a larger sample including patients without NIHSS defects should be further studies to be representative of PS patients more broadly.
5 CONCLUSIONS
This study demonstrated that PS patients had decreased FCs within the primary perceptual and higher cognitive control networks, and increased FCs between the primary perceptual and higher cognitive control networks. In addition, we found that the altered intra- and inter-network FCs were significantly correlated with multidomain cognitive behaviors, involving visual attention, working memory, spatial memory, and execution function. These findings suggest that infratentorial stroke can lead to dysfunctional connectivity in whole-brain level networks, which may be the underlying neural substrates of multidomain cognitive deficits in these patients.
ACKNOWLEDGMENTS
We are indebted to our patients and their caregivers for generously supporting our study. This study was supported by the Natural Science Foundation of China (81871327), the Young Talents Promotion Program of Henan Province (2021HYTP012).
Open Research
DATA AVAILABILITY STATEMENT
The data that support the findings of this study are available from the corresponding author upon reasonable request.


