Fast periodic visual stimulation to highlight the relationship between human intracerebral recordings and scalp electroencephalography
Funding information: Fédération Wallonie-Bruxelles, Grant/Award Number: ARC 13/18-053; Fondation Louvain; Fonds National de la Recherche - FNRS, Grant/Award Number: PDR T.0207.16
Abstract
Despite being of primary importance for fundamental research and clinical studies, the relationship between local neural population activity and scalp electroencephalography (EEG) in humans remains largely unknown. Here we report simultaneous scalp and intracerebral EEG responses to face stimuli in a unique epileptic patient implanted with 27 intracerebral recording contacts in the right occipitotemporal cortex. The patient was shown images of faces appearing at a frequency of 6 Hz, which elicits neural responses at this exact frequency. Response quantification at this frequency allowed to objectively relate the neural activity measured inside and outside the brain. The patient exhibited typical 6 Hz responses on the scalp at the right occipitotemporal sites. Moreover, there was a clear spatial correspondence between these scalp responses and intracerebral signals in the right lateral inferior occipital gyrus, both in amplitude and in phase. Nevertheless, the signal measured on the scalp and inside the brain at nearby locations showed a 10-fold difference in amplitude due to electrical insulation from the head. To further quantify the relationship between the scalp and intracerebral recordings, we used an approach correlating time-varying signals at the stimulation frequency across scalp and intracerebral channels. This analysis revealed a focused and right-lateralized correspondence between the scalp and intracerebral recordings that were specific to the face stimulation is more broadly distributed in various control situations. These results demonstrate the interest of a frequency tagging approach in characterizing the electrical propagation from brain sources to scalp EEG sensors and in identifying the cortical sources of brain functions from these recordings.
1 INTRODUCTION
Since its first report and validation in humans (Adrian & Matthews, 1934) scalp electroencephalography (EEG) has been widely used to study dynamic neurofunctional processes and their pathology in large-scale brain networks (Lopes da Silva, 2013; Nunez & Srinivasan, 2005; Regan, 1989). Given that EEG noninvasively provides information about the unfolding of brain processes at the millisecond time resolution, understanding the relationship between scalp EEG signals and their source(s) at the cortical level is important for fundamental research. It is also of primary importance for clinical studies, in particular for the neurological study of epileptic patients, in order to define and localize brain sources of epileptic seizures (Coito et al., 2019; Gavaret, Badier, Marquis, Bartolomei, & Chauvel, 2004; Koessler et al., 2010). Unfortunately, knowledge about the relationship between scalp EEG signals and their cortical source(s) remains severely limited, for several reasons. First, scalp EEG signals are attenuated by the electrical resistance of head tissues, which remain unknown in human in vivo (especially the skull resistivity) and very difficult to estimate noninvasively and during in vivo measurements (Goncalves et al., 2003; Koessler et al., 2017; Malmivuo & Suihko, 2004). Second, the distance from brain sources to scalp sensors reduce the amplitude of EEG signal, making it difficult to capture and estimate brain sources at the deepest portions of sulci or the medial brain structures (Koessler et al., 2015; Seeber, Cantonas, Sesia, Visser-vandewalle, & Michel, 2019; see also Pizzo et al., 2019 in MEG). Third and perhaps most importantly, many brain sources (often co-activated in interlocked time-courses) contribute to EEG recording. Electrical signals generated by these co-activated sources are mixed when measured on the scalp with EEG sensors, making it difficult to assign a specific source to a specific EEG signal characteristic (nonlinear relationship; Kovach, Oya, & Kawasaki, 2018) and requiring to solve an undetermined inverse problem (Grech et al., 2008; Kaiboriboon, Luders, Hamaneh, Turnbull, & Lhatoo, 2012; Michel et al., 2004).
In humans, the relationship between scalp EEG signals and their cortical sources can be potentially addressed by comparing simultaneous scalp and intracranial EEG recordings. These rare studies derive from invasive investigations performed mainly with foramen ovale or subdural electrodes (e.g., Alarcon et al., 1994; Lantz, Holub, Ryding, & Rosen, 1996; Van Der Loo, Congedo, Plazier, Van De Heyning, & De Ridder, 2007; Wennberg & Cheyne, 2014) and more rarely with intracerebral electrodes (Alarcon et al., 1994; Gavaret, Dubarry, Carron, & Bartolomei, 2016; Koessler et al., 2015). In the latter case, intracerebral EEG (also named stereoelectroencephalography, SEEG) records electrical activity directly from specific brain areas with high anatomical accuracy by means of implanted multicontact electrodes. This technique is used in the presurgical evaluation of drug-resistant epilepsies (Chauvel, Gonzalez-Martinez, & Bulacio, 2019; Talairach & Bancaud, 1973). Beyond its clinical significance, the recorded signal can be analyzed in parallel for research purposes (e.g., Allison, Puce, Spencer, McCarthy, & Belger, 1999; Barbeau et al., 2008; Halgren et al., 1994; Jacques et al., 2016; Jonas et al., 2016).
The few studies which investigated the relationship between simultaneously recorded scalp EEG and SEEG signals relied on event-related potential (ERP) approaches, in which brain activity is recorded to the sudden occurrence of an event (external or internal such as epileptic spikes) and then averaged in the time domain (Dubarry et al., 2014; Jacques et al., 2019; Koessler et al., 2015; Merlet et al., 1998; Rosburg et al., 2010). At least two main factors make it difficult to perform these studies and therefore seriously limit their availability. First, relating scalp to intracerebral EEG requires a high signal-to-noise ratio (SNR) on the scalp, which typically results in long-duration experiments to collect data from a large number of events (exogenous or endogenous; Luck, 2014). SNR is particularly an issue in these clinical settings where recordings can take place over several days without the possibility to fix or replace noisy scalp electrodes. Second, the amplitude and shape of evoked responses in the time domain are difficult to relate across scalp and intracerebral EEG because of the diversity and the unknown spatiotemporal dynamic of activated sources within the brain (Lopes da Silva, 2019).
“All the messages which reach the cortex will produce their own electrical accompaniment, and this can be recorded well enough if electrodes can be placed on the surface of the brain. But if we can get no nearer than the scalp, the potential changes generated in any group of nerve cells will usually be obscured by those of other groups nearby, and the record will then show us nothing… Fortunately this difficulty can be overcome, in part at least, by making all the cells work in unison. This can be done, as far as vision is concerned, by making the field more or less uniform and lighting it with a flickering light. The nerve cells are then forced to work in unison at the frequency of the flicker, and we can record their electrical activity through the skull up to frequencies of about 30 a second. This gives us a method of tracing the visual messages in the brain, for by means of the flicker rhythm they can be made easy to recognize” (Adrian, 1944, p. 361).
Thanks to the subsequent application of Fourier analysis to EEG recordings (Regan, 1966), these “frequency-tagged” neural responses can be investigated in the frequency domain in various sensory modalities in neurotypical adults, but also in developmental and clinical populations (Regan, 1989; see Norcia, Appelbaum, Ales, Cottereau, & Rossion, 2015 for a recent review in vision research). The main advantages of this approach are its objectivity (i.e., responses are identified at a frequency known by the experimenter) and high sensitivity (i.e., high SNR) (Norcia et al., 2015; Regan, 1989; Rossion, 2014). Moreover, by carefully manipulating the nature of the stimulus property that is periodically modulated, sensory processes, but also higher-level brain processes such as face or word categorization for instance (e.g., Lochy, Van Belle, & Rossion, 2015; Rossion & Boremanse, 2011), can be selectively tracked in all modalities.
Despite these advantages, to our knowledge, the frequency-tagging approach has never been applied to simultaneous EEG and intracerebral recordings in order to shed light on the relationship between the two types of signals.1 Here we report simultaneous frequency-tagged scalp and intracerebral EEG responses in a unique epileptic patient implanted with three intracerebral electrodes (27 recording contacts) in the right occipitotemporal (OT) cortex and equipped simultaneously with 27 scalp electrodes on the scalp surface. Thanks to a fast periodic (6 Hz) visual stimulation with highly salient stimuli (faces), we objectively relate the quantified face-evoked responses observed inside and outside the brain. Specifically, we address the following questions: (a) How do objectively related signals recorded simultaneously inside the brain and on the scalp differ in terms of amplitude and SNR? and (b) Can frequency-tagging significantly improve the precise identification of the sources of activity recorded on the scalp?
2 MATERIALS AND METHODS
The epileptic patient, as well as the recording settings, are identical to those reported in Jacques et al. (2019). The patient has also been described in Jonas et al. (2014). Therefore, a shortened version of the methods is reported here.
2.1 Case description
KV is a right-handed female suffering from refractory occipital epilepsy related to a focal cortical dysplasia involving the right lingual gyrus and posterior collateral sulcus. The patient was 32 year-old at the time of testing. Her case was also reported as evidence of strong face identity repetition suppression effects in the lateral cortex of right IOG using fast periodic visual stimulation (FPVS) with unfamiliar faces (Jonas et al., 2014).
2.2 Simultaneous intracerebral—Scalp EEG recordings
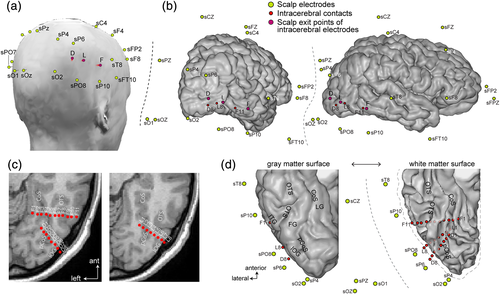
The patient underwent simultaneous intracerebral and scalp EEG recordings. The co-locations of these electrodes are shown in Figure 1. The originality of electrode placements is a relatively dense spatial coverage of the occipital-temporal cortex with both intracerebral (27 intracerebral contacts) and surface electrodes (including sO1, sOz, sO2, sPO7, sPO8, sP9, sP10, sP5, sP6).
2.2.1 Intracerebral electrodes
The patient was stereotactically implanted with three intracerebral multicontact electrodes targeting the right ventral OT cortex, according to a well-defined and previously described procedure (Jonas et al., 2016; Salado et al., 2018). Each intracerebral electrode consists of a cylinder of 0.8 mm diameter and contains 8–11 independent recording contacts of 2 mm in length separated by 1.5 mm from edge to edge and by 3.5 mm center to center (DIXI Medical, Besançon, France). Electrodes D and L (eight recording contacts each: D1–D8 and L1–L8) sampled the right inferior occipital gyrus and posterior collateral sulcus. Electrode F (11 contacts, F1–F11) was more anterior and went from the right inferior temporal gyrus to the lingual gyrus. All intracerebral contacts except D8 were in direct contact with the gray matter. The recording surface of contact D8 was located ~2 mm from the cortical surface, likely within the meninges (Figure 1c,d).
2.2.2 Scalp electrodes
Simultaneous scalp EEG recordings were acquired with 28 Ag/AgCl electrodes of 10 mm diameter placed according to the 10–20 system (Figure 1, Seeck et al., 2017) using sterile procedures, with a particular spatial coverage of bilateral OT regions. Some of the posterior electrodes were slightly displaced relative to the 10–20 positions due to the presence of depth electrodes. Scalp electrode positions were determined using a 3D digitizer system (3 space Fastrak, Polhemus, Colchester, VT).
2.2.3 Recordings
Simultaneous SEEG—scalp EEG signals were recorded at a 1,024 Hz sampling rate with a 128-channel amplifier (SD LTM 128 Headbox; Micromed, Italy). The reference electrode was a prefrontal midline scalp electrode (sFPz). The recording of the periodic visual stimulation experiment reported here was performed 2 days after the scalp electrode placement. Due to the low diameter of the skull defect at the penetration points of intracerebral electrodes (1.2 mm) and the low electrical conductivity of the guidance screw (titanium), no leakage of current was observed in scalp EEG recordings.
2.3 FPVS
2.3.1 Rationale
The main aspects of the procedure for this experiment have been previously described in three different studies comparing the presentation of trains of different faces to identical faces at a fixed frequency rate (Jonas et al., 2014; Rossion & Boremanse, 2011; Rossion, Prieto, Boremanse, Kuefner, & Van Belle, 2012). From a methodological perspective, this FPVS approach—which leads to so-called steady-state visual evoked potentials (SSVEPs, Regan, 1989, Regan, 1966)—has multiple advantages: objectivity of definition and quantification of the response of interest, high SNR, short duration of the experiment, and recording of the response of interest during a simple incidental task (Regan, 1989; Rossion, 2014), making it a tool of choice for the study of patients implanted with intracerebral electrodes. Here, faces were presented at a 6 Hz rate because this frequency rate provides the largest repetition suppression effect on the scalp over the right OT cortex (Alonso-Prieto, Van Belle, Liu-Shuang, Norcia, & Rossion, 2013), as well as in face-selective areas of the right inferior occipital gyrus and middle section of the lateral fusiform gyrus (Gentile & Rossion, 2014).
2.3.2 Stimuli
Full-front color face pictures of 18 unfamiliar individuals (7° × 10° of visual angle for the base face size) equalized for global luminance were used. These face stimuli were the same as used in previous studies (Alonso-Prieto et al., 2013; Rossion & Boremanse, 2011) and taken from a well-known set of laser-scanned faces from the Tubingen Max Planck Institute (MPI) database of laser-scanned (Cyberware TM) human heads. They were cropped to remove external features (hair and ears) but their overall shape was preserved.
2.3.3 Procedure
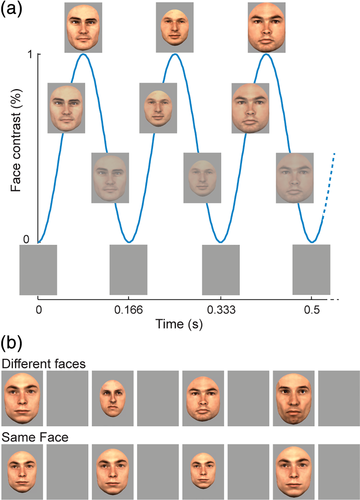
In each condition, a face stimulus appeared and disappeared (sinusoidal contrast modulation) on the screen, at a stimulation rate of six faces per second (one face every 166.66 ms; Figure 2). A trigger was sent to the parallel port of the EEG recording computer at each minimal level of visual stimulation (gray background), using a photodiode placed on the left upper corner of a laptop monitor. In the same face condition, a randomly selected face picture was presented repeatedly during the whole stimulation duration (70 s). In the different faces condition, the sequence started with the repeated presentation of a randomly selected face picture for the first 15 s, after which the face identity changed at every cycle for the remainder of the sequence (i.e., from 16 to 70 s, see Rossion et al., 2012). In these different faces condition, 18 individual faces of the same sex were used and presented in random order. The same face identity never appeared twice in a row, so that the face identity change rate was always 6 Hz. To minimize repetition suppression effects due to low-level visual cues, the face stimulus changed substantially in size with each presentation, that is, at a rate of 6 Hz, in all conditions (random face size between 82 and 118% of base face size). The experiment consisted of four sequences of 70 s: each condition (same face or different faces) was repeated two times (face gender: male or female). The order of conditions was randomized. During each 70 s run, the patient was instructed to fixate on a small black cross located centrally on the face, slightly below the bridge of the nose. The fixation cross changed color (black to red) briefly (200 ms) 6 to 8 times during each run and the patient was instructed to report the color changes by pressing a response key.
2.4 Data processing and analyses
2.4.1 Frequency domain analyses
All analyses were performed using Letswave 5 (Mouraux & Iannetti, 2008) and MATLAB v7.8 (The Mathworks, Inc.). Segments of 50 s of recording during visual stimulation (i.e., 300 face stimulation cycles at 6.0 Hz) from 17 to 67 seconds were considered for analysis. These segments were cropped to contain an exact integer number of 6 Hz cycles. Segments were averaged in the time domain separately for each condition and a Fast Fourier Transform (FFT) was applied to these averaged segments to compute the amplitude and phase spectra at a high spectral resolution of 1/50 = 0.02 Hz. SNR was computed from the amplitude spectra as the ratio between the amplitude at each frequency bin and the average amplitude of the corresponding 20 neighboring bins (up to 11 bins on each side, i.e., 22 bins, but excluding the 2 bins directly adjacent to the bin of interest, i.e., 20 bins, e.g., Rossion et al., 2012). Significant responses above noise level at the stimulation frequency at each channel were defined by computing Z-scores on the amplitude spectra, using the mean and SD of the 20 neighboring bins around the frequency of interest (e.g., Liu-Shuang, Norcia, & Rossion, 2014). Statistical comparisons between conditions were similarly made by computing Z-scores on amplitude spectra obtained by subtracting the spectra measured in the same face condition from the spectra measured in the different faces condition.
2.4.2 Time domain analyses
For this and further analyses, we only used data from the different faces condition which generated the largest responses both in scalp and intracerebral recordings. Each recording sequence from 17 to 67 s relative to sequence onset was divided into epochs of 1 s duration centered on the appearance of a face. Epochs containing blinks were rejected and remaining epochs were averaged and the mean amplitude was centered on zero (dc correction).
2.4.3 Correlation between intracerebral and scalp EEG signals
We examined the relationship between visually-driven signal recorded at intracerebral contacts relative to scalp electrodes by correlating the variations of the 6 Hz response amplitude over time across all scalp electrodes and intracerebral contacts (Figure 3).
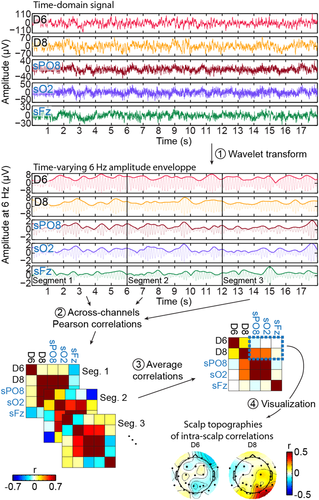
We first applied a Morlet wavelet transform on the raw signal to compute the time-varying amplitude envelope of the electrophysiological signal around 6 Hz. The parameters of the mother wavelet (central frequency: 6 Hz, full width at half maximum [FWHM] in the frequency-domain = 0.8 Hz; FWHM in the time domain = 0.47 s) were chosen to provide a relatively high frequency resolution while preserving the dynamic in the amplitude variation over time. We kept the amplitude envelope from 15 to 69 s from each recording sequence and divided the envelope from each sequence in 9 segments of 6 s, resulting in 18 segments in total (2 sequences with 9 segments). Then, for each intracerebral contact, the signal in each segment was correlated (Pearson's coefficient) with the corresponding segment in each scalp electrode and the correlations were averaged across the 18 segments, resulting in a 27 (intracerebral) × 27 (scalp) correlation matrix. We also computed the across-segments SD of the correlation coefficients. We determined whether correlations were significantly different from zero using a randomization procedure in which, for each electrode, we randomly shuffled (5,000 times) the order of the 6 s segments prior to computing correlations and averaging the correlations across segments. For each intracerebral contact correlated with all scalp electrodes, we determined significance using a cluster-based correction (cluster-mass) for multiple comparisons (Maris & Oostenveld, 2007; Pernet, Latinus, Nichols, & Rousselet, 2015) with a cluster-forming threshold of p < .05. Note that the wavelet analysis used here removes the phase information so that the correlations across channels are only determined by the variation of amplitude across time at each channel. Disregarding the phase information for this inter-channel correlation analysis is crucial to avoid correlations being driven by simple phase coherence across channels triggered by a common stimulation.
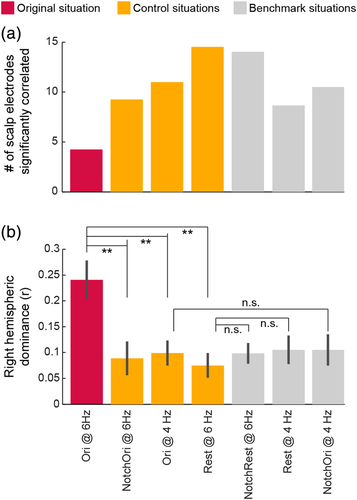
Even if we observe significant scalp-intracerebral correlations, they could still occur because scalp and intracerebral channels are sensitive to the same electrophysiological responses (i.e., generated by a common cortical territory) unrelated to the FPVS stimulation. To determine whether the pattern of scalp-intracerebral correlations obtained using the original signal at the stimulation frequency during FPVS (Ori@6 Hz) is specific to the signal with visual stimulation, we compared this correlation pattern with patterns obtained in several control situations: (a) NotchOri@6 Hz: Pattern of scalp-intracerebral correlations with the visually-driven signal filtered-out from the original signal using a narrow notch filter (butterworth notch filter order 4: [5.9–6.1] Hz); (b) Ori@4 Hz: Pattern of correlations on the original signal using the amplitude envelope at another frequency than the stimulation frequency (i.e., 4 Hz); (c) Rest@6 Hz: Pattern of correlations obtained in (S)EEG recording where no periodic visual stimulation was presented and the patient was resting with eyes open. In this third control situation (rest), sections of the amplitude envelope corresponding to eye blinks were removed prior to computing the correlations. Correlations during rest were computed using 44 segments of 6 s.
We also used further benchmark tests for the control situations to evaluate the effect of notch filtering and of using a different analysis frequency on the correlation patterns. We reasoned that if the difference in the correlation patterns obtained in the Ori@6 Hz versus the control situations is due to the notch filtering or to the use of a different analysis frequency rather than to FPVS, then we should observe similar differences when applying notch filtering or using a different frequency on signal which does not contain a visually-driven periodic response. The benchmark situations to evaluate the effect of notch-filtering on the patterns of correlations were the following: (a) NotchOri@4 Hz: correlations using amplitude envelope at 4 Hz when the original signal has been notched filtered at 4 Hz ([3.9–4.1] Hz); (b) NotchRest@6 Hz: correlations using amplitude envelope at 6 Hz when the signal during rest has been notched filtered at 6 Hz ([5.9–6.1] Hz). The benchmark situation to evaluate the effect of using the amplitude envelope at a different frequency was the following: (c) Rest@4 Hz: correlations using the amplitude envelope at 4 Hz from the signal recorded during rest.
The pattern of correlations in the original, control and benchmark situations were summarized and statistically compared by computing an index of right-hemispheric lateralization: we subtracted the correlations averaged over left-hemispheric OT scalp electrodes from the correlations averaged over corresponding electrodes in the right hemisphere (sO2, sPO8, sP4, and sP10). These indices were compared against zero and against each other using a permutation test (10,000 permutations).
3 RESULTS
3.1 Patient KV shows a significant and typical synchronization to 6 Hz face identity stimulation on the scalp
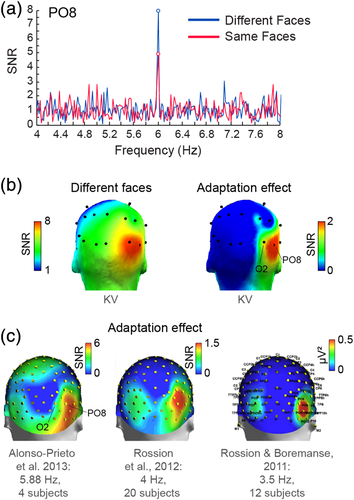
Fast periodic face stimulation generated robust and significant (z-score > 2.33, p < .01, one-tailed) visual responses over patient KV's scalp as evidenced by the distinct peak in the EEG spectrum at the 6 Hz stimulation frequency (Figure 4a). As in typical subjects (Alonso-Prieto et al., 2013; Rossion et al., 2012; Rossion & Boremanse, 2011), the EEG response in the different faces condition was clearly strongest over right OT electrodes (largest at sO2: 0.67 μV and sPO8: 0.63 μV). In addition, scalp topographies of the identity adaptation effect (i.e., larger amplitudes in the different faces relative to the same face conditions) revealed an even more focused positive difference at right OT electrodes (Figure 4b) with a maximum at sPO8 (0.23 μV). The adaptation effect was statistically significant at two scalp electrodes, sPO8 and sP10 (z-scores: 3.870 and 3.02, respectively; ps < .01, two-tailed). These observations largely replicate findings from healthy subjects using a similar experimental procedure (Alonso-Prieto et al., 2013; Rossion et al., 2012; Rossion & Boremanse, 2011; see also Liu-Shuang et al., 2014; Figure 4c), and suggest that patient KV's electrophysiological responses related to (unfamiliar) face individuation are typical. Further, this demonstrates that significant functional responses can be obtained from the scalp with the FPVS approach in single epileptic patient tested for a few minutes only.
3.2 Corresponding spatial location of maximal response amplitude to faces between scalp and intracerebral EEG recordings
A detailed report of periodic intracerebral responses recorded in the same face and different faces conditions in patient KV's right OT cortex is described in Jonas et al. (2014). Here, for comparison with scalp recordings, we will summarize responses measured in the different faces condition and the effect of identity adaptation.
In intracerebral recordings, we found robust responses to the visual presentation of different faces at the 6 Hz stimulation frequency (Figure 5a,b) in ventral and lateral sections of the occipital and posterior temporal cortex. SEEG Responses were significantly above noise (all zs > 3.45, ps < .001) for all contacts except three adjacent contacts of electrode F (F9 to F11). The largest responses were measured in contacts located in the posterior section of the collateral sulcus (D1 to D5 and L1 to L5, amplitude range: 0.7 to 6.9 μV, mean amplitude: 2.8 μV, Figure 5b) and the lateral section of the inferior occipital gyrus (D6 to D8 and L6 to L8, amplitude range: 4.4 to 7.6 μV, mean amplitude: 5.8 μV). Responses in electrode F, going through the CoS (F1 to F5), occipitotemporal sulcus (F6 to F10) and posterior inferior temporal gyrus (F11) were overall much weaker (amplitude range: 0.4 to 2.5 μV, mean amplitude: 1.3 μV). SEEG responses also displayed a significant face identity adaptation effect (larger response in the different faces condition; z > 2.33, p < .01 Figure 5c) at contacts in or near the right lateral IOG (D5, D7, D8, L7, and L8: mean amplitude for different faces: 5.8 μV, mean amplitude for same face: 3.2 μV) or more anterior contacts in the CoS (F3) or in the OTS above the lateral fusiform gyrus (F7, F8, ~8 mm from the cortical surface of the lateral fusiform gyrus).
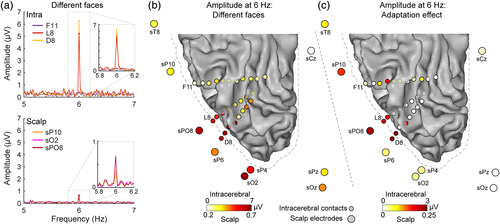
Importantly, there is a correspondence in the spatial location of intracerebral contacts and scalp electrodes showing the strongest response in the different faces condition, or the strongest effect of adaptation. First, in the different faces condition (Figure 5b), the scalp electrodes displaying the strongest scalp EEG responses were the closest to the intracerebral contacts in lateral IOG (sPO8, sO2, sP6, sP4 scalp electrodes; Euclidean distance to D8 = 27, 26, 32, and 43 mm, respectively; Euclidean distance to L8 = 28, 35, 33, and 46 mm, respectively). Second, the adaptation effect in intracerebral recording was maximally measured at two separate cortical locations: around the lateral IOG (D5, D7, D8, L7, and L8 contacts) and more anteriorly in the OTS above the lateral fusiform gyrus (F7, F8 contacts). Interestingly, this pattern of intracerebral response was associated with a maximal adaptation effect on the scalp over slightly more anterior electrodes (e.g., sP10) compared to the response in the different faces condition: scalp electrode sPO8 was closest to intracerebral contacts in the lateral IOG and scalp electrode sP10 was closest to intracerebral contacts in the lateral fusiform gyrus compared to contacts in lateral IOG (Euclidean distances from sP10 = 35 mm to F8, 45 mm to L8, and 51 mm to D8).
3.3 Strong amplitude and SNR attenuation in scalp compared to intracerebral EEG
While we observed a spatial correspondence of the largest responses in scalp and intracerebral recordings, the amplitude measured on the scalp was very much attenuated relative to the intracerebral signal (Figure 5a, compare top and bottom plots). Indeed, relative to intracerebral contacts D8 and L8 where the amplitude at 6 Hz in the different faces condition was 6.3 and 5.2 μV respectively, the amplitudes at the closest scalp electrodes sO2 and sPO8 were 0.67 and 0.63 μV respectively, which is between 7.7 and 9.9 times smaller than the corresponding intracerebral signal. Interestingly, the SNR at the stimulation frequency (i.e., 6 Hz) was less attenuated than the absolute signal amplitude when comparing scalp to intracerebral recordings. SNR was between 2 and 3.5 times lower in scalp (SNR = 8.3 and 8.1 for sO2 and sPO8, respectively) compared to intracerebral (SNR = 29 and 16.7 for D8 and L8, respectively) recordings. This is due to the signal amplitude being comparatively more attenuated from intracerebral to scalp recordings than the mean noise amplitude in frequency bins around 6 Hz (mean noise at D8/L8 = 0.26 μV; mean noise at sO2/sPO8 = 0.08 μV; ratio of intracerebral to scalp noise = 3.4).
3.4 Focal correspondence between intracerebral and scalp EEG signals over the right occipitotemporal cortex
3.4.1 Phase investigation
For the remainder of the analyses, we will focus on the signal measured in the different faces condition, as it generated the strongest responses over the right OT cortex, in contrast to the same face condition which generated low responses over OT regions and a maximal response over medial occipital regions (Supplementary Figure S1) as in previous publications (Alonso-Prieto et al., 2013; Rossion et al., 2012; Rossion & Boremanse, 2011). This latter condition is therefore sub-optimal to investigate the relationship between intracerebral and scalp responses in the OT region. Moreover, this avoids relying on a post hoc subtraction of conditions (i.e., adaptation effect), which provided an optimal opportunity to investigate the relationship between simultaneously recorded intracerebral and scalp EEG.
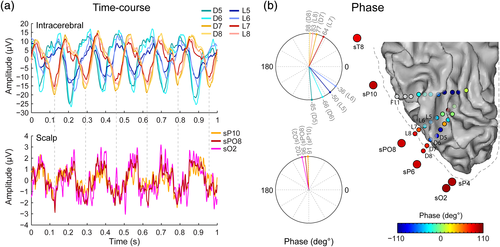
To further characterize the relationship between intracerebral and scalp recordings, we computed the phase of the signal at the stimulation frequency for intracerebral and scalp channels and visualized the signal in the time domain (Figure 6). Phase provides additional information about response timing and allows to further characterize the relationship between neighboring recording sites. For instance, perfect phase alignment or phase-reversal (i.e., 180° difference) at two separate recording sites is indicative of a common neural source generating the signal measured at the two sites. This revealed that although lateral contacts of the D and L electrodes (D5–D8 and L5–L8) all exhibited strong visual responses at the stimulation frequency (Figures 5 and 6), only the four most lateral contacts (D7–D8, L7–L8) were in phase with the signal measured at nearby scalp electrodes (Figure 6). The signal of adjacent—more medial—contacts (D5–D6, L5–L6) was out of phase relative to the more lateral contacts. This is clear when visualizing data in the time domain (Figure 6a), where the crests and troughs of the responses measured at the most lateral intracerebral contacts (D7–D8, L7–L8) are temporally aligned with responses measured at the scalp, but misaligned with signal measured at more medial contacts (D5–D6, L5–L6). This is also reflected in the phase of the frequency spectra (Figure 6b), where the phase values are similar between D8/L8 and right OT scalp electrodes (sO2, sPO8, sP10, mean phase difference: 11°), but very dissimilar between contiguous contacts D5–D6 and D7–D8 (mean phase difference: 158°) and between L5–L6 and L7–L8 (mean phase difference: 116°). The observation of only a partial phase opposition between these two groups of intracerebral contacts (i.e., rather than a phase difference close to 180°) suggests that the signal measured at these two groups arises from partly distinct generators. Only one of these neural generators, the generator contributing to the signal at lateral IOG contacts (D7–D8, L7–L8), also contributes to the EEG signal measured at OT scalp electrodes.
3.4.2 Correlation investigation
To directly and formally quantify the relationship between scalp and intracerebral signals, we correlated the variations of the 6 Hz response amplitude over time across all scalp and intracerebral contacts (Figure 3, methods). As a reminder, this analysis disregards phase information so that only coordinated temporal variation of amplitude across channels could result in meaningful correlation coefficients. This was done to avoid correlations (positive or negative) driven simply by phase coherence across channels triggered by a common visual stimulation.
While the temporal variations of the amplitude of the 6 Hz response were strongly correlated between contacts D5–D6/L5–L6 and between contacts D7–D8/L7–L8, the 6 Hz signal was not correlated between these two groups of adjacent contacts. Specifically, correlations were high between contacts D5, D6, L5, and L6 (both within electrode: r = 0.84 ± 0.07 and 0.82 ± 0.13 for D5–D6 and L5–L6, respectively, and across the D and L electrodes: r = 0.5 ± 0.26 and 0.42 ± 0.22 for D5–L5 and D6–L6, respectively) and between contacts D7, D8, L7, and L8 (within electrode: r = 0.97 ± 0.03 and 0.76 ± 0.16 for D7–D8 and L7–L8, respectively, and across the D and L electrodes: r = 0.5 ± 0.23 and 0.68 ± 0.16 for D7–L7 and D8–L8, respectively). In contrast, there was no meaningful correlation between signals at immediately adjacent contacts D6–D7 (r = 0.08 ± 0.28) and L6–L7 (r = 0.02 ± 0.27). Thus, these analyses support our view that despite the partial phase opposition between contacts D5–D6/L5–L6 and contacts D7–D8/L7–L8 (Figure 6), the signal measured at these two groups of contacts arises from different cortical generators.
In addition, these analyses confirmed and refined our observation above that signal measured at right OT scalp electrodes arises mainly from regions in the lateral IOG around contacts D7–D8 and L7–L8 rather than from more medial cortical regions around contacts D5–D6, L5–L6. Indeed, we observed a very focal pattern of positive correlations between contacts D/L 7–8 and right OT scalp electrodes closest to the location of the corresponding intracerebral contacts (Figure 7a). Statistical analyses indicated that the 6 Hz signal at each of these four intracerebral contacts was significantly correlated with a cluster of 4 to 5 scalp electrodes. D7, D8, L7, and L8 were each significantly correlated with sPO8, sO2, sP10, and sP4, and L7 was also significantly correlated with sP6. Among these channels, Pearson's coefficients ranged from 0.32 (SD across segments: ± 0.25) to 0.37 ± 0.23 for sPO8, from 0.28 ± 0.28 to 0.36 ± 0.22 for sO2, from 0.19 ± 0.22 to 0.25 ± 0.19 for sP4 and from 0.17 ± 0.29 to 0.21 ± 0.31 for sP10. In contrast, correlations of the same scalp electrodes with intracerebral contacts D5–D6, L5–L6 were around zero (range of correlations: −0.11 ± 0.25 to −0.02 ± 0.22). Moreover, these positive correlations were restricted to the right hemisphere: the correlations for contacts D7–D8, L7–L8 with electrodes in the OT left hemisphere (sO1, sPO7, sP9, sP7) ranged from −0.08 to 0.11 (mean r = 0.01 ± 0.24).
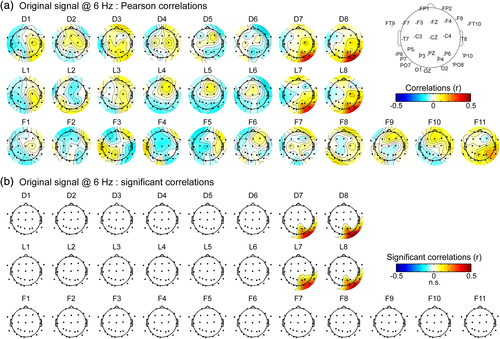
Correlations were slightly but significantly higher (t[8] = 7.6, p < .001) for the most external contact (D8, L8, mean r across channels: 0.28) relative to the immediately adjacent more internal contact (D7, L7, mean r across channels: 0.25).
Over the more anterior F electrode, only the signal from F11 tended to be correlated with surrounding scalp electrodes (Figure 7a, sP10: r = 0.2 ± 0.25; sP6: r = 0.2 ± 0.3; sPO8: r = 0.18 ± 0.33; sT8: r = 0.14 ± 0.3). However, these correlations did not reach significance at the cluster level.
3.5 Focal and right-lateralized intracerebral-scalp correlations are specific to the FPVS signal
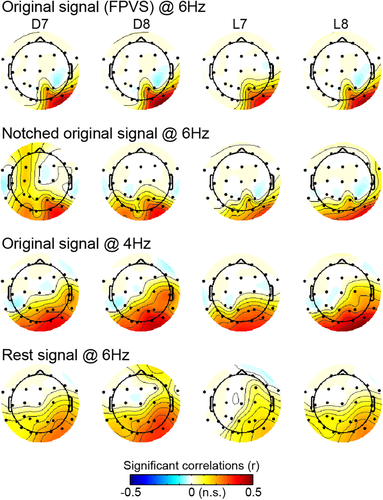
The observed correlations suggest that these scalp and intracerebral channels pick up electrophysiological responses coming from the same cortical region responding to the periodic visual stimulation. However, these correlations may also be driven by a general electrophysiological activity (i.e., unrelated to the stimulation) coming from cortical territories to which both intracerebral contacts and scalp electrodes are sensitive to, given their spatial proximity. If this is the case, we should observe the same correlation pattern with or without the presence of a visually-driven response in the recorded electrophysiological signal. We, therefore, compared the patterns of scalp-intracerebral correlations obtained at the stimulation frequency during periodic visual stimulation (Ori@6 Hz) with a series of “control” situations: (a) NotchOri@6 Hz: Pattern of correlations when the visually-driven signal has been selectively filtered-out; (b) Ori@4 Hz: Pattern of correlations at another frequency than the stimulation frequency (4 Hz); (c) Rest@6 Hz: Pattern of correlations obtained using 6 Hz signal recorded during a rest period. These analyses revealed that intracerebral-scalp correlations were more focal when a visually-driven periodic response was present in the electrophysiological signal. Specifically, in the three control conditions, while the patterns of scalp correlations measured for intracerebral contacts D7–D8 and L7–L8 were overall similar to the one observed at 6 Hz using the original signal, these patterns were all more widespread and included significant correlations on the scalp both in the right and the left hemisphere (Figure 8). This observation was reflected in the larger number of scalp electrodes significantly correlated with each intracerebral contacts—D7, D8, L7, and L8—in the three control situations (mean number of significant scalp electrodes across D7, D8, L7, and L8 = 9.25 to 14.5, Figure 9a) compared to the original FPVS condition (Ori@6 Hz: 4.25 significant scalp electrodes). In addition, the right hemispheric dominance of the correlations pattern when using the original signal at 6 Hz was assessed and compared to control conditions by subtracting the correlations averaged over left-hemispheric OT scalp channels from the correlations averaged over corresponding electrodes in the right hemisphere (sO2, sPO8, sP4, sP10). This revealed that, while scalp correlations were significantly stronger in the right than in the left hemisphere in all conditions (all p's < .02, one-tailed permutation test, Figure 9b), the right hemispheric dominance was significantly stronger when using the signal at 6 Hz in the original signal where periodic visual stimulation is present (Ori@6 Hz: right hemispheric dominance = 0.24 ± 0.16) compared to the three control situations (0.09 ± 0.14, 0.1 ± 0.1, 0.1 ± 0.13, all p's < .005, one-tailed permutation test). In contrast, there was no significant difference among any of the control and additional benchmark situations (p’s > 0.5, Figure 9b, see methods for benchmark situations).
4 DISCUSSION
This study shows that a few minutes of periodic visual stimulation suffice to generate a robust signal, objectively identifiable at the exact frequency of stimulation (and harmonics) in the frequency spectrum of both SEEG and EEG signals recorded simultaneously. Here we find in the single epileptic patient tested that the response peaks over the right occipitotemporal scalp region, as in neurotypical participants tested with this paradigm (Figure 4), suggesting the generalizability of the present observations to the normal population. By combining FPVS with correlation analyses we thus provide an original approach to investigate the relationship between functional brain electrophysiological activity measured simultaneously inside the brain and on the scalp.
Quantification of the 6 Hz response in the frequency domain is straightforward and reveals a tenfold decrease of amplitude at 6 Hz between the most external intracerebral contacts and the nearest scalp EEG electrodes (i.e., 25–30 mm), providing unique information about skull attenuation of electrophysiological activity (Oostendorp, Delbeke, & Stegeman, 2000; Wendel, Vaisanen, Seemann, Hyttinen, & Malmivuo, 2010). The choice of the 6 Hz stimulation frequency was dictated by previous studies showing robust responses at this frequency for face stimulation, in particular when different face identities are presented at every stimulation cycle (Alonso-Prieto et al., 2013). Note that this attenuation might even be underestimated, given that the intracranial sampling was limited and that larger responses might have been found at other nearby locations inside the brain. Nevertheless, the attenuation in SNR between intracerebral and surface EEG responses was of “only” 2–3.5. This reduced ratio indicates that the electrophysiological noise, as computed as in the present study, is significantly larger inside than outside the brain. A major factor contributing to this reduction of the ratio between amplitudes and SNR is that, rather than being computed over a prestimulus baseline as in standard ERP studies, electrophysiological noise is computed here within a small theta range frequency around the signal of interest that is, 6 Hz (Meigen & Bach, 1999; Rossion et al., 2012; Srinivasan, Russell, Edelman, & Tononi, 1999). Hence, EEG noise is “free” of alpha activity, environmental noise, eye and muscle artifacts, and so forth which typically greatly contaminate scalp EEG signals (Luck, 2014). Additionally, the cortical surface to which an EEG scalp electrode is sensitive to is likely larger than that of an SEEG electrode. Noise in scalp EEG might thus be smaller compared to SEEG by virtue of averaging uncorrelated electrophysiological “noise” over a larger surface.
The narrow band of the 6 Hz signal allows objective and finer-grained tracking of the phase and identification of the intracerebral electrodes generating that signal on the scalp. Using FPVS in relation with our correlation approach, we found that activity recorded over right OT scalp regions directly relates to the activity measured at intracerebral contacts located in the inferior occipital gyrus either in the cortex (D7, L7, L8) or in the meninges (D8). This latter intracerebral contact likely receives electrical field propagation from the nearby cortex (i.e., about 2 mm distance) (Zaveri, Duckrow, & Spencer, 2009). This strongly suggests that one major neural source for the 6 Hz FPVS signal measured on the scalp is located in the inferior occipital gyrus at or near contacts D7–D8 and L7–L8. Other sources in neighboring location likely also contribute to the measured scalp activity, but they could not be captured here due to the limited intracerebral sampling in the clinical case. Nevertheless, the main contribution of lateral brain sources to scalp EEG by comparison to medial sources is in line with previous studies in epilepsy and especially in mesial temporal lobe epilepsy (Koessler et al., 2015; Merlet et al., 1998).
The identification of the right OT scalp region is similar to our findings in a previous study measuring the relationship between the face-evoked N170 potential on the scalp and in the cortex in the same epileptic patient (Jacques et al., 2019). However, this relationship was relatively more widespread on the scalp in the previous ERP study (see Figures 5 and 6 in Jacques et al., 2019) compared to the current study. Specifically, in the previous study, significant correlations involved up to six scalp electrodes (right OT and medial occipital) when correlating N170 latency and up to 11 scalp electrodes (bilateral OT and medial occipital) when correlating N170 amplitude, while the relationship found here with the frequency-tagging approach was restricted to four scalp electrodes (Figure 7).
Notwithstanding this comparison across studies of the spatial spread of the correlations on the scalp, it should be noted that differences in the experimental design, in the type of signal used to compute the correlations and in the analyses schemes prevent a more formal comparison across the current and the previous study. For instance, in the current study, the use of FPVS allows taking into account the amplitude variations in a relatively narrow frequency range (i.e., around 6 Hz), which is less affected by ongoing broadband EEG noise (mostly in the theta and alpha range) compared to when using the ERP signal as in the previous study. Such broadband noise in the ERP signal may be correlated across a large cortical surface (e.g., Buzsáki, 2002; Klimesch, 1999; Miller, Foster, & Honey, 2012), therefore being picked up simultaneously by intracerebral contacts in the IOG and by many posterior scalp electrodes, resulting in a broad correlation pattern on the scalp. Therefore, while the cortical regions involved in generating the N170 and the 6 Hz FPVS face signals are likely similar given the overall similarity in the scalp topographies of the correlations (irrespective of their spatial spread) across the two studies, the FPVS approach allows revealing a more focused relationship between scalp and intracerebral recordings.
In addition, we demonstrate that the relationship between scalp and intracerebral channels at 6 Hz is significantly more focal and right-lateralized during FPVS as compared to rest EEG or during stimulation but considering a frequency range outside the stimulation frequency (i.e., around 4 Hz). Hence, this relationship is specific to the stimulation frequency and cannot be attributed to general factors such as an increase of arousal during visual stimulation for instance. Moreover, other benchmark control situations (Figure 9) further indicate that the specificity of this relationship during FPVS is not driven by analyses or testing parameters. Note that since we did not stimulate with other frequencies, whether 6 Hz provides the tightest correlation between scalp and intracerebral activity cannot be determined in the present study—although this is likely given the particularly large response that it generates in this paradigm (Alonso-Prieto et al., 2013).
A peculiar observation is the broader pattern of correlations for control situations, such as when using a different frequency of analysis (i.e., Ori@4 Hz), compared to when using FPVS. One might have expected no or reduced correlations in control situations when no visual response is present in the signal at the frequency of analyses. The observation of a correlation for the control situations likely stems from the close spatial proximity between scalp right OT electrodes and the most lateral intracerebral contacts, which makes it likely that these recording channels are sensitive to a similar cortical territory. This would result in correlations across channels inside the brain and on the scalp stemming from the fact that they are sensitive to the same ongoing cortical EEG activity unrelated to a visual response (i.e., “noise”). As indicated above, this EEG “noise” in the theta and alpha range (e.g., Buzsáki, 2002; Klimesch, 1999; Miller et al., 2012) is more likely to correlate across a larger brain surface than neural signal related to the visual stimulation, therefore being measured over a broader scalp surface. This would yield patterns of correlations that are more broadly distributed on the scalp over both hemispheres. This phenomenon is also likely to take place in the control situation where the visually-driven signal at 6 Hz was removed using a very narrow notch filter (i.e., NotchOri@6 Hz). In this particular situation, one possibility is that when the visually-driven 6 Hz signal is filtered out, the variations of the wavelet amplitude envelope across time (which is used to obtain the correlations) are related to other frequencies around 6 Hz (i.e., theta range) that fall within the frequency bandwidth of the wavelet at 6 Hz (full width at half maximum in the frequency-domain at 6 Hz is 0.8 Hz), resulting in broad scalp correlation patterns. In contrast, when visually-driven signal at 6 Hz is present (Ori@6 Hz), it completely dominates over surrounding frequencies in the amplitude envelope, allowing to reveal the more local neural activity specifically related to face periodic stimulation.
Several studies (Cosandier-Rimele, Merlet, Badier, Chauvel, & Wendling, 2008; Ebersole, 1997; Ramantani et al., 2014; Tao, Ray, Hawes-Ebersole, & Ebersole, 2005) have shown that a large cortical surface from 6 to 30 cm2 is required to generate detectable scalp EEG signals. According to a recent computational study (Cosandier-Rimele et al., 2008), a cortical surface of 26cm2 is required to obtain a SNR equal to eight in scalp EEG, corresponding roughly to the SNR observed in our study. However, the FPVS approach is known to generate extremely high SNR responses on the scalp, so that more focal sources in the lateral section of the inferior occipital gyrus, corresponding to smaller cortical patches, may have been sufficient to generate this response. While fMRI studies indicate that the (right) IOG plays a key role in (unfamiliar) face individuation responses in the human brain (e.g., Gauthier, Tarr, Moylan, Skudlarski, & Gore, 2000; Schiltz et al., 2006), these responses are not confined to this region but extend to more anterior regions of the lateral fusiform gyrus. Although these regions may also contribute to the signal recorded on the scalp, the cortical orientation of the lateral fusiform gyrus makes it unlikely for this region to majorly contributes to the EEG measured over lateral OT cortex scalp regions (Jacques et al., 2019).
While simultaneous scalp and intracerebral studies very often rely on relatively complex signal processing methods (e.g., blind source separation) to extract biomarkers from scalp background activity (Koessler et al., 2015; Pizzo et al., 2019), the spontaneous visibility (i.e., even without averaging method or baseline correction method) of the scalp responses during FPVS highlights the interest of this approach to clarify the scalp EEG correlates of focal cortical generators. Therefore, compared to signal analysis performed in time domain and on spontaneous activity (like epileptic spikes or seizures), FPVS in combination with our correlation approach may represent a major tool in order to understand and characterize the link between cortical source activity and scalp EEG signals. Moreover, our observation of robust intracerebral vs. scalp EEG correlations with just two sequences of stimulation (2 × 50 s of data) is a clear advantage over more conventional stimulation approach in clinical settings where these recordings take place. Given that we report data from a single patient implanted with three intracerebral electrode arrays, this approach should be further validated to ensure its applicability in different experimental research domains and settings. Nevertheless, the frequency-tagging approach is readily used to measure a wide range of responses in the visual domain (e.g., to luminance or contrast changes, but also visual words, quantities, or objects, Norcia et al., 2015) and in other modalities (e.g., low-level and high-level auditory responses: Fujiki, Jousmaki, & Hari, 2002; Nozaradan, Peretz, Missal, & Mouraux, 2011; somatosensory responses: Colon, Legrain, Huang, & Mouraux, 2015), as well as their modulation by attentional factors (Chen, Seth, Gally, & Edelman, 2003; Colon et al., 2015; Morgan, Hansen, & Hillyard, 1996; Yan, Liu-Shuang, & Rossion, 2019). This suggests that the original approach introduced here could be extended to larger samples of individual brains and other brain functions, pending appropriate adaptation in the stimulation and analyses parameters. Moreover, this approach could be extended to understand functional connectivity between intracerebral contacts in close or remote regions with a wider sampling across the brain.
ACKNOWLEDGMENTS
This work was supported by the Belgian Fonds National de la Recherche Scientifique (FNRS –PDR T.0207.16), Fédération Wallonie-Bruxelles under Grant No. ARC 13/18–053, and the Fondation Louvain.
Endnote
Open Research
DATA AVAILABILITY STATEMENT
The data that support the findings of this study are available from the corresponding author upon reasonable request.


