Frequency-dependent tACS modulation of BOLD signal during rhythmic visual stimulation
Funding information: National Key Research and Development Program of China, Grant/Award Number: 2017YFC0108900; National Natural Science Foundation of China, Grant/Award Numbers: 81430037, 81727808, 81790650, 81790651; Beijing Municipal Science& Technology Commission, Grant/Award Numbers: Z171100000117012, Z161100000216152; Shenzhen Peacock Plan, Grant/Award Number: KQTD2015033016104926; Guangdong Pearl River Talents Plan Innovative and Entrepreneurial Team, Grant/Award Number: 2016ZT06S220
Abstract
Transcranial alternating current stimulation (tACS) has emerged as a promising tool for modulating cortical oscillations. In previous electroencephalogram (EEG) studies, tACS has been found to modulate brain oscillatory activity in a frequency-specific manner. However, the spatial distribution and hemodynamic response for this modulation remains poorly understood. Functional magnetic resonance imaging (fMRI) has the advantage of measuring neuronal activity in regions not only below the tACS electrodes but also across the whole brain with high spatial resolution. Here, we measured fMRI signal while applying tACS to modulate rhythmic visual activity. During fMRI acquisition, tACS at different frequencies (4, 8, 16, and 32 Hz) was applied along with visual flicker stimulation at 8 and 16 Hz. We analyzed the blood-oxygen-level-dependent (BOLD) signal difference between tACS-ON vs tACS-OFF, and different frequency combinations (e.g., 4 Hz tACS, 8 Hz flicker vs 8 Hz tACS, 8 Hz flicker). We observed significant tACS modulation effects on BOLD responses when the tACS frequency matched the visual flicker frequency or the second harmonic frequency. The main effects were predominantly seen in regions that were activated by the visual task and targeted by the tACS current distribution. These findings bridge different scientific domains of tACS research and demonstrate that fMRI could localize the tACS effect on stimulus-induced brain rhythms, which could lead to a new approach for understanding the high-level cognitive process shaped by the ongoing oscillatory signal.
1 INTRODUCTION
Brain oscillations are believed to play an important role in cognition and behavior (Engel, Fries, & Singer, 2001). However, it is still unclear whether oscillations reflect a fundamental mechanism of information processing or appear as an epiphenomenon. Recently, transcranial alternating current stimulation (tACS) has been reported to modulate brain oscillations, which offers a unique opportunity to extend the vast amount of correlative evidence and establish a causal relationship between brain oscillations and cognitive functions. Electroencephalogram (EEG) research in humans has shown that tACS can interact with ongoing rhythmic activities in the visual cortex in a frequency-specific fashion (Kanai, Chaieb, Antal, Walsh, & Paulus, 2008). Several later studies provided consistent support that tACS at alpha frequencies can increase alpha activity in the human occipital-parietal cortex (Helfrich et al., 2014; Neuling, Rach, & Herrmann, 2013; Zaehle, Rach, & Herrmann, 2010). Besides impacting alpha frequency in visual cortex, there is a growing body of research that supports the frequency dependency of effective tACS, such as theta frequency in auditory (Riecke, Formisano, Herrmann, & Sack, 2015) and memory (Jausovec and Jausovec, 2014) system, alpha and high gamma frequency in somatosensory function (Feurra, Paulus, Walsh, & Kanai, 2011b), and beta frequency in motor system (Feurra et al., 2011a).
Although recent studies provide evidence for tACS modulation of brain oscillation at different frequencies, the spatial distribution and magnitude of the hemodynamic response influenced by this interaction remains poorly understood. Most previous tACS studies used EEG, behavioral measures, or motor evoked potentials as the measurements of tACS modulation effects, which have no or poor spatial resolution of brain activity change. Localizing the tACS effect in the human brain is an essential step toward understanding its functional mechanisms and applying tACS to study high-level cognitive processes shaped by the ongoing oscillatory signal. Functional magnetic resonance imaging (fMRI) has the advantage of measuring neuronal activity in regions not only below the tACS electrodes but also across the whole brain with high spatial precision and a relative high temporal resolution. Until recently, there have been very few concurrent tACS-fMRI studies (Alekseichuk, Diers, Paulus, & Antal, 2016; Bachinger et al., 2017; Cabral-Calderin et al., 2016; Vosskuhl, Huster, & Herrmann, 2016) with the majority focused on tACS modulation at alpha frequency. In line with task-dependence of the transcranial direct current stimulation (tDCS) effect on blood-oxygenation-level-dependent (BOLD) signal (Antal, Polania, Schmidt-Samoa, Dechent, & Paulus, 2011), tACS-fMRI studies also reported that tACS only has an effect on task-related BOLD response but has no effect on BOLD signal changes during the resting state (Vosskuhl et al., 2016). Although similar tACS setup and stimulation parameters were applied, some tACS-fMRI studies failed to capture the tACS modulation effect during the stimulation period within tACS-targeted and task-related regions (Alekseichuk et al., 2016; Cabral-Calderin et al., 2016). Because of the weak tACS effect and low signal-to-noise ratio (SNR) of the BOLD measurement, the different task-dependent conditions of these studies have led to different conclusions on whether the tACS effect is below or above the fMRI sensitivity. More tACS-fMRI studies are needed to increase understanding of tACS effects on brain metabolism.
Oscillatory neuronal activities are commonly observed during rhythmic stimulation. Periodical optogenetic stimulation has been shown to cause pronounced oscillatory neuronal activity at the stimulation frequency (Chai et al., 2016). This rhythmic activity is preferentially enhanced by weak electric fields at an identical frequency and its first harmonic (Schmidt, Iyengar, Foulser, Boyle, & Frohlich, 2014). It is also known that neurons in the visual cortex respond to rhythmic visual stimulation at the flickering frequency and this induced rhythmic brain activity is known as steady-state response (SSR) (Herrmann, 2001). One recent tACS-magnetoencephalographic (MEG) study showed that tACS modulates SSR in a frequency-specific manner and same-frequency tACS had the strongest effect on SSR compared with different-frequency tACS and sham stimulation (Ruhnau, Keitel, Lithari, Weisz, & Neuling, 2016).
In this study, we advance the above SSR-tACS modulation research using fMRI measurement. Three unique properties make SSR an ideal candidate for concurrent tACS-fMRI research: (a) As the tACS effect is subthreshold of neuronal activation, fMRI can only capture its effect on task-induced activity (such as SSR) but not in resting state. (b) While endogenous brain oscillations such as alpha activity do not have a clear activation pattern in the BOLD signal, visual stimulation evoked BOLD signal changes are well studied in fMRI (Singh, Kim, & Kim, 2003). (c) While intrinsic brain rhythms, such as alpha, are relatively broadband, SSR has a precise spectral profile and may be a better fit to the tACS research. Given the frequency-dependent manner of tACS effect in electrophysiology research, here we experimentally probed the hypothesis that there is a preferential frequency effect of tACS modulation on BOLD response to rhythmic visual stimulation.
2 MATERIALS AND METHODS
2.1 Participants
All healthy right-handed subjects gave their informed consent to participate in this study. Fourteen volunteers (7 males, 7 females; age (mean ± standard deviation), 25.6 ± 1.4 years) took part in 8Hz-Flicker Experiment and 14 volunteers (7 males, 7 females; age (mean ± standard deviation), 25.6 ± 1.5 years) took part in 16Hz-Flicker Experiment. Among them, 11 subjects underwent both experiments, separated by at least 1 month. The study was conducted under the approval of the Institutional Review Board of Peking University and was in accordance with the Declaration of Helsinki.
2.2 Rhythmic visual and transcranial alternating current stimulations
Rhythmic visual stimulation was created with E-Prime (Psychology Software Tools, USA) and was back-projected on a screen inside the scanner using a projector (SA-9900; Sinorad, Shenzhen, China). To assess the temporal frequency accuracy of the projector, a photodiode was used to record a 60 s course of the projector light intensity when the flicker frequency was set at 8 and 16 Hz. From the spectrogram of the intensity time course (Supporting Information, Figure S1), we knew that the frequency of peak spectral amplitude was at the setting flicker frequency across time and the main spectral power was located within ±0.5 Hz range around the setting flicker frequency. This result indicates that the flicker frequencies (8 and 16 Hz) used in this study were actually presented within ±0.5 Hz range around the flicker frequency. Subjects laying in the scanner viewed the screen by means of a mirror above their heads. The visual flicker consisted of a grayscale radial checkerboard reversing contrast at 8 Hz (8Hz-Flicker Experiment) or 16 Hz (16Hz-Flicker Experiment) with a rest condition consisting of a fixation point centered in an isoluminance gray background (Figure 1). To avoid the ceiling effect in tACS modulation (Neuling et al., 2013), a contrast level of 25% was used for the checkerboard picture to make sure that visual BOLD response has a space to enhance before reaching a ceiling level (detailed in discussion).
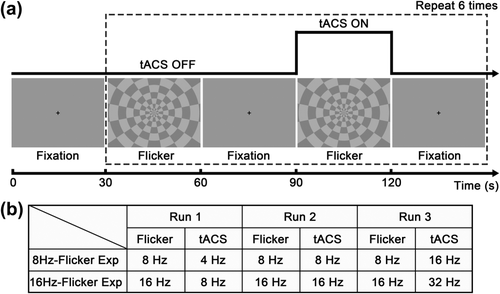
Stimulation time diagram and frequency conditions. (a) Every functional run started with a fixation period of 30 s, after which combined tACS and visual checkerboard flicker was applied repeatedly for 6 times. In each cycle within the dashed box, visual flicker stimulation was presented two times, each with a duration of 30 s, separated by a same period with only the fixation cross, while tACS was applied only during the second flicker block. (b) Three runs were conducted for each experiment (8Hz-Flicker Experiment and 16Hz-Flicker Experiment) with the stimulation frequency parameters listed in the table
The transcranial alternating current was produced by a battery-driven MRI compatible stimulator (Neuroconn GmbH, Germany). From the stimulator positioned outside of the shielded room, the current was delivered through an RF filter box (positioned very close to the waveguide tube), next through waveguide tube into scanner room, then through another RF filter box, and finally reached two rubber electrodes (7 × 5 cm2). All cables were carefully laid out to avoid loops which might result in gradient induced current. The cables connected to two electrodes were equipped with 5 kΩ resistor in each side to avoid sudden temperature increase and to reduce the potential current induced by MRI on tACS. As in previous tACS studies of the visual cortex (Alekseichuk et al., 2016; Cabral-Calderin et al., 2016; Ruhnau et al., 2016; Vosskuhl et al., 2016), two electrodes were positioned over Oz and Cz (international 10/20 EEG system) to achieve maximal stimulation intensity in the occipital-parietal cortex (Neuling, Wagner, Wolters, Zaehle, & Herrmann, 2012b). The impedance was kept below 5 kΩ with ABRALYT 2000 abrasive electrolyte gel (Easycap GmbH, Germany) applied to electrode–scalp junctions. A sinusoid current with an intensity of 1 mA peak-to-peak was used without ramping up and down.
During fMRI acquisition, every run started with a fixation period of 30 s, after which a combined tACS and visual checkerboard stimulation pattern was applied repeatedly for 6 times with a total duration of 750 s. In each cycle within the dashed box as shown in Figure 1a, visual flicker stimulation was presented two times, each with a duration of 30 s, separated by a same period with only the fixation cross, while tACS was applied only during the second visual flicker block. tACS was triggered by transistor–transistor logic pulses from E-Prime to synchronize the onset time of tACS and visual stimulation. Three runs were performed for each experiment with stimulation frequencies as listed in Figure 1b. 8Hz-Flicker Experiment: Checkerboard was rhythmically flickering at 8 Hz in all runs while tACS was applied at 4, 8, and 16 Hz, respectively, for each run. 16Hz-Flicker Experiment: Checkerboard was rhythmically flickering at 16 Hz in all runs while tACS was applied at 8, 16, and 32 Hz, respectively, for each run. The order of the runs was randomized between subjects in each experiment.
2.3 Image acquisition
Functional MR images were acquired on a Prisma 3 T scanner (Siemens Healthcare, Erlangen, Germany) with a 20-channel head coil. Simultaneous multislice (SMS) gradient echo EPI was used with TR/TE 2,000/30 ms, matrix 112 × 112, 2 mm isotropic voxels, 64 slices, 2 SMS excitation, factor-2 in-plane undersampling. High-resolution anatomical images were acquired using a 3D magnetization-prepared rapid gradient echo T1-weighted sequence with TI/TR/TE 1,100/2,530/2.98 ms, flip angle
 , 192 slices, FOV 256 × 256 mm2, resolution 1 × 1 × 1 mm3.
2.4 Statistical analysis
2.4.1 Voxel-wise analysis
Data were processed using FSL (www.fmrib.ox.ac.uk/fsl) and MATLAB (MathWorks, USA). The same standard fMRI data analysis steps were performed for each run of each subject using the FMRI Expert Analysis Tool: discarding the first 10 fMRI volumes from each run to ensure MRI signal steady state, motion correction, brain extraction, spatial smoothing (FWHM = 4 mm), and high-pass temporal filtering (
 ), registration of functional images to the high-resolution structural images and then to the standard Montreal Neurological Institute brain, and general linear modelling (GLM) analysis. We included two explanatory variables in the GLM model: visual stimulation with tACS-ON and visual stimulation with tACS-OFF. The effect of tACS modulation was obtained with the contrast of tACS-ON versus tACS-OFF for each run of each subject separately. At the second level, mixed-effect analyses were performed to obtain three kinds of contrasts: (a) Group mean of tACS modulation effect for each tACS frequency condition in each experiment (8Hz-Flicker or 16Hz-Flicker Experiment). (b) Tripled two-group difference (“tripled” t-test of FSL, https://fsl.fmrib.ox.ac.uk/fsl/fslwiki/GLM) of tACS modulation effects in the three tACS frequency conditions of each experiment. (c) tACS effects differ by the flicker frequency: in the subset of 11 subjects who performed both 8Hz-Flicker and 16Hz-Flicker Experiments, paired t test was applied to compare the tACS effects between 8Hz-flicker and 16Hz-flicker. After cluster-based thresholding (Z > 2.0 and p < .01), the resulted tACS modulation maps were overlaid to the group averaged cortical surface using FreeSurfer (http://surfer.nmr.mgh.harvard.edu).
2.4.2 Region-of-interest (ROI) analysis
For each tACS frequency condition in 8Hz- and 16Hz-Flicker Experiments that detected significant modulation effect, region-of-interests (ROIs) were defined by taking the intersection of the whole tACS modulation voxels, the visual stimulation activated area and the occipital-parietal cortex. Two kinds of ROI analysis were performed. (a) Mean time courses of BOLD signal under tACS-ON and tACS-OFF conditions: After averaging the time series across the ROI and over six stimulus cycles for each subject, the mean time courses were z-transformed to compensate for intensity differences between different subjects. The resulted z-score time series were averaged across all subjects and showed as the time course of BOLD response to visual stimulation under tACS-ON versus tACS-OFF conditions (e.g., Figure 2b). (b) Individual modulation effects across different tACS frequencies: FSL's Featquery program was used to calculate the percent signal change based on the parameter estimates. The ROI-median signal changes of tACS effect were extracted for each subject and were compared between different tACS frequencies to assess whether the group-level modulation trend is reliably observed in most subjects.
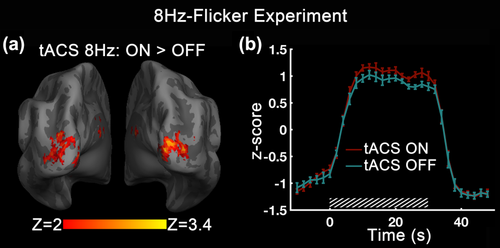
tACS modulation effect on BOLD activation in 8Hz-Flicker Experiment. (a) Z-map of the enhanced modulation effect of tACS at 8 Hz. Increases in BOLD response were seen in the cuneus and middle occipital gyrus bilaterally. (b) Mean subject time course of BOLD signal with tACS-ON versus tACS-OFF. The time course has been averaged across the ROI defined by taking the intersection of the tACS modulation area, the BOLD activation map of visual stimulation, and occipital-parietal cortex. The mean time courses were z-transformed to z-score for compensating intensity differences between different subjects. The error bars indicate ± the standard error of the mean (SEM) across subjects. The slashed box marks the stimulation period [Color figure can be viewed at wileyonlinelibrary.com]
3 RESULTS
3.1 8 Hz tACS produced significantly positive modulation in 8 Hz-flicker experiment
We first performed a voxel-wise analysis to localize regions which show BOLD response differences between tACS-ON and tACS-OFF conditions. The strongest tACS effect on BOLD response to the 8 Hz flicker was observed when tACS was applied at the same frequency. 8 Hz tACS resulted in significant positive modulation in regions that were also activated by the visual task, which were the bilateral cuneus and middle occipital gyrus (Figure 2a). By contrast, no voxel survived the statistical thresholding when comparing 4 or 16 Hz tACS with tACS-OFF. Next, we took the tACS modulated area as ROI and derived the mean subject time course of visual flicker activated BOLD signal changes in the two conditions. Figure 2b showed that the amplitude of BOLD response induced by visual stimulation was enhanced by 8Hz tACS.
We then conducted tripled t test at the second level analysis to compare tACS modulation effect between the three different tACS frequency conditions. Compared with 4 Hz tACS, 8 Hz tACS showed a substantial positive modulation of BOLD response in the cuneus and middle occipital gyrus bilaterally (Figure 3a). Compared with 16 Hz tACS, 8 Hz tACS also showed simliar positive modulation of BOLD response in the right middle occipital gyrus (Figure 3b). These frequency-specific modulation areas coincide well with the above 8 Hz tACS modulation areas derived from the group-mean contrast (Figure 2a). No significant difference of tACS effect between 4 and 16 Hz was detected within visual stimulation activated areas. These results strengthened the frequency-specific argument of tACS modulation effect.
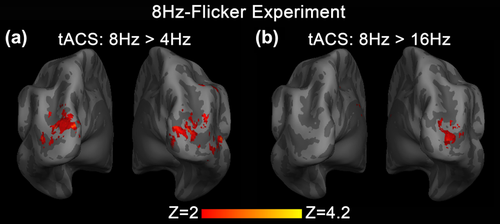
Statistical maps of the tripled t-test analysis of tACS modulation effect at three different tACS frequencies in 8Hz-Flicker Experiment. (a) z-map of tACS enhanced modulation effect comparing between tACS at 8 and 4 Hz. Significant stronger positive tACS effect were seen in the cuneus and middle occipital gyrus bilaterally. (b) z-map of tACS enhanced modulation effect comparing between tACS at 8 and 16 Hz. Significant stronger positive tACS effect were seen in the right middle occipital gyrus [Color figure can be viewed at wileyonlinelibrary.com]
Next, we analyzed the individual modulation effects across different tACS frequencies. From the tACS modulation area within visual cortex (Figure 4a), ROI-median BOLD signal changes of tACS effect (as derived from tACS-ON–tACS-OFF) at different tACS frequencies were extracted and compared for each subject (Figure 4b,c). Comparing tACS effect at 4 Hz and 8 Hz, it is shown that 93% of the subjects followed the general trend (tACS 8 Hz > tACS 4 Hz), which agrees well with the group-level results (Figure 3a). Comparing tACS effect at 8 Hz and 16 Hz, higher interindividual variability was seen.
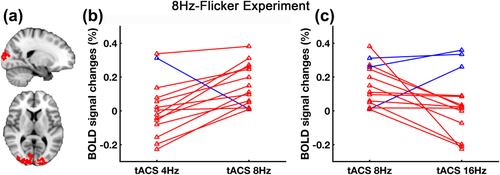
Individual tACS effects across different frequencies in 8Hz-Flicker Experiment. (a) The red area indicates the selected ROI defined by taking the intersection of the 8 Hz tACS modulation area, the BOLD activation map of visual stimulation and occipital-parietal cortex (same with Fig. 2). (b) and (c) show the ROI-median BOLD signal changes of tACS effect (as derived from tACS-ON–tACS-OFF) at different tACS frequencies for each subject. Red represents subjects who follow the general trend (tACS 8 Hz > tACS 4 Hz, tACS 8 Hz > tACS 16 Hz) and blue represents subjects who do not follow the trend [Color figure can be viewed at wileyonlinelibrary.com]
3.2 16 Hz and 32 Hz tACS produced significantly negative modulation in 16 Hz-flicker experiment
To confirm that the frequency-specific phenomenon of tACS modulation does not only exist during 8 Hz rhythmic visual stimulation, we performed identical analyses to explore tACS effect in 16Hz-Flicker Experiment.
During 16 Hz rhythmic visual stimulation, tACS showed negative modulation of the flicker related BOLD response at both the identical and double frequencies (Figure 5). For 16 Hz tACS, significant decreases in BOLD response were seen in the bilateral lingual gyrus, right inferior occipital gyrus, right middle occipital gyrus, and right cuneus. For 32 Hz tACS, the BOLD responses in the middle occipital gyrus, middle temporal gyrus, and cuneus bilaterally were also lower than tACS-OFF. These modulation areas were largely coincident with the regions that were activated by the visual task. Compared with tACS effect in 8Hz-Flicker Experiment, the modulated clusters here showed a more decentralized distribution. From ROI based on the modulation area within visual flicker-activated region of occipital-parietal cortex, we found that the BOLD signal amplitude decreased considerably during tACS-ON block compared with tACS-OFF for both 16 and 32 Hz tACS. No significant modulation effect was detected within visual activation area for 8 Hz tACS.
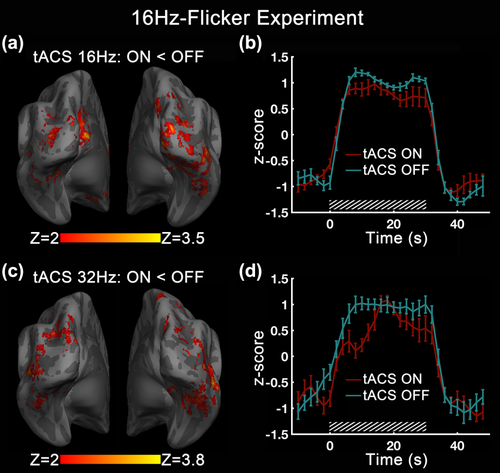
tACS effect on BOLD activation in 16Hz-Flicker Experiment. (a) BOLD signal difference for visual stimulation at 16 Hz with tACS-ON at 16 Hz and tACS-OFF and (b) its ROI-averaged time course for the two compared conditions. Decreases in BOLD response were seen in the bilateral lingual gyrus, right inferior occipital gyrus, right middle occipital gyrus, and right cuneus. (c) BOLD signal difference for visual stimulation at 16 Hz with tACS-ON at 32 Hz and tACS-OFF and (d) its ROI-averaged time course for the two compared conditions. Decreases in BOLD response were seen in the bilateral middle occipital gyrus, middle temporal gyrus, and cuneus. For each frequency condition, the ROI was selected to cover the whole tACS modulation voxels inside the visual stimulation activated area of occipital-parietal cortex. The slashed boxes mark the stimulation periods. The error bars indicate the SEM across subjects [Color figure can be viewed at wileyonlinelibrary.com]
We then conduct a same tripled t test of tACS modulation effect in the three different tACS frequencies to further confirm the frequency-specific hypothesis. In agreement with the above results derived from group-mean contrast, both 16 and 32 Hz tACS showed significantly negative modulation of visual BOLD activity compared with 8 Hz tACS (Figure 6). For 16 Hz tACS, these negative modulations were observed in the bilateral middle occipital gyrus, cuneus, lingual gyrus, and right inferior occipital gyrus (Figure 6a). For 32 Hz tACS, these negative modulations were seen in the middle occipital gyrus, cuneus, middle temporal gyrus, lingual gyrus, inferior temporal gyrus, and fusiform gyrus bilaterally (Figure 6b). However, when comparing the tACS effects at 16 and 32 Hz, no significant difference was detected within visual stimulation activated area other than regions that were not activated by the visual task itself, including the bilateral precuneus, medial frontal gyrus, left supramarginal gyrus, left middle temporal gyrus, left inferior parietal lobule, and left superior frontal gyrus (Figure 7).
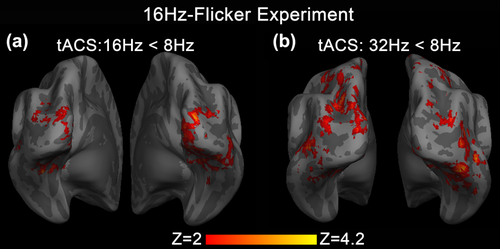
Statistical maps of the tripled t-test analysis of tACS modulation effect between the three different tACS frequencies in 16Hz-Flicker Experiment. (a) z-map of tACS modulation effect comparing between tACS at 8 Hz and 16 Hz. Stronger negative tACS effects were seen in the bilateral middle occipital gyrus, cuneus, lingual gyrus, and right inferior occipital gyrus. (b) z-map of tACS modulation effect comparing between tACS at 8 and 32 Hz. Stronger negative tACS effects were seen in the bilateral middle occipital gyrus, cuneus, middle temporal gyrus, lingual gyrus, inferior temporal gyrus, and fusiform gyrus. Comparing with 8 Hz tACS, both 16 and 32 Hz tACS show significantly negative modulation [Color figure can be viewed at wileyonlinelibrary.com]
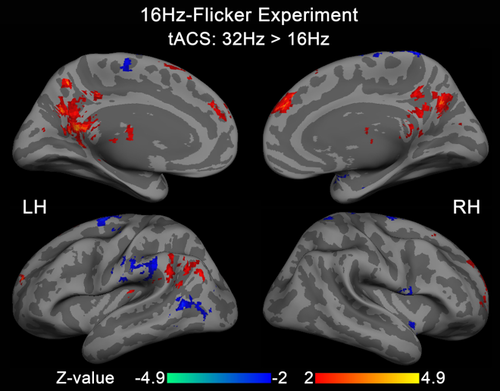
Z-map of tACS modulation effect comparing between tACS at 16 and 32 Hz in 16Hz-Flicker Experiment. No significant difference was detected within visual stimulation activated areas other than regions that were not activated by the visual flicker itself. In the Z-map, the positive regions are seen as the bilateral precuneus, medial frontal gyrus, and left supramarginal gyrus, and the negative regions are seen as the left middle temporal gyrus, left inferior parietal lobule, and left superior frontal gyrus. LH = left hemisphere; RH = right hemisphere [Color figure can be viewed at wileyonlinelibrary.com]
Next, we analyzed the individual modulation effects between different tACS frequencies. From the tACS modulation area within visual activation region (Figure 8a), ROI-median BOLD signal changes of tACS effect (as derived from tACS-ON–tACS-OFF) at each tACS frequency were extracted and compared. As shown in Figure 8b,c, 79% of the subjects followed the group-level trend (tACS 16 Hz < tACS 8 Hz, tACS 32 Hz < tACS 8 Hz).
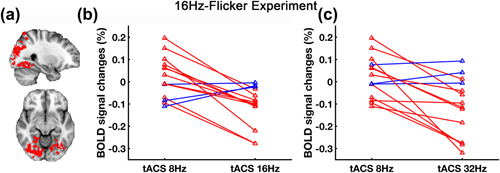
Individual tACS effects across different frequencies in 16Hz-Flicker Experiment. (a) The red area indicates the selected ROI defined by taking the intersection of the modulation area of both 16 and 32 Hz tACS, the BOLD activation map of visual stimulation and occipital-parietal cortex. (b) and (c) show the ROI-median BOLD signal changes of tACS effect (as derived from tACS-ON–tACS-OFF) at different tACS frequencies for each subject. Red represents subjects who follow the general trend (tACS 16 Hz < tACS 8 Hz, tACS 32 Hz < tACS 8 Hz) and blue represents subjects who do not follow the trend [Color figure can be viewed at wileyonlinelibrary.com]
3.3 tACS effects differ by flicker frequency
In the subset of 11 subjects who performed both 8 Hz-Flicker and 16 Hz-Flicker Experiments, we applied group-level paired t test to compare the tACS effect between 8 Hz-Flicker and 16 Hz-Flicker. With tACS at 8 Hz, the BOLD response of 8 Hz-flicker was significantly enhanced in the right cuneus and middle occipital gyrus compared with 16 Hz-flicker (Figure 9a). With tACS at 16 Hz, the BOLD response of 16 Hz-flicker was significantly decreased in the left lingual gyrus, right cuneus, and precuneus compared with 8 Hz-flicker (Figure 9b). The modulation direction of enhancement or weakening is concluded from the group-mean tACS effect of Figures 2 and 5.
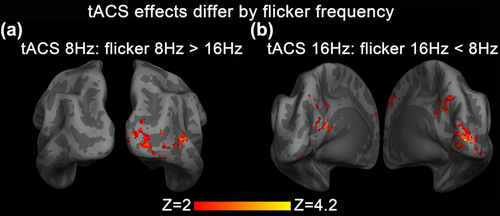
Statistical maps of tACS effects differ by flicker frequencies. In the subset of 11 subjects who performed both 8Hz-Flicker and 16Hz-Flicker experiments, group-level paired t test was applied to compare the tACS effect between 8Hz-flicker and 16Hz-flicker. Compared with the condition of tACS and flicker applied at different frequencies, (a) BOLD response evoked by 8 Hz flicker was significantly enhanced by 8 Hz tACS in the right cuneus and middle occipital gyrus, while (b) BOLD response evoked by 16 Hz flicker was significantly decreased by 16 Hz tACS in the left lingual gyrus, right cuneus, and precuneus [Color figure can be viewed at wileyonlinelibrary.com]
4 DISCUSSION
In this study, we demonstrated that (a) tACS can modify the BOLD signals during rhythmic visual stimulation and the main tACS effects were predominantly seen in regions that were activated by the visual task and targeted by tACS current distribution, such as cuneus and middle occipital gyrus; (b) the strongest tACS effects were observed when tACS frequency matched the visual stimulation frequency or the second harmonic frequency. Along with 8 Hz rhythmic visual stimulation, only 8 Hz tACS enhanced BOLD response significantly, while 4 and 16 Hz tACS did not. Along with 16 Hz rhythmic visual stimulation, both 16 and 32 Hz tACS decreased BOLD response significantly, while 8 Hz tACS did not. Together, these findings reveal the spatial information and the hemodynamic response changes influenced by tACS.
No purely control frequency condition was used in this study. First we chose 8 Hz visual stimulation because 8 Hz could induce the strongest fMRI signal changes in human visual cortex compared to other stimulation frequencies (Lin et al., 2008; Singh et al., 2003). At this frequency, visual system could develop its full signal and could be the best target for tACS modulation. tACS were applied at identical, subharmonic, or harmonic frequencies. We do not have a purely control frequency condition in this study, which is supposed to have the lowest possibility to induce any modulation effect. Vosskuhl et al. (2016) chose 1 Hz as a control frequency for alpha tACS research and they found tACS at this control frequency also induced significant modulation effect on vigilance task related BOLD signal. Therefore, in this study, we cannot rule out the possibility that nonharmonic tACS might also have comparative effect. But at least in these three frequency conditions of identical, subharmonic, and harmonic, statistic comparison is applicable to reveal the preferred frequency.
Effective tACS modulation at the same frequency as the brain oscillations and harmonic multiples has been shown in a number of studies. In mouse neocortical slices, oscillatory neuronal activation induced by optogenetic stimulation was enhanced more significantly by the weak electric stimulation at the same frequency or its first harmonic than stimulation at nearby, yet mismatched frequencies (Schmidt et al., 2014). At the level of large-scale cortical network, the dynamics of tACS modulation have been investigated using both simulation and multiunit extracellular recording during tACS in anesthetized ferrets (Ali, Sellers, & Frohlich, 2013). It was found that the neuronal oscillatory network was maximally entrained by external stimulation at the intrinsic network frequency and its first harmonic. Consistent with these results, our findings also demonstrated that a significant modulation effect of BOLD activity was observed only when the tACS frequency equaled or doubled the frequency of visual stimulation. As BOLD signal reflects the underlying neuronal activity, tACS modulation of BOLD activity is supposed to result from the interaction of tACS and SSR.
One recent tACS-MEG study has demonstrated that SSRs can be modulated by tACS when the frequencies of both stimulations are the same and are not modulated when the frequencies are different (Ruhnau et al., 2016). Except for the result of 32 Hz tACS in 16Hz-Flciker Experiment, other frequency-specific results in our study are in line with the above electrophysiological findings. Regarding the exception, it can be explained by the harmonic modulation. During rhythmic visual stimulation, harmonic components are typically seen in SSR recordings (Fawcett, Barnes, Hillebrand, & Singh, 2004; Herrmann, 2001). All these harmonic components of SSR could be modified by tACS at the fundamental frequency of SSR (Ruhnau et al., 2016). It is possible that tACS at second or multiple harmonic frequency of SSR could also affect the corresponding harmonic components of SSR, which needs further electrophysiological tACS research to verify.
Alpha oscillations might be affected but should not be responsible for the modulation effect seen in this study. tACS frequency of 8 Hz lies within the alpha range and might enhance alpha amplitude in occipital-parietal cortex (Zaehle et al., 2010). Alpha amplitudes in the occipital-parietal cortex have been shown to negatively correlate with BOLD signal changes (Goldman, Stern, Engel, & Cohen, 2002; Laufs et al., 2003). If the modulation effect of 8 Hz tACS was generated through interaction with alpha oscillation, it would decrease the flicker-induced BOLD signal changes, which was not the case here. In this study, 8 Hz tACS showed enhanced effect in 8 Hz-Flicker Experiment and showed no significant effect in 16 Hz-Flicker Experiment. These results reduced the possibility of alpha oscillation playing a main role in the tACS effect of this research.
The time lag between tACS and visual evoked neuronal response might cause phase effect, which could result in the different modulation effect during 8 and 16 Hz rhythmic visual stimulation. In this study, we used E-Prime to send trigger pulse to tACS when starting visual stimulation. But there is a time lag between E-prime execution and its evoked neuronal response in visual cortex, which consists of the time delay between E-Prime execution and flicker showed by the projector (35 ms, measured in our stimulation system), the time of retinal response to light stimulation and the conduction delay from retinal to visual cortex. The total time lag is about 65 milliseconds (Bair, 1999; Dalal, Westner, Bailey, Dietz, & Popov, 2017; Zeki, 2015), which is comparable to the stimulation period. This time lag would lead to a relative phase between tACS and flicker response. The value of this relative phase was determined by the ratio between the time lag and stimulation period. The period of 16 Hz is 62.5 ms, which is half of the period of 8 Hz. If we assume the time lag is the same in 8 Hz and 16 Hz-Flicker experiments, the relative phase would be twice larger in 16 Hz-Flicker experiment than that in 8 Hz-Flicker experiment. Previous researches have showed that the behavior result of tACS modulation is affected by the phase of the ongoing brain oscillation (Helfrich et al., 2014; Neuling, Rach, Wagner, Wolters, & Herrmann, 2012a). In this study, the different phase in 8 Hz and 16 Hz-Flicker experiments might cause different modulation effect, even make it opposite. In addition, due to individual difference of visual processing speed, the time lag might jitter between different subjects. Similarly, the phase variation in 16 Hz-Flicker experiment was twice that in 8 Hz-Flicker experiment. As a possible result, tACS in 8 Hz-Flicker experiment had a more stable and clear modulation pattern, while the tACS effect in 16 Hz-Flicker experiment was less stable.
One limitation of our study was the lack of control over the phase lag. While it is possible that phase lag could be tested through shifting the stimulation phase, due to individual subject variation in the time of retinal response and conduction to visual cortex, we would need EEG measurements to accurately measure the phase lag between tACS and flicker evoked neuronal response. This limitation is not unique to our study, and exists in previous tACS research (Kanai et al., 2008; Zaehle et al., 2010). However, we do believe that the examination of tACS phase effect is an important direction for future research.
In contrast to previous tACS-fMRI experimental studies, we applied the depending task with a low contrast to avoid the ceiling effect. Previous alpha tACS study showed that tACS could modulate alpha oscillation only when subjects eyes were open and failed to influence alpha power when subjects eyes were closed (Neuling et al., 2013). The presence of ceiling effect is one possible cause: with eyes closed, endogenous alpha power has reached a maximum (Nunez, Wingeier, & Silberstein, 2001) and has no space to be further enhanced by tACS. Consistent with this explanation, the participants in alpha tACS researches that achieved effective modulation results were always asked to keep their eyes open and do a target detection task to ensure vigilance throughout the course of tACS stimulation (Helfrich et al., 2014; Zaehle et al., 2010). Encouraged by the EEG-tACS results, researchers began the efforts with the hope to observe effective tACS modulation effect at the BOLD signal level. Unlike EEG, fMRI is not sensitive enough to image the direct tACS effect on endogenous brain oscillations. As tACS cannot induce detectable BOLD signal changes at resting state, most tACS-fMRI studies including ours combined tACS with other tasks and investigated the modulation effects on task-related activity. However, the observed BOLD changes of tACS were minor and even invisible in tACS targeted area (Alekseichuk et al., 2016; Cabral-Calderin et al., 2016). The different tACS effects showed by EEG/MEG and fMRI have several possible causes, including the presence of ceiling effect in task-related BOLD signal. If the BOLD signal changes induced by the task has reached maximum, there is no space for further tACS enhancement. Thus, in our study, a low contrast of 25% was applied to the checkerboard and the related BOLD signal change was about 80%–90% of that induced by visual stimulus of 100% contrast level based on previous literatures (Chiacchiaretta, Romani, & Ferretti, 2013). This BOLD amplitude had the space for both up and down modulation. Although this explanation is intriguing, further research will be needed to fully elucidate the ceiling-effect explanation and the contrast impact on the effective tACS.
The neuromodulation effects of transcranial current stimulation on fMRI signal were not only detected in targeted areas but also usually observed in distant regions that were not activated by the visual flicker or poorly predicted by the current density modeling. Alekseichuk et al. (2016) studied the tACS of the occipital cortex during visual perception and detected a widespread offline BOLD decrease over the occipital, temporal, and frontal area but no online effect. Cabral-Calderin et al. (2016) investigated the modulation effects of tACS applied over posterior cortex and mainly observed BOLD signal changes in fronto-parietal areas instead of occipital cortex. Our study adopted a similar tACS setup to target occipital cortex but combined with a visual task of low contrast to avoid the ceiling effect. Except for the mainly observed modulation effect in occipital cortex, we also saw tACS changing BOLD signals in non-tACS-targeted or non-task-related regions as shown in Figure 7. In accordance with the widespread character of tACS effect, tDCS was also found provoking perfusion signal changes in an extensive spatial range (Lang et al., 2005; Stagg et al., 2013). In general, the tES modulation on brain functional signal is complex and shows the global effects on the whole brain.
5 CONCLUSIONS
In conclusion, tACS has been shown to modulate the BOLD response during rhythmic visual stimulation in a frequency-specific fashion within task-related and tACS-targeted area. Concurrent tACS-fMRI studies could resolve the spatial distribution of neuromodulation effect in human brain, yielding new insight into the role of tACS modulating ongoing oscillations of brain functions.
ACKNOWLEDGMENTS
The authors acknowledge the editorial assistance of the NIH Fellows Editorial Board and the many useful comments from Dr Daniel A. Handwerker of NIMH. This work was supported by the National Key Research and Development Program of China (2017YFC0108900); National Natural Science Foundation of China (81430037, 81727808, 81790650, and 81790651); Beijing Municipal Science& Technology Commission (Z171100000117012 and Z161100000216152); and Shenzhen Peacock Plan (KQTD2015033016104926); Guangdong Pearl River Talents Plan Innovative and Entrepreneurial Team (2016ZT06S220). The authors thank National Center for Protein Sciences at Peking University in Beijing, China, for assistance with MRI data acquisition and data analyses.


