Enhanced subject-specific resting-state network detection and extraction with fast fMRI
Abstract
Resting-state networks have become an important tool for the study of brain function. An ultra-fast imaging technique that allows to measure brain function, called Magnetic Resonance Encephalography (MREG), achieves an order of magnitude higher temporal resolution than standard echo-planar imaging (EPI). This new sequence helps to correct physiological artifacts and improves the sensitivity of the fMRI analysis. In this study, EPI is compared with MREG in terms of capability to extract resting-state networks. Healthy controls underwent two consecutive resting-state scans, one with EPI and the other with MREG. Subject-level independent component analyses (ICA) were performed separately for each of the two datasets. Using Stanford FIND atlas parcels as network templates, the presence of ICA maps corresponding to each network was quantified in each subject. The number of detected individual networks was significantly higher in the MREG data set than for EPI. Moreover, using short time segments of MREG data, such as 50 seconds, one can still detect and track consistent networks. Fast fMRI thus results in an increased capability to extract distinct functional regions at the individual subject level for the same scan times, and also allow the extraction of consistent networks within shorter time intervals than when using EPI, which is notably relevant for the analysis of dynamic functional connectivity fluctuations. Hum Brain Mapp 38:817–830, 2017. © 2016 Wiley Periodicals, Inc.
Abbreviations
-
- DMN
-
- Default-mode network
-
- fMRI
-
- Functional MRI
-
- ICA
-
- Independent component analysis
-
- IRB
-
- Institutional review board
-
- MPFC
-
- Medial prefrontal cortex
-
- PCC
-
- Posterior cingulate cortex
-
- SCA
-
- Seed-based correlation
-
- TR
-
- Repetition time
-
- tSNR
-
- Temporal signal-to-noise ratio
INTRODUCTION
The human brain is not idle while it is left to a resting state [Raichle et al., 2001; Shulman et al., 1997]. Functional MRI (fMRI) is a powerful modality to detect ongoing cerebral activity during the resting state. Functional studies related to resting-state networks (RSNs) are becoming a promising tool for reliable functional localization both in healthy and diseased populations [Biswal et al., 1995; Greicius et al., 2004; Jacobs et al., 2014; Zhang et al., 2009]. Recent studies have shown that some networks are consistent across groups of healthy subjects [Allen et al., 2011; Beckmann et al., 2005; Damoiseaux et al., 2006; Shirer et al., 2012]. Those networks include the default-mode network (DMN), auditory, sensorimotor, visuospatial, primary and secondary visual networks, attentional, basal ganglia, language, and salience networks. In this study we focus on investigating those consistent networks as well as their possible sub-networks.
The advent of fast fMRI sequences has led to improved physiological noise correction and higher sensitivity and statistical power [Jacobs et al., 2014; Posse et al., 2012]. Techniques such as MR-Encephalography [Zahneisen et al., 2012], Multiband-EPI [Feinberg et al., 2010; Moeller et al., 2010], echo-volumar imaging (Mansfield et al., 1989) and inverse imaging [Boyacioğlu and Barth, 2013; Lin et al., 2006] were all developed to accelerate image acquisition. When applied to fMRI, these sequences allow the measurement of high-frequency (up to 10 Hz) cerebral BOLD fluctuations. In this study we focus on the MREG sequence, which uses a single-shot k-space trajectory to achieve a repetition time (TR) of 100 ms [Zahneisen et al., 2012]. Although fast acquisitions are not necessary to sample the low frequency (<0.1 Hz) fluctuations usually associated with BOLD activity, they are fundamental to correct aliased high-frequency physiological noise [Hennig et al., 2007; Lin et al., 2012; Posse et al., 2012; Boyacioglu et al., 2013; Tong and Frederick, 2014]. Furthermore, there is also relevant RSN information at higher frequencies [Boubela et al., 2013; Chen and Glover, 2015; Gohel and Biswal, 2015; Kalcher et al., 2014, 2014; Lee et al., 2013; Lin et al., 2015; Niazy et al., 2011; Yuan et al., 2014] and the increased number of time points improves the sensitivity to map the RSNs compared to conventional sequences [Feinberg et al., 2010; Jahanian et al., 2016; Preibisch et al., 2015].
Seed-based correlation (SCA) and independent component analysis (ICA) have long been considered to be the principal tools to map functional connectivity patterns in resting-state fMRI data. Both SCA and ICA perform similarly [Erhardt et al., 2011] in terms of spatial maps. SCA is sensitive to the size and the location of the seed, which needs to be carefully selected to avoid introducing too much variability [Cole et al., 2010], while ICA is a non-supervised method that extracts statistically independent spatial maps without specific assumptions about the localization of functional networks and their subdivisions. When applied to fast fMRI, ICA facilitates the removal of physiological noise and results in the identification of more BOLD components [Boyacioğlu et al., 2015; Olafsson et al., 2015; Griffanti et al., 2014].
An important issue of the ICA methodology is the effect of the number of time points on the resulting decomposition. In conventional EPI, resting-state scans lasting a few minutes result in a couple of hundred time points, and increasing the number of time points using a longer scan time (at a fixed volumar acquisition rate) increases the reliability of the RSN detection [Birn et al., 2013]. With MREG, a large number of time points can be achieved in short time intervals, which could yield advantageous results in the ICA decompositions.
The central goal of this study was thus to compare MREG and EPI in terms of ability to extract common RSNs with ICA. We quantify the quality of the RSN extraction by the number of components that overlap with standard functional templates. A secondary goal was to further quantify the reliable detectability of the networks within shorter time intervals.
MATERIALS AND METHODS
The imaging protocol used for this study was approved by the institutional review board (IRB) at the University Medical Center Freiburg.
Data Acquisition
Eight healthy volunteers (five males), age ranging from 21 to 35, underwent one anatomical reference scan and two consecutive 10-minute resting-state scans with conventional EPI and MREG sequences in a pseudo-randomized order of acquisition. Data were acquired with a 3T Trio TIM scanner (Siemens Healthcare, Erlangen/Germany) with 32-channel receive head coil and body coil for RF transmission. The gradient system has a maximum strength of 40mT/m, and a maximum slew-rate of 200mT/m/ms. Cardiac and respiratory signals were recorded during the scan to retrospectively remove them as confounds later on [Glover et al., 2000]. The EPI sequence used parameters TR = 2.5s TE = 30ms, FA = 90°, FOV = 256 × 256 mm2, 32 axial slices with no slice gap and an isotropic voxel size of 4mm. The MREG sequence is acquired with a single-shot concentric shells trajectory [Zahneisen et al., 2012] with the following parameters TR = 0.1s. TE = 20ms, FA = 15° and the same voxel size as EPI.
Data Processing
Preprocessing
Motion correction was carried out using FSL (www.fmrib.ox.ac.uk/fsl). All volumes were registered to the first image; head motion in all six degrees of freedom was smaller than 1mm and 1º. Physiological confounds and trends (<0.01 Hz) as well as white matter and CSF signals were linearly regressed out from the time courses [Glover et al., 2000]. All MREG data processing steps were exactly the same as with EPI data and no lowpass filter applied.
For normalization purposes, a rigid transformation matrix was calculated for the functional images by first registering them to their own anatomical images and then by registering those to the MNI-152 (Montreal Neurological Institute) template. The subsequent ICA analysis was still performed in native space and only later transformed to the MNI-152 2mm template to compare with functional parcels of the FIND atlas [Shirer et al., 2012], which is also in MNI space. As a last preprocessing step, all datasets were smoothed with 7mm FWHM Gaussian kernel before the ICA decomposition.
Network detection among ICA components
ICA was performed by using FSL's MELODIC. IC maps were thresholded (P = 0.95) by using Gaussian mixture modeling, which fits the spatial intensity distributions by a mixture of Gaussians representing positive and negative IC contributions as well as noise [Beckmann and Smith, 2004] . All resulting thresholded component maps were then compared with templates from the FIND atlas using Dice similarity indices. The Dice similarity index is formulated as D = 2 * vol(A∩B)/(vol(A) + vol(B)), where A is the template image, B is the thresholded single-subject ICA map, and vol(.) denotes the volume of the corresponding regions, in other words the number of voxels. In order to determine a threshold on the Dice similarity index beyond which a component was consider to match the FIND templates, null distributions of Dice indices were calculated using randomly created templates (see examples in Fig. 1). Because Dice scores are dependent on template volumes, the sizes of the random templates were designed to cover a range between 0 and 8,000 voxels, corresponding to the range of sizes found in the FIND atlas. This range was split into 16 bins, each covering a range of 500 voxels; in each bin, 100 random templates were then constructed from combinations of parcels randomly chosen from the FIND atlas' regions of interests (Fig. 2a). In each bin, a null distribution was then computed for the Dice values calculated between the random templates and component maps pooled across the eight subjects. This allowed the determination of a non-parametric threshold defined as P < 0.05/n, beyond which a component was considered to be significantly associated with a given template. The number “n” corresponds to the number of independent components tested, for the purpose of multiple comparison correction. Figure 2a clearly shows the dependency of the Dice coefficient null distributions on the size of the randomly generated templates. For each RSN template from the FIND atlas, the previously determined, template-size dependent Dice threshold could then be applied (Fig. 2b). The ICs that exceeded the threshold were then labeled as belonging to the corresponding network.
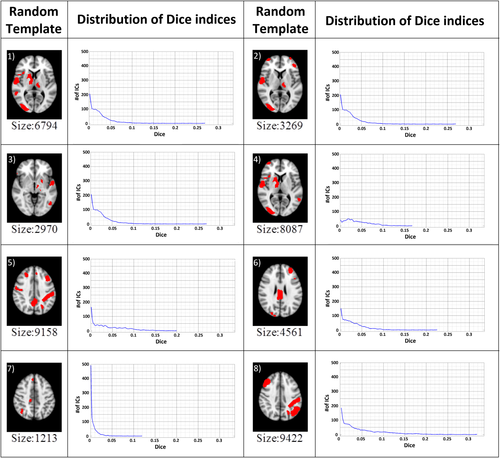
Random Templates: Example templates created by randomly selected FIND parcels and their Dice score distribution (the number of bins is 100 for each plot, equally spaced within the range of calculated Dice values). The template sizes (# of voxels) are shown below each map. Smaller templates (for example #3 and #7) tended to result in lower distributions of Dice coefficients. [Color figure can be viewed at wileyonlinelibrary.com]
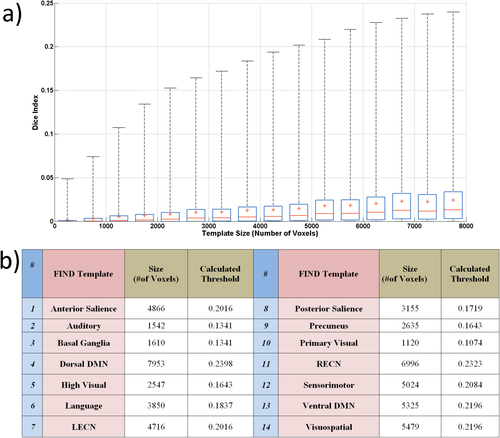
Dice thresholds for the detection of FIND templates: a) The box plots show the distributions of Dice values as a function of the sizes of the random templates. Each bin corresponds to a 500-voxel range of template sizes with a corrected 95% confidence interval. The corresponding threshold values for each FIND template (upper bound of the confidence interval) are shown in Table I. [Color figure can be viewed at wileyonlinelibrary.com]
Choice of the number of components
It is sometimes recommended to perform ICA on fMRI data by setting the number of components to extract to a fraction of the number of fMRI time points, for example one fifth [Greicius et al., 2004]. However, for MREG data with many time points, this would result in a very large number of components, potentially overfitting the data. Multiple ICAs were therefore performed on the 10-minute MREG data by setting the number of components to extract from 20 to 140 in steps of 20. The number of detected RSNs among the 14 FIND templates, according to the previously determined Dice coefficient thresholds, was recorded for each subject and number of components under investigation. Increasing the number of components beyond 100 did not significantly increase the number of detected RSNs (Fig. 3), hence further analyses were performed based on ICA decompositions using at most 100 components.
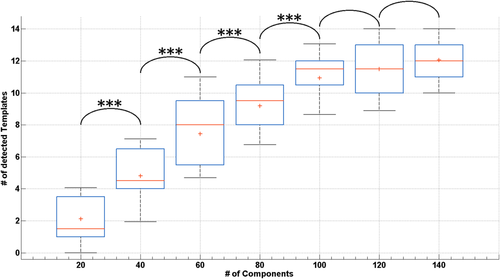
Number of templates: Each box plot shows the number of networks detected across the subjects as a function of the number of extracted independent components in the analysis of the 10-minute MREG data. Asterisks indicate statistically significant differences in the number of detected RSNs (P < 0.05 corrected). All of the indicated differences were highly significant (P < 0.001). [Color figure can be viewed at wileyonlinelibrary.com]
Effect of scan time and data length
To assess the effect of data length on the ICA decompositions, data from both sequences were analyzed using the following approach. ICA was performed for each subject for twelve different durations. These were generated by taking the first 50s of data up to the full scan time (600 s) in 50s increments. As explained in the previous section, the number of components for the ICA was set to one fifth of the number of time points, but only up to a maximum of 100 components. In addition to the comparison of EPI and MREG with identical durations, we also assessed the ICA decomposition of MREG when using the same number of time points (and the same number of components) as EPI (See Table 1).
| a) | EPI (Sec) | 50 | 100 | 150 | 200 | 250 | 300 | 350 | 400 | 450 | 500 | 550 | 600 |
| (Samples) | 20 | 40 | 60 | 80 | 100 | 120 | 140 | 160 | 180 | 200 | 220 | 240 | |
| #of Comp. | 4 | 8 | 12 | 16 | 20 | 24 | 28 | 32 | 36 | 40 | 44 | 48 | |
| b) | MREG (Sec) | 50 | 100 | 150 | 200 | 250 | 300 | 350 | 400 | 450 | 500 | 550 | 600 |
| (Samples) | 500 | 1000 | 1500 | 2000 | 2500 | 3000 | 3500 | 4000 | 4500 | 5000 | 5500 | 6000 | |
| #of Comp. | 100 | 100 | 100 | 100 | 100 | 100 | 100 | 100 | 100 | 100 | 100 | 100 | |
| c) | MREG (Sec) | 2 | 4 | 6 | 8 | 10 | 12 | 14 | 16 | 18 | 20 | 22 | 24 |
| (Samples) | 20 | 40 | 60 | 80 | 100 | 120 | 140 | 160 | 180 | 200 | 220 | 240 | |
| #of Comp. | 4 | 8 | 12 | 16 | 20 | 24 | 28 | 32 | 36 | 40 | 44 | 48 |
- a & b. Comparison of EPI & MREG with the same scan time.
- a & c Comparison of EPI & MREG with the same number of samples (time points).
RESULTS
The distributions of Dice coefficients obtained from the randomly constructed templates showed a clear dependence on template size (Fig. 2a). This allowed the calculation of a set of threshold values separately for each FIND template (Fig. 2b).
The numbers of detected RSNs by using the MREG sequence according to the previously determined thresholds are shown in Figure 3 as a function of the number of components used in the ICA decomposition. By increasing the number of ICA components up to 100, we observed an increase in the number of detected FIND templates that match with component maps. No significant increase in the number of detected RSNs was observed when the number of components was increased beyond 100.
The numbers of detected ICs corresponding to the 14 network templates, as a function of the duration and averaged across all subjects, are shown in Figure 4a. For most of the networks, there was no significant difference in the number of detected ICs with MREG or EPI at longer durations. At the full 600s duration, more components were detected in MREG only for the primary visual, high visual, auditory, sensorimotor, and dorsal DMNs. However, for durations shorter than 150 seconds, MREG performed significantly better in the detection of all networks. In the EPI datasets at durations below 250 seconds, only the larger networks such as the Precuneus, vDMN, dDMN and primary visual networks were detected. In the MREG datasets, one matching component could be detected on average for almost all of the networks, although the dDMN had an average of 3 to 4 matching components while the posterior salience network did not result in a matching component in about half of the cases. In Figure 4b, the number of detected ICs are shown with respect to the number of time points, namely with both EPI and MREG datasets being compared with the same number of volumes, corresponding to MREG durations 25 times shorter than EPI. At such short durations, only the anterior salience, basal ganglia, and dDMN networks are detected in MREG. The basal ganglia network was the only network whose detectability was significantly better in the MREG data compared to EPI.
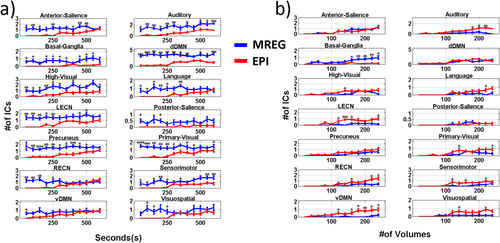
Number of networks, EPI vs MREG: The graph shows the mean number of detected ICs for each network, with error bars representing the standard deviation across the subjects. The plots show a comparison of the two imaging techniques according to a) duration of the analyzed time interval, b) number of time points. [Color figure can be viewed at wileyonlinelibrary.com]
In Figure 5, group results are summarized as percentages of detected networks, where percentage values indicate the proportion of subjects in which the corresponding network was detected in at least 1 component. At long durations, dDMN, precuneus and the primary visual network have the highest detection rate of 87.5 to 100 percent of the subjects. At durations shorter than 150 seconds, detection percentages in EPI decrease drastically to 12.5 to 25 percent of the subjects. For extremely small windows (<12 sec), MREG shows quite low detection rates but for relatively larger windows (starting at around 24 seconds), larger networks like the dDMN and precuneus start to appear in around half of the subjects.

Percentage of subjects with detected networks according to interval duration or number of volumes: a) in MREG data, with the number of volumes matched with EPI, b) in EPI data, c) in MREG data, with the interval duration matched with EPI. Number of volumes and seconds are shown on the x-axis vs. the 14 different networks on the y-axis. The average percentages across all networks are shown in the bottom row. [Color figure can be viewed at wileyonlinelibrary.com]
With MREG at long durations, large networks like the dorsal dDMN splits into multiple components. In Figure 6, the whole dDMN and smaller overlapping partial “DMN-like” components are shown with different color maps for three subjects. Such a result was observed in six of the eight subjects, where the dDMN appeared both as a whole network and as split sub-networks in separate components. Typically, the dDMN was split into posterior cingulate cortex (PCC) only, PCC and inferior parietal lobules (IPLs), and PCC and medial prefrontal cortex (MPFC). Split sub-networks were also observed for the auditory network (four subjects), motor network (three subjects), and the high visual network (three subjects). Again, both the whole networks and partial sub-networks appeared as separate components. In these cases, the split sub-networks usually consisted of the separate right and left parts of the whole networks.
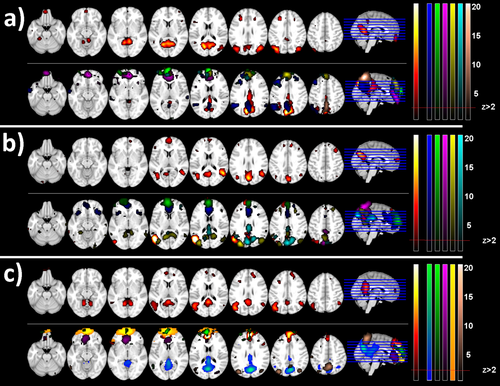
dDMN networks detected in MREG data: Default-mode network components detected in 3 different subjects; a), b) and c). The 1st row of each subplot shows the dorsal DMN component representing the whole network (using the red-yellow colormap on the right), while the 2nd row shows the smaller Ics (partial sub-networks using the colormaps shown on the bottom) that showed significant Dice similarity with the dorsal DMN template. All ICs are thresholded at z > 2. [Color figure can be viewed at wileyonlinelibrary.com]
ICA maps with the highest Dice index with the various network templates are shown in Figure 7 (for EPI) and Figure 8 (for MREG). Each row shows different subject-specific networks on a single axial slice, and each column indicates the duration of the time interval used to detect that network.
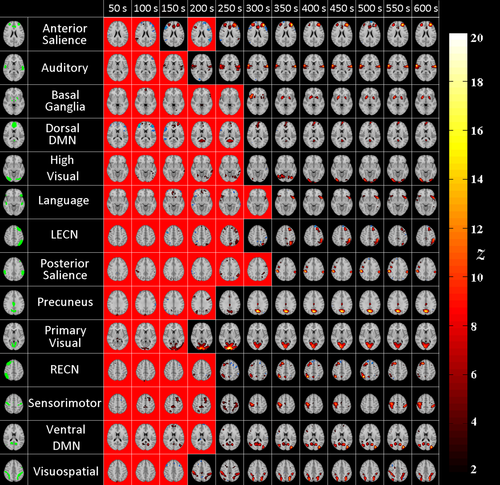
EPI networks: ICs corresponding to each RSN for different analyzed durations. Each row shows results from a single subject and column shows maps with maximum Dice index with the corresponding template. The red background indicates ICs whose Dice index was not statistically significant. On the leftmost column, FIND templates are displayed in green. [Color figure can be viewed at wileyonlinelibrary.com]
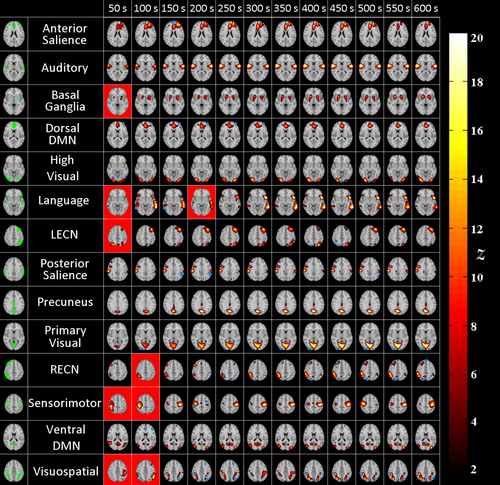
MREG networks: ICs corresponding to each RSN for different analyzed durations. Each row shows results from the same single subjects as in Figure 7. Each column shows maps with maximum Dice index with the corresponding RSN template. The red background indicates ICs whose Dice was not statistically significant. On the leftmost column, FIND templates are displayed in green. [Color figure can be viewed at wileyonlinelibrary.com]
MREG shows higher z-values than EPI (see Figs. 7 and 8). For almost all of the networks, EPI datasets did not result in any detected components for durations less than 150s. The sensitivity of the network detection for EPI thus drastically degrades at shorter durations.
As for MREG, at the shortest durations such as 50 and 100 seconds, some networks, i.e. executive, language and visuospatial could not be detected (See Fig. 8). However, this could also be interpreted as these networks not being active during the particular 50-second interval under investigation. For example, in an ICA analysis of 12 different short window segments of 50 s for the right executive control network in a single subject, 8 out of 12 windows yield a significant detection (See Fig. 9).

Tracking the right executive control network (RECN): The length of each window is 50 seconds and axial maps show the highest Dice index match with the RECN template in a single subject. Fluctuations of Dice indices over time are plotted in blue and the threshold used for statistical significance is indicated in red. In 4 of the 12 windows (red background), the components with maximum Dice index do not reach statistical significance. [Color figure can be viewed at wileyonlinelibrary.com]
DISCUSSION
This study compared RSN extraction with MREG and EPI sequences with respect to two main aspects. The first goal was to investigate how an increased temporal resolution affects the extracted RSNs in terms of the number of components associated with RSN templates, which shows the separation power of the spatial ICA methodology applied to fast fMRI data. This had already been noted in a single subject using the multiband EPI sequence and EVI [Feinberg et al., 2010; Posse et al., 2013], and we show here that this result is applicable and reproducible in a group. Note that fast fMRI also opens up the possibility to perform temporal ICA, but that spatial ICA remains a necessary first step in the temporal ICA pipeline [Smith et al., 2012], so the results are also relevant for temporal ICA applications.
The second point was to determine whether the increased temporal resolution could allow reliable RSN detection in shorter time intervals. It was shown that MREG achieved a higher sensitivity of RSN detection. Even for segments as short as a minute, well-known major networks were detectable by ICA of MREG data. This improvement may suggest the possibility to perform resting-state analysis without necessarily requiring extended scanning sessions [Birn et al., 2013]. The typical scan length to perform ICA with EPI is 5 to 10 minutes, during which a few hundred data points are acquired; this amount of data is acquired in less than a minute with MREG. However, it is not necessarily advisable to acquire resting-state data during such short time intervals (see later section for further discussion).
Other factors beyond the number of time points affect the detectability of resting-state networks. Comparing segments with identical numbers of time points resulted in poor detectability of networks in MREG data compared to EPI. This is because MREG segments with the same number of time points as EPI were obtained in very short time windows, in which low-frequency fluctuations cannot be reliably measured. Specifically, only frequencies down to the reciprocal of the window length can be observed [Leonardi and Van De Ville, 2015]. Consequently, none of the BOLD fluctuations in the 0.01–0.1 Hz frequency band traditionally associated with resting-state networks are captured in windows shorter than 10 seconds, resulting in poor network detection in MREG. Moreover, these low-frequency fluctuations can only be partially measured in window sizes up to 100 seconds; in practice, proper connectivity estimations in shorter windows actually requires the filtering out of the unreliable low-frequency range [Leonardi and Van De Ville, 2015]. Indeed, it is only for window sizes of 100 seconds or more, where the full 0.01–0.1Hz is reliably measured, that the average detectability of resting-state networks in MREG data (∼70%, see Fig. 5) approximately matched the detectability achieved in the full-length 10-minute EPI datasets. While the temporal resolution of EPI is sufficient to adequately sample the dominant low-frequency resting-state BOLD fluctuations, high temporal resolution acquisitions nevertheless provide increased statistical power to detect correlated time courses within resting-state networks. Note, however, that in addition to the reduced frequency range measurable in shorter windows, MREG datasets are also affected by temporal autocorrelations, lower temporal signal-to-noise ratio (tSNR) and lower SNR per time frames which result in lower network detection performance for a given number of time points. However, tSNR per unit time is higher in MREG than EPI [Assländer et al., 2013; Jacobs et al., 2014], which contributes to improved subject-level network detection when analyzing the same time intervals.
One exception to the above observations was the basal ganglia network, which was detected better in MREG data even when using short time windows and with the same number of time points as EPI. Interestingly, this network is known to exhibit resting-state fluctuations at higher frequencies (0.25–0.75 Hz) [Kalcher et al., 2014], which can therefore be detected in short windows. For this network, the high temporal resolution of MREG is essential to adequately sample the fast BOLD fluctuations, in addition to the statistical advantages of an increased number of time points.
The current study used a relatively coarse spatial resolution (∼8mm when combining the effect of the acquired voxel sizes with the employed smoothing kernel), maximizing the detectability of RSN components in view of the similar resolution of the FIND RSN templates [Shirer et al., 2012] and to minimize inter-subject variability [Mikl et al., 2008]. A more detailed spatial characterization of the detected networks could nevertheless benefit from increased spatial resolutions. High-field MRI scanners allow even much smaller voxel sizes (1–2mm at 7T) [De Martino et al., 2011; Moeller et al., 2010; Poser et al., 2010] which can reduce partial-volume effects and increase spatial accuracy, although sub-second TRs are not achievable in whole-brain studies. At 3T, achieving fine spatial resolutions (∼2mm) would require trading off some temporal resolution using multi-shot techniques [Feinberg et al., 2010; Riemenschneider et al., 2016].The FIND functional templates used throughout this study originate from a group ICA study using a long scan time (10 minutes), a TR of 2s, and 30 components [Shirer et al., 2012]. It is however unclear to which extent the network components might differ when analyzing shorter time intervals, shorter TR, and a different number of ICs. In the absence of group studies performed under these different conditions that would allow the generation of better matching templates, it was thus simply assumed that the extracted RSNs should exhibit some overlap with the FIND templates, as measured by the Dice coefficients. The successful detection of RSN components demonstrates the applicability of this approach, although the occurrence of additional RSN components with different spatial profiles cannot be ruled out. Nonetheless, deciding on the number of independent components to extract remains a challenge in the ICA methodology. Using a large number of components may cause signal sources to be split into multiple components, making it hard to interpret the results, but the choice of a large number of components may be able to reveal weak sources as well. Conversely, using a small number of components may result in only networks accounting for the most variance (either due to large spatial extent or large amplitude) to appear in the ICA decomposition, while smaller components are not separated. In similarity calculations we aimed to quantify the sensitivity of the two sequences at different durations. Whenever possible we used a fixed number of components (100) for the ICA decomposition, beyond which no further change in network detection was observed. However, to avoid overfitting, we also ensured that the number of components never exceeded a small fraction of the number of time points [Greicius et al., 2004], particularly for EPI and at shorter durations. It should also be noted that the same Dice coefficient thresholds were used for analyses using different interval lengths and numbers of ICs. This ensured that the identified components always exhibited a similar level of similarity with the RSN templates, allowing a comparison of their detectability across the various analyzed conditions. For specific analyses using a given duration and number of ICs, it may be necessary to calculate individual thresholds tuned to the conditions under investigation.
It is generally agreed that imposing a high number of components to ICA (theoretically up to length of the data) will cause sources to split into multiple components. Moreover, if a network splits into multiple components, there is no guarantee that the network itself will also appear as a whole in another component [Jones et al., 2012]. Of particular note is the observation that some networks were associated with multiple components on average across all subjects with MREG. This can result when a given network becomes partitioned into several sub-networks, especially considering the relatively large number of components extracted in the analysis. In the last few years, it has been shown, for example, that the DMN is actually composed of distinct ventral and dorsal sub-networks [Assaf et al., 2010; Uddin et al., 2009]. Such sub-network separation can be detected in fMRI data acquired with conventional multi-slice EPI, but the analysis of MREG data revealed further splitting, with more sub-networks including right and left inferior parietal lobules of the DMN appearing as independent components. However, note that when split sub-networks were detected by ICA on MREG (for the dDMN, auditory, motor, and high visual networks in three subjects or more), in all cases a separate component representing the network as a whole also appeared. This allows differentiating between both common and specific aspects of various sub-regions of a network. In other words, the common time course of a network could be extracted along with the distinct fluctuations in each sub-network. This may be relevant in the investigation of bilateral networks such as auditory, secondary visual and motor networks, which tended to split into unilateral networks in addition to a bilateral component. In task-based fMRI, such separation is normally achieved by a combination of unilateral and bilateral stimuli; here we show that this can also be mapped in resting-state data when using fast fMRI. For the language network, its detection was generally low, even at longer scan times, but this likely originates from discordances with the template due to high variability of language network localization across individuals [Tie et al., 2014].
While most of the resting-state networks could be localized within short time intervals (less than a minute), this does not imply that resting-state fMRI measurements should be shortened accordingly. On the contrary, scans lasting several minutes can monitor the rich dynamic fluctuations in functional connectivity known to exist in the brain [Allen et al., 2014; Chang and Glover, 2010; Hutchison et al., 2013]. Still, fast fMRI shows a clear advantage in quantifying these fluctuations from one short time interval to the next, in the context of a longer scan time. Indeed, the analysis of fast dynamic network changes, based for example on sliding-window approaches, requires the robust determination of functional connections within sub-minute time intervals. Networks that were not detected within a 50s scan time are potentially reflecting transient periods of inactivity, and sliding-window ICA could allow tracking those networks [Kiviniemi et al., 2011]. However, in EPI data, our results show that the use of such short windows is not reliable. Within the same time intervals, the Z values of MREG networks were consistently higher than in EPI. FMRI data with high temporal resolution would thus appear highly beneficial for investigations of dynamic functional connectivity. The higher number of time points provided by fast fMRI sequences, whether MREG or other methods available [Setsompop et al., 2016], thus can provide more reliable estimates of functional connectivity in short time intervals and thus facilitate the tracking of dynamic connectivity fluctuations. Moreover, the higher-frequency information available in fast fMRI is necessary when investigating connectivity in short time windows, in order to avoid the calculation of spurious dynamic connectivity values [Lee et al., 2013; Leonardi and Van De Ville, 2015].
CONCLUSION
The aim of this study was to compare two functional imaging modalities, EPI and MREG by using the well accepted ICA methodology for the extraction of resting-state networks. The increased sampling rate of MREG relative to conventional EPI-based fMRI resulted in improved sensitivity and a higher number of detected sub-networks (in addition to the whole networks themselves) in individual subjects. Compared to EPI, MREG might thus greatly improve analyses of intra- and inter-network connectivity, and can also be applied to short time intervals, opening the door for reliable sliding-window dynamic connectivity investigations.


