Parkinson's disease-related network topographies characterized with resting state functional MRI
Conflict of Interest: D.E. serves on the scientific advisory board and has received honoraria from The Michael J. Fox Foundation for Parkinson's Research; is listed as coinventor of patents re: Markers for use in screening patients for nervous system dysfunction and a method and apparatus for using same, without financial gain; and has received research support from the NIH (NINDS, NIDCD, NIAID) and the Dana Foundation. All other authors declare no competing financial interests.
Abstract
Spatial covariance mapping can be used to identify and measure the activity of disease-related functional brain networks. While this approach has been widely used in the analysis of cerebral blood flow and metabolic PET scans, it is not clear whether it can be reliably applied to resting state functional MRI (rs-fMRI) data. In this study, we present a novel method based on independent component analysis (ICA) to characterize specific network topographies associated with Parkinson's disease (PD). Using rs-fMRI data from PD and healthy subjects, we used ICA with bootstrap resampling to identify a PD-related pattern that reliably discriminated the two groups. This topography, termed rs-MRI PD-related pattern (fPDRP), was similar to previously characterized disease-related patterns identified using metabolic PET imaging. Following pattern identification, we validated the fPDRP by computing its expression in rs-fMRI testing data on a prospective case basis. Indeed, significant increases in fPDRP expression were found in separate sets of PD and control subjects. In addition to providing a similar degree of group separation as PET, fPDRP values correlated with motor disability and declined toward normal with levodopa administration. Finally, we used this approach in conjunction with neuropsychological performance measures to identify a separate PD cognition-related pattern in the patients. This pattern, termed rs-fMRI PD cognition-related pattern (fPDCP), was topographically similar to its PET-derived counterpart. Subject scores for the fPDCP correlated with executive function in both training and testing data. These findings suggest that ICA can be used in conjunction with bootstrap resampling to identify and validate stable disease-related network topographies in rs-fMRI. Hum Brain Mapp 38:617–630, 2017. © 2016 Wiley Periodicals, Inc.
INTRODUCTION
Spatial covariance mapping is an analytical method being used currently to identify and measure the activity of large-scale brain networks in resting state functional imaging data [Eidelberg, 2009; Habeck and Stern, 2010; Spetsieris and Eidelberg, 2011]. This approach has been applied to scan data from individuals with brain disorders including Alzheimer's disease, Parkinson's disease (PD), Huntington's disease, Tourette syndrome, and dystonia [Carbon and Eidelberg, 2009; Feigin et al., 2007b; Habeck et al., 2008; Niethammer and Eidelberg, 2012; Pourfar et al., 2011], as well as healthy subjects [Spetsieris et al., 2015]. Of these, spatial covariance analysis has been used most extensively in the study of PD, revealing the presence of reproducible, highly specific network topographies associated with motor [Ma et al., 2007; Niethammer and Eidelberg, 2012; Spetsieris and Eidelberg, 2011; Teune et al., 2013; Wu et al., 2013] and cognitive [Huang et al., 2008; Mattis et al., 2011; Meles et al., 2015; Niethammer et al., 2013] disease manifestations. Indeed, quantitative measurements of the expression of these networks in individual subjects [Eidelberg, 2009; Spetsieris and Eidelberg, 2011] has been used prospectively to improve diagnostic accuracy in clinically uncertain cases [LeWitt et al., 2011; Tang et al., 2010b; Tripathi et al., 2016], objectively evaluate the effects of treatment [Asanuma et al., 2006; Feigin et al., 2007a; Mattis et al., 2011; Mure et al., 2011], measure the rate of disease progression [Huang et al., 2007b; Niethammer and Eidelberg, 2012; Tang et al., 2010a], and predict clinical outcome in individuals at risk for developing the disorder [Holtbernd et al., 2014; Wu et al., 2014].
Previous spatial covariance mapping studies relied mainly on metabolic brain imaging with 18F-fluorodeoxyglucose (FDG) positron emission tomography (PET), although the network algorithm has also been applied successfully with cerebral perfusion imaging using either single photon emission computed tomography or arterial spin labeling (ASL) magnetic resonance imaging (MRI) [Feigin et al., 2002; Holtbernd et al., 2014; Ma and Eidelberg, 2007; Ma et al., 2010; Melzer et al., 2011]. Indeed, these studies suggest that steady state functional imaging methods are generally conducive to network analysis using spatial covariance algorithms. It is not clear, however, whether this analytical approach is applicable to time course data as acquired with resting state functional MRI (rs-fMRI). In a recent rs-fMRI study [Wu et al., 2015], principal component analysis (PCA) was applied to averaged square root of the power maps of low-frequency blood oxygen level-dependent (BOLD) signal to identify a significant PD-related covariance pattern. Even so, discarding the temporal fluctuations that define rs-fMRI networks may compromise the accuracy and reliability of the derived network topographies.
Independent component analysis (ICA) [Beckmann et al., 2005; Calhoun et al., 2001a, 2001b; Damoiseaux et al., 2006; van de Ven et al., 2004] offers an alternative method to isolate disease-related networks from rs-fMRI data. This approach identifies maximally independent signal sources or imaging features in the observed temporal fluctuations [Calhoun et al., 2009]. ICA approaches to analyze rs-fMRI data have proven useful in characterizing large-scale brain networks at the individual or group levels. At the group level, spatial maps for a given network can be obtained using either dual regression or back-reconstruction methods [Calhoun et al., 2009; Filippini et al., 2009]. Nonetheless, group-level comparisons are usually performed using typical univariate voxel-wise techinques [Baggio et al., 2015; Calhoun et al., 2009; Filippini et al., 2009; Garcia-Garcia et al., 2013; Mohammadi et al., 2012; Yao et al., 2014] to characterize local changes within a specific component map. This approach, however, has limitations for single subject measurements of the activity of the network as a whole, which is crucial for many research applications. Indeed, to date, ICA methods have not been successfully used to identify replicable disease-related networks in rs-fMRI data, or to quantify the expression of these topographies prospectively on an individual case basis.
In this study, we describe a novel ICA approach for the identification and quantitative assessment of disease-related network topographies in rs-fMRI data. This is the first use of ICA to identify an rs-fMRI disease-related network topography that can be applied prospectively at the individual level. Our method takes advantage of ICA in that it does not require a priori selection of regions-of-interest as seed-based correlation does [Lee et al., 2013]. This approach can also reduce noise in contrast to methods such as amplitude of low-frequency fluctuation (ALFF) technique, which may be sensitive to the physiological noise in certain brain regions [Song et al., 2011]. In addition, the proposed method takes advantage of spatial covariance mapping algorithms which can identify disease-related topographies in patient groups, while quantifying abnormal network expression values in individual subjects [Eidelberg, 2009; Spetsieris et al., 2013]. Indeed, graph-theoretic analysis [Gottlich et al., 2013] can be used to identify a network topography, but does not routinely provide individual subject expression values. We identified and validated specific functional brain networks associated with motor and cognitive dysfunction in PD patients. The results were compared to the established PET-derived networks, which verified the robustness of the present rs-fMRI-derived networks.
MATERIALS AND METHODS
Subjects
We studied 20 PD subjects (14M/6F; age 59.8 ± 8.5 (mean ± SD) years) and 20 healthy controls (12M/8F; age 52.6 ± 9.3 years). These subjects underwent rs-fMRI on a General Electric 3.0 Tesla Signa HDxt scanner at North Shore University Hospital (NS). The PD subjects were scanned in a medication-free (off) state, approximately 12 h after the cessation of antiparkinsonian medication. Eight of the 20 PD subjects were additionally scanned in the medicated (on) state 1-2 h following their usual morning levodopa/carbidopa dose. The clinical characteristics of these subjects are provided in Supporting Information Table SI.
Of the subjects studied with rs-fMRI, 19 PD and 12 healthy subjects were additionally studied with FDG PET on the General Electric Advance PET tomograph at The Feinstein Institute for Medical Research. Fourteen additional PD (12M/2F; age 63.8 ± 11.3 years) and 14 healthy control (10M/4F; age 61.0 ± 11.7 years) subjects underwent rs-fMRI scans for validation. These subjects were scanned at the University of Florida at Gainesville (UF-G) using a 3.0 Tesla Siemens scanner.
All PD subjects were assessed at the time of rs-fMRI using the motor portion of the Unified Parkinson's Disease Rating Scale (UPDRS). Ratings in all subjects were obtained in the off-state. In addition to a composite UPDRS motor rating, each subject was rated on a subscale for akinesia-rigidity, defined by the sum of items 18 (speech), 19 (facial expression), 22 (rigidity), 27 (arising from chair), 28 (posture), 29 (gait), 30 (postural stability), and 31 (body bradykinesia). The subjects were separately rated for tremor according to a subscale defined by the sum of items 20 (tremor at rest) and 21 (action or postural tremor of hands) [Mure et al., 2011]. Motor manifestations of PD were considered to be tremor dominant if the summed limb UPDRS tremor scores were ≥ 4, with at least one limb scoring ≥ 2 [Isaias et al., 2010; Mure et al., 2011]. Of the 20 PD subjects, only five were tremor dominant based on these criteria. On-state UPDRS ratings were additionally obtained in the PD subjects who underwent repeat rs-fMRI in the treated condition. Nineteen PD subjects in the NS group underwent neuropsychological testing in the off-state according to a standardized test battery including California Verbal Learning Test (CVLTsum) [Huang et al., 2007a]. Ethical permission for these studies was obtained from the Institutional Review Boards of Northwell Health and UF-G. Written consent was obtained from each subject following detailed explanation of the procedures.
Resting State Functional MRI
Subjects were scanned in an awake, eyes open resting state; no specific task was performed in this condition. The rs-fMRI protocol involved an 8-min acquisition, with 240 volumes, FOV = 24 cm, TE = 28 ms, TR = 2 sec, flip angle 77°, 40 slices of 3-mm thickness. In addition, a T1-weighted structural image was acquired for each subject with FOV = 24 cm, TE = 2.9 ms, TR = 7.6 ms, TI = 650 ms, flip angle 8°, 176 slices of 1-mm thickness. The 8-min rs-fMRI acquisitions from both patients and control subjects were divided into two 4-min blocks. In each subject, each 4-min block was randomly assigned to a training set (used for pattern identification) or a testing set (used for prospective computation of subject scores, which quantify the expression of the resulting pattern in each of the subjects). In the NS PD cohort, rs-fMRI blocks acquired off medication were used either for training or for testing; blocks obtained in the on-state were used only for testing. In the UF-G cohort, PD subjects were scanned in the off-state; the resulting blocks were used exclusively for testing.
Pre-processing was performed using the FMRIB Software Library (FSL; www.fmrib.ox.ac.uk/fsl). The pre-processing included motion correction, brain extraction, spatial smoothing (kernel = 8 mm; FWHM) and temporal high-pass filtering (cutoff frequency = 1/120 Hz). We investigated the potential effects of motion by examining both relative and absolute motion displacement during the rs-fMRI exam in the NS and UF-G datasets. In each subject, head motion parameters were examined. All subjects had less than 1 mm of absolute motion displacement and less than 0.5 mm of relative motion displacement. There were no significant (P > 0.13) differences between PD patients and healthy control subjects in either relative or absolute movement displacement during rs-fMRI in either of the two datasets (Supporting Information Table SII). The resulting fMRI volumes were registered to the individual subject's structural T1 image and then to the standard Montreal Neurological Institute (MNI) 152 template. Finally, the rs-fMRI data were intensity normalized to reduce variability and improve the reliability of ICA maps.
Pattern Identification
Overview
A diagram of disease-related network analysis method using rs-fMRI is provided in Figure 1. The rs-fMRI data were then analyzed using group-wise spatial ICA [Calhoun et al., 2001a] with GIFT software (http://mialab.mrn.org/), in which 40 group independent components (ICs) were obtained. Subject spatial maps and temporal dynamics were estimated using dual regression [Filippini et al., 2009]. The number of components from the dataset was estimated using a minimum description length (MDL) criterion. Subject scores, reflecting the individual expression of each IC, were computed by taking the dot product of the mean group map with the subject's spatial map using the voxel-based computational algorithm described elsewhere [Spetsieris and Eidelberg, 2011; Spetsieris et al., 2013].

Identification and forward application of disease-related patterns using resting state fMRI. (A) rs-fMRI scan data are analyzed with spatial group ICA to generate group IC maps. Dual regression is then used to estimate spatial maps and temporal dynamics for individual subjects. Based on the group and subject maps, subject scores are computed, which represent the expression of each IC in a given subject's scan data. The ICs that best separate control and disease groups are selected by bootstrap resampling and logistic regression analysis. The disease-related pattern is determined as a linear combination of the selected group ICs; coefficients (region weights) on each IC are estimated through a second bootstrap procedure applied to the corresponding subject scores (see text). (B) For forward application in rs-fMRI scan data from prospective single cases, dual regression is used to estimate individual spatial maps for new subjects using the group IC maps identified in the pattern derivation procedure. Subject scores for the disease-related pattern are computed by linear combination of expression values for the selected ICs, using the coefficient defined in the derivation step.
Logistic regression (Matlab scripts, Mathworks) using a forward-selection method was then applied to the data to identify the subset of ICs associated with maximum separation of patient and control subject scores in the training dataset [cf., Spetsieris et al., 2013]. To improve the stability of the selected components and to optimize the estimation of model parameters, bootstrap resampling was performed in two stages: (1) The bootstrap was run 1,000 times on the training data to identify the ICs that discriminated the two groups with greatest frequency (Fig. 2A). The frequency criterion used for IC retention can be chosen by the user. In the current analysis, an objective threshold was provided by computing the inflection point of the IC frequency histogram derived from the logistic regression model performed for each bootstrap iteration (Fig. 2A,B); (2) After selecting the relevant ICs for pattern identification, bootstrap resampling was performed a second time (1,000 iterations) on the training data to estimate model parameters (Fig. 2C). A specific PD-related topographic pattern based on rs-fMRI, termed fPDRP (in contrast to its PET-based counterpart pattern, termed pPDRP), was determined as a linear combination of the selected group ICs; the weights (coefficients) for the component ICs were estimated through bootstrap followed by regression analysis of the corresponding subject scores. A quantitative measure of fPDRP expression (subject score) was computed for each of the subjects through linear combination of the scores for the individual ICs according to the estimated model coefficients. The details of the procedures used to extract and validate disease-related network topographies using rs-fMRI are as follows.

Network selection and parameter estimation. (A) Frequency histogram of ICs that best discriminate between the patient and control groups according to the bootstrap resampling procedure (1,000 iterations). ICs that are not selected or with frequency = 0 are not shown. (B) The plots show centered finite difference approximations to the first (dark blue) and second (red) derivative of the frequency histogram. The first derivative is minimal at IC3 and the second derivative changes sign between IC3 and IC28. Based on this inflection point, we selected three ICs (IC9, IC14, and IC3) for further analysis. (C) Frequency histograms of the estimated coefficients for IC9, IC14, and IC3 according to bootstrap resampling (1,000 iterations). For each iteration, model coefficient was estimated for which the associated subject scores best discriminated between patients and control subjects. The histogram provides an estimate of distribution of the model coefficients. In this case, the estimated mean values for the relevant ICs (0.7432 [IC9], 0.5393 [IC14], and 0.3959 [IC3]) were used to define the disease-related pattern. The same coefficients were used prospectively to compute corresponding expression values (scores) for the disease-related pattern in individual subjects.
Spatial group ICA
Prior to spatio-temporal ICA decomposition, PCA was applied to the data for purposes of: (1) decorrelation and whitening of the data covariance matrix at the individual subject and group levels, and (2) reduction in dimensions to match the number of extracted ICs. In the current rs-fMRI dataset, a model order of 40 ICs was determined based on MDL criteria [Calhoun et al., 2001a]. ICA decomposition was performed using the InfoMax algorithm. Reliability of the resulting ICs was estimated by bootstrap resampling (100 iterations) using ICASSO [Himberg et al., 2004] implemented in the GIFT toolbox. Centrotype estimates of the resulting stable components were used to define the group ICA maps used in the subsequent analyses.
In other words, we can define the rs-fMRI data matrix for a group of subjects as
 , where
 is the number of time points after data reduction and temporal concatenation and
 is the number of voxels corresponding to a 1-D vector reshaped from 3-D images. Note that
 denotes a matrix A whose dimensions are
 , where
 is the number of rows and
 is the number of columns. Group ICA spatial maps
 can be modeled by
 , where
 is an unmixing matrix that is estimated using an iterative algorithm, and
 is the number of desired ICs such that
 . In this study, ICs were labeled according to the GIFT toolbox.
Dual regression
To define spatial maps and associated time courses for individual subjects corresponding to the group ICA maps, we used a dual regression approach [Filippini et al., 2009], implemented in GIFT. First, after bootstrapping, the resulting set of group spatial maps was projected onto the rs-fMRI data for each subject according to a general linear model. This produces a set of subject-specific time courses associated with each of the group spatial ICA maps. Next, the resulting time courses are projected into the spatio-temporal data from each subject to yield a set of individualized spatial maps for each group ICA pattern.
In other words, dual regression yields pairs of subject-specific estimates in a dual space; these values jointly approximate the original group ICA map. In the first regression step,
 where
where
 is the rs-fMRI data matrix for subject
 and
and
 is estimated from group ICA. (Note that
 is the number of time points of the original data (without data reduction),
 is the number of voxels (3-D images were reshaped as a 1-D vector), and
 is the number of described ICs
 )). This model allows for the estimation of the time course matrix
 ) for subject
 . In the second regression step,
 and
and
 are known, and we can estimate an individual spatial map
 for that subject.
Network expression in individual subjects
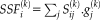
To measure the expression of a given ICA-based topography in individual case rs-fMRI data (referred to as the subject-specific factor (SSF) or subject score), we used a method analogous to that developed previously for single case computations in metabolic PET data [Eidelberg, 2009; Spetsieris and Eidelberg, 2011; Spetsieris et al., 2013]. In this study, we modeled the subject spatial map,
 , as the product of the subject score
 , denoting a scalar quantity representing the expression of pattern
 in subject
 , and
, and
 , denoting the corresponding group-wise spatial map, plus
 , a residual noise term not accounted for by the group ICs and the corresponding subject scores. By this formulation, a given IC is represented by the scalar projection of the individual subject's spatial map for that IC and the corresponding group map. That is,
 can be estimated as the dot product of the group spatial map and the subject spatial map. Note that the subject score of component
 in subject
 is the scalar projection of group spatial map of component
 onto the subject spatial map of component
 in subject
 .
.
 , where
 is the set of group spatial maps, represented by
 independent unitized column vectors, each with
 components (voxels), and
 is a matrix containing the subject spatial maps
 (subjects) as row vectors of dimension
 (
(
 (voxels)). The subject score is the dot product summed over the entire brain or brain mask. For each IC, a voxel-based mask was constructed using T > 3.4, P < 0.001 (peak voxel, uncorrected) as the cut-off.
Pattern selection
To ensure that network selection was data driven, all components, including those that were potentially artifactual, underwent full analysis. Expression values (SSFs) for all 40 ICs were computed for each of the patient and control rs-fMRI cases in the combined group training set. The resulting measures were entered into a logistic regression model to identify the subset of ICs whose subject scores discriminated best between the two groups.
To select a reduced set of ICs, 1,000 bootstrap samples were taken from expression scores of 40 ICs of all subjects in the training dataset using sampling with replacement. For each of these bootstrap samples, we identified the subset of ICs that best discriminated patients from control subjects. In aggregate, the samples were used to generate an IC histogram (Fig. 2A), the shape of which was used as the basis for pattern retention. In this study, the inflection point of the IC histogram provided a useful criterion for pattern selection.
Having selected a subset of ICs based on this criterion, additional bootstrap resampling was performed (1,000 iterations) to identify a specific PD-related pattern in the training data. This was done using the subject scores for the selected ICs to estimate the corresponding weights (coefficients) on each pattern that, in linear combination, best discriminated between patients and control subjects. In this case, the histograms of the model coefficients (Fig. 2C) provided weights of (0.7432, 0.5393, 0.3959) for IC9, IC14, and IC3, respectively.
PD-related pattern
Once the rs-fMRI PD-related topographic pattern (fPDRP) was generated, the same coefficients were applied to subject scores for the three ICs to compute a composite fPDRP subject score for each individual. Network expression in training as well as validation data was computed using the relevant group ICs in conjunction with the corresponding individual subject spatial maps extracted by dual regression. The raw time course data were not used for these computations.
PD cognition-related pattern
PD cognition-related pattern identification method using rs-fMRI has the same steps as disease-related pattern identification in Figure 1. However, only PD patients who underwent neuropsychological evaluation were included in this analysis. Linear regression was used to identify a subset of ICs that correlated with test performance in the training dataset of PD patients. As above, bootstrap resampling was performed in two stages to improve the stability of the selected components and to optimize the estimation of model parameters. The ICs that were selected for fPDRP were removed in this analysis. One thousand bootstrap samples were taken from expression scores of 37 ICs. For each of these bootstrap samples, we identified a subset of ICs that correlated with test performance. Having obtained a histogram of selected ICs (Supporting Information Fig. S1A), we used the inflection point criterion (Supporting Information Fig. S1B) as a threshold to select an appropriate number of ICs. In this analysis, the three ICs having the greatest frequency were selected (namely, IC18, IC5 and IC38). Bootstrap resampling (1,000 iterations) was performed on the subject scores for these ICs to estimate the optimal model of coefficients with which to generate the composite rs-fMRI PD cognition-related pattern (fPDCP). In this case, the weights were (0.4924, 0.4334, 0.4565) for IC18, IC5, and IC38, respectively. fPDCP subject scores were computed for each individual by linear combination of the scores for the individual ICs according to the estimated model coefficients.
Pattern Validation
fPDRP subject scores were correlated with UPDRS akinesia-rigidity, tremor and total motor ratings obtained in the NS derivation sample. To assess the test–retest reliability of measured fPDRP expression in individual subjects, subject scores for this pattern were computed prospectively in the 4-min rs-fMRI blocks that were not used for pattern identification (see above). Further validation was provided by computing fPDRP expression values in rs-fMRI scans from an independent testing sample scanned on a 3.0 Tesla MR platform at the UF-G. To obtain the same scan length as acquired in the NS testing data (see above), the first 4 mins of rs-fMRI acquisition were used in the analysis of the UF-G data. rs-fMRI pre-processing and registration to the MNI 152 template were performed as in the NS data. Subject spatial maps and temporal dynamics of this dataset were estimated using dual regression using the 40 mean group maps obtained in the NS data.
Forward Application
For a new subject who is not in the identification dataset, we can compute composite subject score as in Figure 1B. First, we estimate the spatial maps corresponding to group IC maps obtained in the identification step. We then compute subject scores by projecting selected group IC maps onto this subject spatial maps, and apply the same regression weights of selected ICs as in the identification step to compute composite subject score.
RESULTS
PD-Related Pattern
Pattern identification
In the training data, scans from PD patients and healthy control subjects were distinguished by expression values for IC9 (putamen/thalamus/cerebellum, P = 0.015), IC14 (cerebellum/pons/anterior cingulate cortex, P = 0.02), and IC3 (primary motor cortex/supplementary motor area, P = 0.09). The two groups were discriminated by a linear combination of these ICs (P < 0.005; permutation test, 5,000 iterations). The resulting rs-fMRI-based PD-related pattern, termed fPDRP (Fig. 3A; Supporting Information Table SIII), was defined by applying the corresponding coefficients to the voxel weights on each of the three ICs to form the composite disease-related pattern (see Methods). Voxel weights on the resulting disease-related topography correlated (r = 0.557, P < 0.05, corrected for spatial autocorrelation [Ko et al., 2014]) with those on the PET-based counterpart pattern, termed pPDRP.

PDRP identified with rs-fMRI. (A) PDRP identified in rs-fMRI (fPDRP, left) and PET (pPDRP, right) are shown on the MNI 152 template. fPDRP, derived from 20 normal controls and 20 PD patients, is characterized by increased activity in the basal ganglia, thalamus, cerebellum/pons, anterior cingulate cortex (ACC), and supplementary motor area (SMA). The major network regions that defined the fPDRP corresponded closely to the metabolically active (red areas) regional counterparts of the pPDRP topography. [The color stripes show Z-values thresholded at ±0.5. Activity increases (fPDRP) or relative metabolic increases (pPDRP) are displayed in red; relative metabolic decreases (pPDRP) are displayed in blue.] (B) Expression scores for fPDRP and pPDRP are increased in the PD patients compared to normal controls (NL) (P < 0.001; Student's t-test). [Error bars represent standard errors of the means.] (C) fPDRP subject scores correlated with UPDRS ratings for akinesia-rigidity (r = 0.61, P < 0.005, circles) in the PD subjects scanned at North Shore University Hospital; tremor ratings measured in the same subjects exhibited only a marginal relationship with network expression values (r = 0.39, P = 0.09, triangles).
Expression values (subject scores) were computed for the rs-fMRI- and PET-based network topographies (i.e., the f- and pPDRP, respectively) in individuals scanned with both imaging techniques. As expected, a significant correlation (r = 0.574, P < 0.005) was observed for expression values measured using the two methods. Moreover, subject scores for both patterns (Fig. 3B) were significantly elevated in PD relative to control subjects (P < 0.001; Student's t-tests). Indeed, significant increases in pattern expression (Fig. 4, middle) were seen in the testing scans of the PD subjects relative to their healthy counterparts (P = 0.008; Student's t-test). Analogous abnormal fPDRP elevations were observed (Supporting Information Fig. S2A) in tremor dominant (n = 5, P < 0.002) and atremulous (n = 15, P < 0.003; Student t-tests) PD patients; differences between subgroups in pattern expression were not significant (P = 0.35). Of note, group differences in PDRP expression were similar for subject scores measured using the PET- or rs-fMRI-based topographies (Supporting Information Fig. S2B).

Discrimination of PD from healthy subjects based on fPDRP expression values. fPDRP expression was increased in PD patients relative to normal (NL) subjects in the North Shore University Hospital (NS) training sample (left, P < 0.001). The difference is also significant in the NS (middle, P = 0.008) and UF-G (right, P = 0.026) testing samples. [Error bars represent standard errors of the means.]
Clinical–network correlations
fPDRP subject scores computed in the off-state in the NS sample (average of training and testing values) correlated with concurrent UPDRS motor ratings obtained at the time of rs-fMRI (r = 0.54, P < 0.02). Correlations between fPDRP expression and UPDRS subscale ratings were examined in this cohort. This analysis (Fig. 3C) revealed a significant network relationship with akinesia-rigidity (r = 0.61, P < 0.005; circles) but not tremor (r = 0.39, P = 0.09; triangles).
Validation cohort
Abnormal fPDRP elevations (Fig. 4, right) were also observed in rs-fMRI scans from the independent UF-G testing sample (P = 0.026). fPDRP subject scores computed in this group fell on the fitted line that related network expression to UPDRS motor ratings in the NS patient cohort. A significant correlation was present between the two variables measured in the combined NS and UF-G PD patient sample (r = 0.48, P < 0.005).
fPDRP expression values: test–retest reliability and levodopa response
fPDRP subject scores demonstrated good test–retest reliability (ICC = 0.72, 95% CI = [0.287, 0.895], P < 0.005). To evaluate the effect of levodopa treatment on fPDRP expression in individual patients, we compared subject scores measured off- and on-medication in the eight PD subjects who underwent rs-fMRI in both treatment conditions. Levodopa-mediated reductions in fPDRP expression (Fig. 5A) were seen in seven out of the eight PD subjects (P = 0.017; paired Student's t-test), with a decline in baseline network levels toward normal. A significant correlation (Fig. 5B) was observed between levodopa-mediated changes in fPDRP expression (ΔfPDRP[OFF – ON]) and baseline fPDRP expression measured in the unmedicated state (r = 0.656, P < 0.05).

Effect of levodopa administration on fPDRP network expression. (A) fPDRP expression was abnormally elevated in rs-fMRI scans from eight PD subjects studied in the unmedicated off-state (OFF). Network activity declined (P = 0.017; paired Student's t-test) when these subjects were re-scanned in the on-state (ON) approximately 1 h following their usual dose of dopaminergic medication. [Error bars represent standard errors of the means.] (B) The baseline fPDRP expression scores off medication significantly correlated with the levodopa-mediated changes in fPDRP expression (ΔfPDRP[OFF – ON]) (r = 0.66, P < 0.05; Pearson's correlation).
PD Cognition-Related Pattern
We also utilized the ICA approach to identify an independent cognition-related network topography in the PD rs-fMRI training data. In the PD derivation cohort, performance on the CVLTsum, a measure of memory and executive function, was correlated with expression values for IC18 (cerebellum, r = −0.27, P = 0.13), IC5 (default-mode network including parietal/frontal/temporal, r = −0.46, P = 0.026), and IC38 (frontal, r = −0.25, P = 0.15). Accordingly, a multiple regression model was constructed based on subject scores for each of these component topographies and used to estimate the respective coefficients. These, in turn, were applied to the corresponding voxel weights to generate a specific PD cognition-related pattern (fPDCP) for the PD group. Indeed, subject scores for the resulting composite pattern exhibited a stable linear relationship with the CVLTsum performance measure (r = −0.58, P = 0.005; permutation test, 5,000 iterations). The fPDCP topography (Fig. 6A; Supporting Information Table SIV) was similar to that of its previously validated PET-based counterpart; a marginal correlation (r = 0.3, P = 0.05, corrected for spatial autocorrelation) was discerned between the two topographies. fPDCP subject scores displayed excellent test–retest reliability (ICC = 0.795, 95% CI = [0.459,0.922], P = 0.001) in training and testing blocks obtained in the same individuals. Indeed, significant correlations with CVLTsum scores were observed for fPDCP expression values computed in training (r = −0.69, P < 0.001) as well as testing (r = −0.52, P < 0.02) rs-fMRI scan blocks (Fig. 6B, solid and dashed lines, respectively). In contrast to fPDRP expression values, fPDCP subject scores did not correlate (P = 0.26) with UPDRS motor ratings obtained in the same patients at the time of rs-fMRI. Analogously, a significant correlation with CVLTsum was evident for fPDCP scores (average subject scores for training and testing values) (r = −0.65, P < 0.005), but not for fPDRP expression values for the same group of subjects.

PDCP identified with rs-fMRI. (A) PDCP topographies identified in rs-fMRI (fPDCP, top) and PET (pPDCP, bottom) data are shown on the MNI 152 template. fPDCP, derived from 19 PD patients, is characterized by a negative correlation between pattern expression and performance on the California Verbal Learning Test (CVLTsum). [The color stripes show Z-values thresholded at ±1.0. Relative metabolic increases (pPDCP) are displayed in red; negative correlation (fPDCP) and relative metabolic decreases (pPDCP) are displayed in blue.] (B) fPDCP expression values correlated significantly with performance on CVLTsum, a measure of memory and executive function, in the training data (open circles, solid line; r = −0.69, P < 0.001) and in the within-subject testing data (filled circles, dashed line; r = −0.52, P < 0.02; Pearson's correlations).
DISCUSSION
Use of ICA to Identify Disease-Related Topographies
In this study, we developed a novel method for the identification and quantitative assessment of disease-specific network topographies using rs-fMRI and ICA approach followed by multivariate analysis. The disease-related pattern and disease-related subject score obtained from rs-fMRI provide a summary of circuit abnormalities in the brain networks. The disease-related pattern can be more easily interpreted as a signature of neural networks than common univariate voxel-wise approaches, which cannot directly address interregional correlation in the brain. In univariate approaches, voxel-wise analysis has to be performed for all IC networks with multiple-comparison correction across these ICs. Another advantage of the present approach compared to univariate methods is the ability to apply it prospectively at the individual level [Habeck, 2010; Spetsieris et al., 2013]. As demonstrated by the UF-G testing data, there was no need to update the fPDRP topography when computing expression values for new subjects that were not used to identify the original pattern. Rather, subject scores and temporal dynamics can be estimated for prospective cases with dual regression using the spatial maps generated from the training set. Indeed, individual subject expression values for the disease-related topography can be computed in testing scan data using precisely the same formulation as in the training set. Prospective single case computation of individual subject expression values for the disease-specific group pattern is a critical function for clinical investigation. Subject scores for the disease network computed in this way can be correlated with independent descriptors of the severity of clinical manifestations such as UPDRS motor ratings or indices of cognitive disability without additional data mining. Moreover, over-fitting bias can be reduced by the two-stage bootstrap method, which effectively lowers the search space to only 2-3 relevant dimensions.
rs-fMRI has been used to study topographic changes in PD subjects [Prodoehl et al., 2014]. Regional differences in ALFF map were used to distinguish PD patients from control individuals [Skidmore et al., 2013a, 2013b]. Changes in neural activity and functional connectivity in PD has also been reported using seed-based correlations [Helmich et al., 2011; Wu et al., 2011], ICA followed by univariate voxel-wise searches [Szewczyk-Krolikowski et al., 2014], and by graph-theory analysis [Gottlich et al., 2013]. Within-network abnormalities in the default-mode network and the dorsal attention network [Baggio et al., 2015] in PD with and without mild cognitive impairment [Amboni et al., 2015; Tessitore et al., 2012] have also been reported using ICA techniques. Nonetheless, this is the first use of ICA to identify a reproducible rs-fMRI PD-related network topography that is stable enough for prospective use in individual subjects. We note that in a recent rs-fMRI study, PCA was applied to ALFF maps from PD patients and healthy subjects to identify a PDRP-like covariance topography in the data [Wu et al., 2015]. To compare the two approaches, we applied the ALFF/PCA method to the same rs-fMRI dataset used in this study for fPDRP derivation. Thus, for each voxel, we computed the averaged square root of BOLD signal power in the 0.01–0.08 Hz window, normalized by mean within-brain ALFF value for that subject. A PDRP was identified in the combined group ALFF scan data (ALFF-PDRP) using the method described in the earlier publication [Wu et al., 2015]. While a discrete disease-related covariance pattern was detected using this PCA approach, group differences in pattern expression were modest by comparison with ICA (training: P < 0.01; testing: P < 0.02 for PD > NL; Student's t-tests). There may be several reasons for this difference: First, while ICA approach can reduce noise and separate artifacts, ALFF is sensitive to the physiological noise found in certain brain regions [Song et al., 2011]. Secondly, in the study by Wu et al. [2015], the averaged square root of the power of BOLD signal was computed in a frequency range of 0.01-0.08 Hz. However, different brain regions have different frequency responses. For example, the ALFF over a frequency range of 0.027–0.073 Hz is more specific to the basal ganglia than other frequency ranges [Zuo et al., 2010]. Another study showed that the decreased ALFF in amnestic mild cognitive impairment was more prominent in a frequency range of 0.01–0.027 Hz [Han et al., 2011]. Thus, ALFF over a frequency range of 0.01–0.08 Hz may have failed to capture specific non-Gaussian components identified by the ICA approach. Indeed, discarding the temporal fluctuations that define rs-fMRI networks by calculating averaged square root of the power of low-frequency BOLD signal may limit the sensitivity of the derived network topographies. Nonetheless, a formal comparison of these two methods is necessary to confirm these observations.
Disease-Related Network Topographies: rs-fMRI Versus PET
In this study, we identified a distinct PD-related topography in the rs-fMRI data that distinguished patients from healthy control subjects in the pattern derivation (training) set and in an independent validation (testing) cohort. The fPDRP pattern was similar to that of its PET-derived pPDRP counterpart with remarkable homology of the relatively active (red) network areas in the basal ganglia, thalamus, pons/cerebellum and peri-rolandic cortex, which characterize this disease-related functional topography [Eidelberg, 2009; Niethammer and Eidelberg, 2012]. As with PET-based topography, the expression of the fPDRP declines toward normal with dopaminergic treatment [Hirano et al., 2008]. Furthermore, fPDRP expression positively correlated with motor UPDRS scores as reported with pPDRP [Asanuma et al., 2006; Eidelberg, 2009].
The fPDCP also resembled its PET-derived pPDCP counterpart topography. Indeed, the two patterns were characterized by relatively reduced regional activity in the precuneus and medial parietal cortex and in medial prefrontal and supplementary motor regions [Huang et al., 2007a]. Interestingly, the fPDCP also included underactive (blue) regions in the thalamus and inferior parietal cortex that have subsequently been found also to contribute to the pPDCP topography [Meles et al., 2015]. As with pPDCP, fPDCP scores correlated with performance on tests of memory and executive functioning rather than motor disability [Huang et al., 2007a]. These features suggest that, if replicated, the fPDCP may have utility as a non-invasive functional biomarker of cognitive impairment in non-demented PD patients [Huang et al., 2008; Mattis et al., 2011].
CONCLUSION
Using the novel ICA-based approach described, we identified and validated specific PD-related motor and cognition networks in rs-fMRI scan data. The spatial topographies and behavior of the rs-fMRI-based fPDRP and fPDCP networks resembled those of the metabolic covariance patterns that were previously characterized using FDG PET. The stability of network expression values in rs-fMRI testing data from individual subjects, and the reproducible correlations of those measures with independent clinical descriptors obtained concurrently in the same individuals support the potential use of rs-fMRI to identify specific network biomarkers for brain disorders.
ACKNOWLEDGMENTS
The content is solely the responsibility of the authors and does not necessarily represent the official views of the National Institute of Neurological Disorders and Stroke or the National Institutes of Health. The sponsor did not play a role in study design, collection, analysis and interpretation of data, writing of the report or in the decision to submit the paper for publication. The authors wish to thank Ms. Yoon Young Choi and Mr. Michael Small for valuable assistance with manuscript preparation/copyediting.