Network dynamics during the different stages of hallucinations in schizophrenia
Abstract
The majority of patients with schizophrenia suffer from hallucinations. While the triple-network model, which includes the default mode network (DMN), the central executive network (CEN) and the salience network (SAL), has recently been applied to schizophrenia, how this framework could explain the emergence of hallucinations remains unclear. Therefore, complementary brain regions that have been linked to hallucinations, such as the left hippocampus, should also be considered and added to this model. Accordingly, the present study explored the effective connectivity across these four components (i.e., the quadripartite model) during the different stages of hallucinations. Twenty-five patients with schizophrenia participated in a single session of resting-state functional magnetic resonance imaging to capture hallucinatory experiences. Based on the participants' self-report of the psychosensory experiences that occurred during scanning, hallucinatory experiences were identified and divided into four stages: periods without hallucination (“OFF”), periods with hallucination (“ON”), transition periods between “OFF” and “ON”, and the extinction of the hallucinatory experience (“END”). Using stochastic dynamic causal modeling analysis, this study first confirmed that the SAL played a critical and causal role in switching between the CEN and the DMN in schizophrenia. In addition, effective connectivity within the quadripartite model depended on the hallucinatory stage. In particular, “ON” periods were linked to memory-based sensory input from the hippocampus to the SAL, while “END” periods were associated with a takeover of the CEN in favor of a voluntary process. Finally, the pathophysiological and therapeutic implications of these findings are critically discussed. Hum Brain Mapp 37:2571–2586, 2016. © 2016 Wiley Periodicals, Inc.
Abbreviations
-
- AHRS
-
- Auditory Hallucination Rating Scale
-
- CEN
-
- Central executive network
-
- CGI
-
- Clinical Global Impression scale
-
- DCM
-
- Dynamic causal modeling
-
- DMN
-
- Default mode network
-
- GLM
-
- General linear model
-
- NOI
-
- Networks of interest
-
- PANSS
-
- Positive and Negative Syndrome Scale
-
- ROI
-
- Regions of interest
-
- SAL
-
- Salience network
-
- VAS
-
- Visual analogue scale
INTRODUCTION
Hallucinations can be defined as transient, intrusive and unintentional perceptions in the absence of external sensory stimulation [Aleman and Laroi, 2008; Blom, 2010; Waters et al., 2006]. Hallucinations are a frequent symptom of schizophrenia and are observed in 70% of patients [Chaudhury, 2010; Sartorius et al., 1986]. These experiences can occur in every sensory modality, although auditory and visual hallucinations are the most frequent [Chaudhury, 2010]. Currently, the neural underpinning of hallucinations is unresolved: however, modality-specific sensory cortices have been shown to exhibit increased basal activity during hallucinatory experiences [Jardri et al., 2013]. Recruitment of the anterior insula and the hippocampal complex have also been demonstrated [Jardri et al., 2011]. However, beyond topography, abnormal circuitry at both the structural [Geoffroy et al., 2014] and functional [Amad et al., 2014; Rolland et al., 2015] level has been associated with hallucinations. Because there is also considerable evidence of dysconnectivity in schizophrenia [Stephan et al., 2009], it is crucial to disentangle whether abnormal connectivity is a disease factor (i.e., associated with schizophrenia) or a symptom factor (associated with hallucinations per se). The current paper is an effort toward clarifying network dynamics during the occurrence of hallucinations.
Along this line of reasoning, the present study will refer to the “triple-network theory”, which has been recently proposed to account for various psychiatric disorders [Menon, 2011]. It appears that an isolated brain lesion or dysfunction cannot be responsible for the whole clinical spectrum of mental disorders (in contrast to models for stroke or other common neurological diseases) and especially cannot explain the intermittence of the occurrence of hallucinations, which might be better explained by aberrant integration and connectivity between large-scale networks [Stephan et al., 2009]. Indeed, the study of functional connectivity with resting-state functional magnetic resonance imaging (rs-fMRI) has revealed that impairment in the interaction between several intrinsic connectivity networks (ICNs) could be related to specific psychopathological processes [Menon, 2011]. Notably, this is the case for ICNs that are involved in higher cognitive functions, such as the default mode network (DMN), the central executive network (CEN) and the salience network (SAL). The DMN is the typical resting brain network and is deactivated during cognitive tasks. The DMN includes the posterior cingulate cortex, medial prefrontal cortex, medial temporal cortex and lateral parietal cortex [Buckner et al., 2008]. Conversely, the CEN, which consists of the bilateral dorsolateral prefrontal and posterior parietal cortices, is recruited during tasks that are highly cognitively demanding [Seeley et al., 2007]. The SAL is involved in the detection and integration of relevant interoceptive and emotional information and consists of the anterior insula, the striatum and the dorsal anterior cingulate cortex [Seeley et al., 2007]. Because the DMN and the CEN are involved in opposing cognitive states (the DMN is involved in the resting state, whereas the CEN is involved in states of high cognitive demand), their recruitment is mutually exclusive (i.e., the DMN is disengaged during cognitive tasks). A study conducted in healthy subjects that employed Granger Causality Mapping demonstrated that areas of the SAL played a critical and causal role in switching between the DMN and CEN [Sridharan et al., 2008]. More precisely, the insula, which is part of the SAL, appears to detect salient events and to orient resources toward the appropriate ICNs, notably by focusing attention on pertinent stimuli in the environment.
The triple-network model was recently shown to be involved in schizophrenia [Menon, 2011]. Structural and functional reorganization of the insula in schizophrenia was shown to be associated with aberrant salience processing, a phenomenon known to be critical in some psychotic manifestations [Palaniyappan and Liddle, 2012]. In addition, interactions within and across the DMN and CEN are known to be impaired in schizophrenia [Hasenkamp et al., 2011; Uddin, 2015]. As the anterior insula is involved in the control of the DMN/CEN switch [Goulden et al., 2014; Uddin, 2015], some authors have hypothesized that impairments in the processing of salient stimuli may affect the switch between the DMN and CEN (i.e., unstable DMN/CEN fluctuations) in this disorder [Manoliu et al., 2014]. This dysfunction was found to be associated with increased interactions between the DMN and CEN and decreased connections from the SAL to the DMN and CEN in patients with schizophrenia compared with healthy volunteers. Impaired processing of salient stimuli could lead the subject to experience aberrant internal salient phenomena such as unsolicited percepts or memory traces.
Some studies have explored intrinsic connectivity impairment in schizophrenia patients [Bastos-Leite et al., 2015; Spaniel et al., in press] suffering from auditory hallucinations (for a review, see [Alderson-Day et al., 2015]). Previous studies have also compared ICNs between patients and non-clinical volunteers [Fogelson et al., 2014; Wagner et al., 2015; Wolf et al., 2009; Wolf et al., 2011a] as well as between hallucinators and non-hallucinators [Allen et al., 2012; Hoffman et al., 2011; Hoffman and Hampson, 2011; Rotarska-Jagiela et al., 2010]. Nevertheless, no study has investigated the neural substrates that are directly involved in the emergence of the hallucinatory experience.
In particular, these studies did not explore state changes in the connectivity of the ICNs in patients with hallucinations (i.e., by comparing the ICNs between periods with and periods without hallucinations). Beyond a strict on/off dichotomy, it is important to elucidate the chronological sequence of interactions between ICNs that may lead to hallucinations. Interestingly, abnormal instability of the DMN during hallucinations has been reported in adolescents who experience first-episode psychosis with auditory and visual hallucinations [Jardri et al., 2013]. Due to the strong functional link between the CEN, SAL and DMN, it is possible that the DMN, as well as the two other ICNs, is involved in the hallucinatory experience.
Recent studies have also demonstrated that the occurrence of hallucinations is associated with structural and functional changes of the hippocampal complex (i.e., the hippocampus and parahippocampus) and, in particular, of the left hippocampus [Jardri et al., 2013]. First, the hippocampal complex exhibits direct connections to the language network as well as specific anatomical-functional connectivity patterns during hallucinations [Amad et al., 2014]. Second, coordinate-based meta-analyses [Jardri et al., 2011] have demonstrated activation of the left hippocampal complex during hallucinations and, more specifically, prior to the emergence of the hallucinatory state [Diederen et al., 2010, Hoffman et al., 2008]. Finally, memory-based theories of hallucinations [Copolov et al., 2003; Waters et al., 2006] suggest the particular importance of the hippocampal complex in the recall of strongly activated but incomplete memory fragments. Altogether, these potential roles of the left hippocampal complex in the cascade of activations measured during hallucinations make this node an ideal candidate to interact with the ICNs, independent of the sensory modality involved in the experiences. Thus, based on these observations, a quadripartite model (including the 3 ICNs and the left hippocampus) might account for the occurrence of hallucinations.
To test the hypothesis that a quadripartite model might account for the occurrence of hallucinations in schizophrenia, we measured the effective connectivity between the SAL, CEN, DMN and the left hippocampus during the different stages of a hallucination: from initiation, to full perception and finally, to extinction. We hypothesized that the effective connectivity between the 3 selected ICNs and the left hippocampus is modulated by the stage of the hallucinatory experience independent of the sensory modality involved. This main hypothesis was divided into two sub-hypotheses: (i) an insular modulation hypothesis, which stipulates that a hallucination occurs when aberrant salience processing due to structural and functional changes in the insula induces dysfunction in the processing of salient/non-salient stimuli, potentially leading to aberrant switches between the CEN and DMN [Goulden et al., 2014; Menon and Uddin, 2010; Uddin, 2015]; and (ii) a hippocampal modulation hypothesis, which stipulates that the hippocampus may also be at the root of the ICN dysregulation responsible for hallucinations because fluctuations in hippocampal activity have been shown to precede the occurrence of hallucinations [Amad et al., 2014; Diederen et al., 2010].
MATERIALS AND METHODS
Population
Twenty-five patients with a diagnosis of schizophrenia (DSM-IV-TR criteria) were enrolled in this study (Table 1). The Positive and Negative Syndrome Scale (PANSS) [Kay et al., 1987] was used to evaluate general psychopathology and to quantify symptom severity. The Clinical Global Impression scale (CGI) was also used to quantify the patients' impairment. All patients routinely presented frequent (more than 10 per day) and resistant hallucinations as evaluated with item P3 of the PANSS, the Auditory Hallucination Rating Scale (AHRS) and a visual analogue scale (VAS); these three measures were used to evaluate the frequency, intensity and discomfort of hallucinations. During the rs-fMRI study of the subjects' hallucinatory experiences, hallucinations were observed in all sensory modalities (i.e., auditory, visual, cenesthetic, olfactory and gustatory), and several patients also exhibited multisensory hallucinations (Table 1); the modalities of the hallucinations the patients experienced in the scanner were consistent with the modalities of their daily life hallucination report. The exclusion criteria included the presence of an Axis-II diagnosis, secondary Axis-I diagnosis, neurological or sensory disorder, and a history of drug abuse, which was based on a clinical interview and urine tests that were administered at admission. The study was approved by the local ethics committee (CPP Nord-Ouest IV, France), and written informed consent was obtained from each patient.
| Age (years ± SD) | 33 ± 9 |
| Gender | 7F 18 M |
| CGI | 4.75 ± 1.39 |
| Equivalent olanzapine (mg/d) | 37.7 ± 17.9 |
| PANSS | 85 ± 21 |
| P3 | 5.30 ± 0.85 |
| Modality during rs-fMRI | A = 24, V = 12, C = 8, O = 4, G =1 |
| AHRS | 26.2 ± 7.4 |
| VAS frequency | 5.76 ± 2.49 |
| VAS intensity | 6.29 ± 2.29 |
| VAS discomfort | 6.95 ± 1.86 |
- CGI = Clinical Global Impressions Scale; PANSS = Positive and Negative Syndrome Scale; P3 = Item P3 of the PANSS; rs-fMRI: resting state functional magnetic resonance imaging; AHRS = Auditory Hallucination Rating scale; VAS = Visual analogue scale; A = Auditory; V = Visual; C = Coenestesic; O = Olfactory; G = Gustatory.
Procedure, MRI Acquisition, and Preprocessing
After clinical evaluation, the patients participated in a single session of MRI acquisition, which included an anatomical run and a 15-min rs-fMRI run to capture hallucinations. Thus, the patients were their own controls as we distinguished between symptomatic periods and hallucination-free periods. The rs-fMRI acquisition was followed by a post-MRI interview [see (Jardri et al., 2013)] during which each patient reported the psychosensory experiences that occurred during scanning. This interview explored four aspects of the hallucinatory experiences that occurred during the acquisition: the modality, the relative moment of apparition, the duration and the frequency of the experience(s). If a hallucination did not occur during the 15-min session, a new rs-fMRI session was proposed to increase the chance of capturing a hallucinatory experience in each patient. Only patients who described at least one hallucinatory experience during the rs-fMRI sessions were included in the study (patients presented an average of four hallucinatory periods per session). A 3T Intera Achieva MRI scanner with a 12-channel head coil (Philips™) was used to acquire the 3D T1 anatomical scans and the rs-fMRI scans of brain activity with a 3D ultrafast gradient echo sequence that combined whole-brain coverage with T2* weighted imaging (PRinciples of Echo Shifting using a Train of Observations, PRESTO sequence [Liu et al., 1993; Neggers et al., 2008; van Gelderen et al., 2012]). The 3D-PRESTO sequence allowed for functional brain coverage every 1000 msec. Such temporal resolution appears to be crucial for appropriate effective connectivity analysis [Deshpande and Hu, 2012]. To define hallucinatory experiences, the anatomical and functional data were preprocessed and analyzed using BrainVoyager software (BVQX v2.8.4, Maastricht) using cortex-based independent component analysis (cb-ICA) [Goebel, 2012] and Statistical Parametric Mapping software (SPM12, London) for dynamic causal modelling (DCM), which were determined to be optimal for this analysis [Ashburner, 2012]. Details regarding the MR sequence parameters and MRI data preprocessing steps are provided in the Supporting Information Methods (1-3).
Hallucinatory experiences were defined using cortex-based independent component analysis (cb-ICA). For each patient, cb-ICA (using the spatial decomposition algorithm “FastICA” [Hyvarinen, 1999]) was used to extract 50 independent components (ICs) from the rs-fMRI signal of the cortical voxels of the matrix.
To identify hallucinatory experiences that occurred during scanning, a 3-step procedure developed by Jardri et al. [2013] was followed. First, in each patient, the “IC-fingerprint” method [De Martino et al., 2007] was used to select ICs related to a neurophysiological source (BOLD-related ICs). Second, within the resulting BOLD-related ICs, only one IC in which the evolution of the time course reflected the patient's self-report of the timing and duration of hallucinatory experiences was selected. Third, the time course of the selected IC was compared with that of the DMN-IC to check for anti-correlation (Pearson correlation) during the hallucinatory period (see next paragraph for period definition) [Jardri et al., 2013].
Periods of increased BOLD signal (Z-score > 0) that were maintained for at least 13 seconds (13 consecutive volumes) were considered eligible “ON” periods (i.e., the “hallucination” periods, as reported by the patient). The “OFF” periods, which corresponded to periods without sensory experience, were defined as a decrease in the BOLD signal (Z-score < 0) that occurred prior to the “ON” periods and persisted for at least 5 consecutives scans and until the negative Z-score peak. The “TRANS” periods, which corresponded to the transition periods between the “OFF” and “ON” periods, were defined from the last volume of the “OFF” period to the first volume of the “ON” period. Finally, the “END” periods, which corresponded to the transition out of the hallucinatory experience, were defined as the 3 last volumes of the “hallucination” (Z-score > 0) and the following 3 volumes.
Whole-Group Activations During the “ON” Period
To confirm the capture of a hallucination, a whole-group (involving the 25 patients) random effect (RFX) analysis was constructed using a general linear model (GLM). This analysis was used to explore the whole-brain activity that was associated with the “ON” periods compared to baseline.
Dynamic Causal Modeling (DCM)
A stochastic DCM analysis was performed using SPM12 to explore the effective connectivity between regions of interest (ROIs) [or networks of interest (NOIs)] during each period of the hallucinatory experience. Based on previous reports from our group and others, we considered three NOIs, the SAL, the CEN, and the DMN, and one ROI, the left hippocampus. At a more technical level, definitions of the DMN do not always include the hippocampal complex and, more globally, MTL nodes [Ward et al., 2014]. In our sample, the selected DMN encompassed this area in less than 1/3 of the participants. Moreover, the time course of the DMN was not correlated with that of the left hippocampus, ruling out the possibility that the left hippocampus belongs to the DMN in this case. We thus decided to include the hippocampus as a separate ROI in the analysis because it did not seem to be part of the DMN.
The three networks were individually identified in each patient through the cb-ICA analysis (Supporting Information Methods 3), and the entire component map was used as an NOI. For the hippocampus, a 5-mm sphere that was centered on x = −24, y = −32, z = −4 [coordinates in Talairach space from (Jardri et al., 2011)] was used.
Multiple modulatory inputs may be included in DCM, but because it is not possible to explore different nonlinear ROI-mediated modulations of endogenous connections within the same model, we used a dedicated method to isolate ROI-mediated modulation in each of the different conditions. In each patient, 24 models were thus specified for each period [“OFF”, “TRANS”, “ON”, and “END”] of the hallucinatory experience (i.e., reflecting inputs entering the system) (Fig. 1). According to DCM notation, the hallucinatory stages are referred to as “modulatory input” regardless of the direction of the causal link (no assumptions were made concerning the “causal” nature of the relationship between the hallucinatory periods and the connectivity modulation).
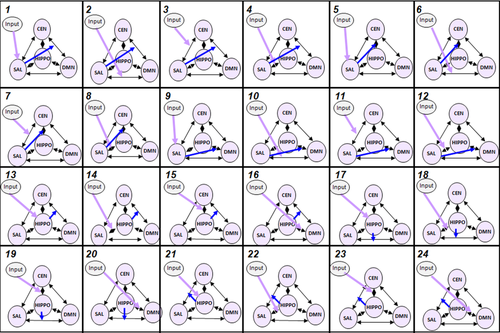
Models. In this study, 24 models were tested: 12 with nonlinear modulation by the salience network (SAL) and 12 with nonlinear modulation by the left hippocampal complex (HIPPO). Different possible driving inputs were included to determine if the period of hallucinatory occurrence (inputs) influenced the SAL (or its connections with the CEN, DMN or HIPPO) or the HIPPO (or its connections with the CEN, DMN or SAL). DMN: Default mode network. CEN: central executive network. Purple: driving input; Blue: nonlinear modulation. [Color figure can be viewed in the online issue, which is available at wileyonlinelibrary.com.]
Each model included the three following NOIs, the DMN, the CEN, and the SAL, the additional ROI of the left hippocampus and the endogenous bidirectional connections between them. One driving input was added to reflect the effect of the period of the hallucinatory experience on the SAL and its connections with the CEN, DMN and left hippocampus or on the left hippocampus and its connections with the CEN, DMN and SAL. The first 12 models specified nonlinear SAL-mediated modulation of the connections between the DMN and the CEN (models 1–4), the left hippocampus and the CEN (models 5–8) and the left hippocampus and the DMN (models 9–12). The next 12 models specified nonlinear hippocampus-mediated modulation of the connections between the DMN and the CEN (models 13–16), the SAL and the DMN (models 17–20) and the SAL and the CEN (models 21–24). Following model estimation, the fixed-effects Bayesian model selection (FFX BMS) method [Kahan et al., 2014; Stephan et al., 2010] was used to infer which model would be best suited for each hallucination period.
To better describe the interactions associated with the occurrence of hallucinations, the most accurate models for each period were decomposed to test for unidirectional connections (e.g., dissociating connections from the CEN to the DMN or the reverse—dissociating connections from the DMN to the CEN). Accordingly, a second FFX BMS analysis was performed for each period to select the best unidirectional model.
RESULTS
The Neural Dynamics of the Selected IC and the DMN
Across the study cohort, the time course of the selected IC was anticorrelated with that of the DMN (Supporting Information Material 4) during the “ON” periods (r2 = −0.36; P = 0.01) (Fig. 2) but was positively correlated with that of the DMN during the “OFF” periods (r2 = 0.45; P = 0.008). No statistically significant correlations were observed during the “TRANS” and “END” periods.
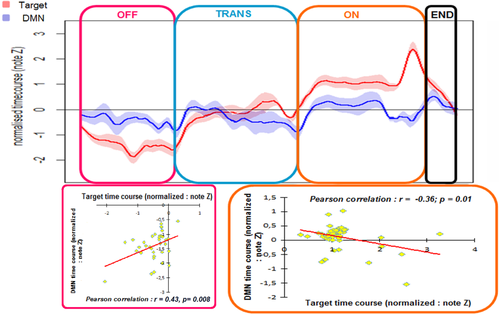
DMN and selected IC time courses across the hallucinatory experience. The upper plot represents the averaged (n = 25) normalized BOLD signal fluctuations in the DMN (blue) and the selected IC (red) during the different stages of the hallucinatory experience. Different period-specific patterns were observed. The time courses of the selected IC and the DMN are positively correlated during the “OFF” periods. Conversely, during the “ON” periods, there is significant anti-correlation between these two time courses, confirming the disengagement of the DMN during the occurrence of a hallucination. “OFF” = periods without hallucination (pink); “ON” = periods with hallucination (orange); “TRANS” = transition periods between “OFF” and “ON” (blue); “END” = end of the hallucinatory experience (black). [Color figure can be viewed in the online issue, which is available at wileyonlinelibrary.com.]
RFX Whole-Group Analysis
As shown in Figure 3 and Table 2, the whole-group RFX-GLM analyses identified several areas that were activated during the “ON” periods (t24 = 4.85, qFDR < 0.02). A majority of these areas are known to be involved in auditory hallucinations [Diederen et al., 2010; Jardri et al., 2011], while additional areas such as the cingulate cortex, the parietal cortex and the dorsolateral prefrontal cortex (DLPFC) were also observed to be active during this period. As shown in Figure 3, the areas that were involved in the “ON” periods exhibited a gradient of BOLD signal variation across all of the periods. Namely, we observed an increase in the fMRI signal from the “OFF” to the “ON” periods and a decrease during the “END” periods.
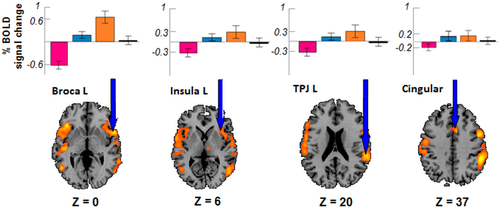
Whole-brain activations associated with “ON” hallucinatory periods (ON). BOLD activation for the 25 patients during the periods with hallucination (RFX, t24 = 4.85, qFDR < 0.02). Beta weights across the different stages of the hallucinatory experience are plotted for each significant area (mean +/- SD). Note that the temporal evolution of the beta weights follows the same pattern in all of the areas: decreased during “OFF”, continually increasing from “OFF” to “ON” during “TRANS” and decreased in “END” (only 4 examples are displayed; however, the same pattern was observed in all of the areas that were found to be activated during the “ON” periods). Pink= “OFF” periods; Orange = “ON” periods; Blue = “TRANS” periods; Black = “END” periods; L = left. [Color figure can be viewed in the online issue, which is available at wileyonlinelibrary.com.]
| Cerebral area | Mean X | Mean Y | Mean Z | mm3 |
|---|---|---|---|---|
| Insula R | 38 | 17 | 3 | 2 083 |
| DLFC R | 57 | 4 | 26 | 1 162 |
| Parietal R | 63 | −16 | 24 | 200 |
| Pre-central R | 52 | −4 | 15 | 1 629 |
| Broca R | 51 | 18 | −2 | 1 281 |
| Supramarginal R | 60 | −12 | 14 | 2 400 |
| Temporal R | 47 | −35 | 1 | 2 045 |
| PMd R | 8 | −5 | 69 | 854 |
| PMd L | −9 | −20 | 71 | 783 |
| DLPFC_L | −50 | 6 | 34 | 3 738 |
| TPJ L | −54 | −37 | 31 | 9 166 |
| Temporal L | −51 | −59 | 9 | 2 150 |
| Cingular L | −4 | 12 | 37 | 226 |
| Insula L | −38 | 16 | 4 | 1 255 |
| Broca L | −51 | 9 | 1 | 912 |
| Supramarginal L | −58 | −10 | 9 | 599 |
- t24 = 4.85, qFDR < 0.02; R = right; L = left; mm3 = activated volume (equivalent to the number of activated voxels since voxels were isotropic (1 mm³) PMd = dorsal premotor cortex; DLPFC = dorsolateral prefrontal cortex; TPJ = temporo-parietal junction.
Dynamic Causal Modeling
Endogenous connections
In all the retained models, endogenous bidirectional connections between all the areas were defined a priori. A one-sample Student t-test was conducted on the coupling parameters of these connections (averaged across the wining models of the different hallucinatory stages) and confirmed that these connections were all significantly greater than 0. More precisely the connections between the SAL, the DMN and the CEN were stronger than the connections involving the hippocampus. Among the connections that involved the hippocampus, the strongest connection was from the hippocampus to the DMN (Fig. 4, Supporting Information Table I).

Endogenous connections within the quadripartite model during hallucinations. All of the endogenous connections of the quadripartite model were significantly different from 0. The connections between the three ICNs were more significant than those involving the hippocampus. The connections between the DMN and the hippocampus were stronger than the connections between the hippocampus and the CEN or SAL. CEN = central executive network; SAL = salience network; DMN = default mode network; HIPPO = left hippocampus. [Color figure can be viewed in the online issue, which is available at wileyonlinelibrary.com.]
Bayesian model selection
For each period of hallucination (“OFF”, “TRANS”, “ON”, and “END”), FFX BMS was used to determine the model that exhibited the best fit for the observed data (Figs. 5-8). For all the periods, models 1 to 4 (nonlinear modulations from the SAL to the connections between the DMN and the CEN) exhibited the greatest relative log-evidence (Log-E > 3,000). The only change between the periods was the impact of the driving input (i.e., the impact of the period on connections between brain regions).
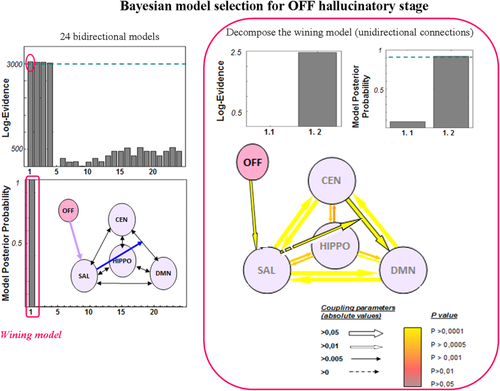
Results of Bayesian model selection for the “OFF” hallucinatory stage. The BMS across the 24 bidirectional models demonstrated that model 1 was the most accurate for this stage (right part of the figure). In a second analysis step, model 1 was decomposed into models 1.1 and 1.2 to test for unidirectional connections (from SAL to CEN-DMN or from SAL to DMN-CEN). This second analysis showed that model 1.2 was the most accurate (SAL to CEN-DMN). CEN = central executive network; SAL = salience network; DMN = default mode network; HIPPO = left hippocampus; “OFF” = periods without hallucination. [Color figure can be viewed in the online issue, which is available at wileyonlinelibrary.com.]
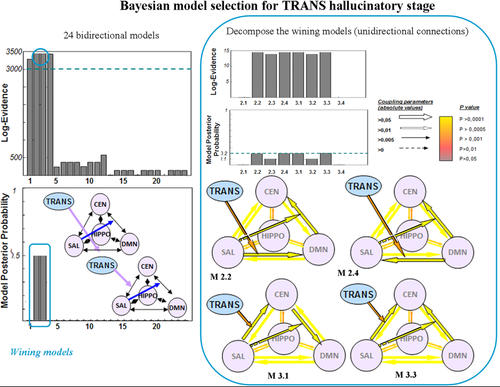
Results of Bayesian model selection for the “TRANS” hallucinatory stage. The BMS across the 24 bidirectional models demonstrated that models 2 and 3 were the most accurate for this stage (right part of the figure). In a second analysis step, these models were decomposed to test for unidirectional connections. This second analysis showed that models 2.2, 2.4, 3.1 and 3.3 were more accurate. CEN = central executive network; SAL = salience network; DMN = default mode network; HIPPO = left hippocampus; “TRANS” = transition periods between “OFF” and “ON”. [Color figure can be viewed in the online issue, which is available at wileyonlinelibrary.com.]

Results of Bayesian model selection for the “ON” hallucinatory stage.
The BMS across the 24 bidirectional models demonstrated that model 4 was the most accurate for this stage (right part of the figure). In a second analysis step, model 4 was decomposed into models 4.1, 4.2, 4.3 and 4.4 to test for unidirectional connections (the “ON” input to HIPPO-SAL or to the SAL-HIPPO and from SAL to CEN-DMN or from SAL to DMN-CEN). This second analysis showed that models 4.1 and 4.3 were more accurate (the “ON” input to HIPPO-SAL and from SAL to CEN-DMN or from SAL to DMN-CEN). CEN = central executive network; SAL = salience network; DMN = default mode network; HIPPO = left hippocampus; “ON” = periods with hallucination. [Color figure can be viewed in the online issue, which is available at wileyonlinelibrary.com.]
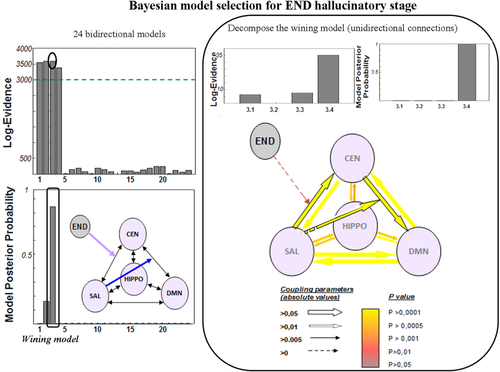
Results of Bayesian model selection for the “END” hallucinatory stage. The BMS across the 24 bidirectional models demonstrated that model 3 was the most accurate for this stage (right part of the figure). In a second analysis step, model 3 was decomposed into models 3.1, 3.2, 3.3 and 3.4 to test for unidirectional connections (the “END” input to SAL-CEN or to CEN-SAL and from SAL to CEN-DMN or from SAL to DMN-CEN). This second analysis showed that model 3.4 was the most accurate (“END” input to SAL-CEN and SAL to CEN-DMN). CEN = central executive network; SAL = salience network; DMN = default mode network; HIPPO = left hippocampus; “END” = end of the hallucinatory experience. [Color figure can be viewed in the online issue, which is available at wileyonlinelibrary.com.]
For the “OFF” condition, the first model was the most accurate [Log-E = 3,054, posterior probability (PP) = 1]. This model included the effect of period on the SAL and nonlinear SAL-mediated modulation of the connections between the DMN and the CEN. For the “TRANS” condition, models 2 and 3 were the most accurate (Log-E = 3,461, PP = 0.5 each). These models included the effect of period on the connections between the DMN and the SAL or the CEN and the SAL as well as nonlinear SAL-mediated modulation of the connections between the DMN and the CEN. For the “ON” condition, the fourth model was the most accurate (Log-E = 3,299, PP = 1). This model included the effect of period on the connections between the SAL and the hippocampus as well as nonlinear SAL-mediated modulation of the connections between the DMN and the CEN. For the “END” condition, the third model was the most accurate (Log-E = 3,596, PP = 0.94). This model included the effect of period on the connections between the CEN and the SAL as well as nonlinear SAL-mediated modulation of the connections between the DMN and the CEN.
For each condition, the BMS analysis was then performed again on the decomposed models (Figs. 5-8). The strengths of these connections, which were all significantly greater than zero, are summarized in Supporting Information Table I.
For the “OFF” condition, the BMS analysis demonstrated that nonlinear modulation by the SAL only affected the connections from the CEN to the DMN (Log-E = 2.46, PP = 0.92). For the “TRANS” condition, the BMS analysis demonstrated that four models fit the data equally well, suggesting that this period may reflect global network disorganization that progressively leads to hallucinations (Log-E = 14.5, PP = 0.199 each). For the “ON” condition, the BMS analysis demonstrated that the impact of period only affected the connections from the hippocampus to the SAL, whereas the nonlinear SAL-mediated modulation affected bidirectional connections between the DMN and the CEN (Log-E = 151, PP = 0.5 each). For the “END” condition, the BMS analysis demonstrated that period only affected the connections from the SAL to the CEN and that the nonlinear SAL-mediated modulation affected the connections from the CEN to the DMN (Log-E = 35.2, PP = 1).
DISCUSSION
This study was designed to explore network dynamics during various stages of the emergence of hallucinations independently of the sensory modality involved. Using stochastic DCM, we were able to provide evidence that the stage of the hallucinatory experience was associated with changes in the effective connectivity of a quadripartite model including the DMN, the CEN, the SAL and the left hippocampus. More surprisingly and contrary to the distinction proposed in our initial sub-hypotheses, a combination of the insular and hippocampal hypotheses appeared to explain the occurrence of a hallucination. More precisely, in line with the insular hypothesis, we demonstrated permanent control of the SAL over the connections between the DMN and the CEN, regardless of the stage of the hallucination. Nevertheless, in accordance with the hippocampal hypothesis, the “ON” stage appeared to be initiated by modulation of the connections from the left hippocampus to the SAL.
Cortical Activations During the Occurrence of Multisensory Hallucinations in Schizophrenia
This study demonstrated the involvement of a large-scale brain network in the occurrence of hallucinations, similar to what was previously shown in auditory-verbal hallucinations [Jardri et al., 2013]. This study also extended this observation of involvement to extra-auditory experiences. Compared with pure auditory hallucinations, additional brain areas, such as the anterior cingulate cortex, seem to be specifically activated by more complex experiences. This first step confirmed that our fMRI method was suitable to capture and specifically isolate hallucinatory experiences.
Previous studies have already demonstrated that dysconnectivity of intrinsic networks is associated with the cognitive dysfunctions of mental disorders [Menon, 2011]. Notably, the triple-network model has been proposed to account for schizophrenia [Jardri et al., 2013] (i.e., it is a disease factor). However, some of the key structures that have been shown to be involved in hallucinations, such as the hippocampus, are missing from this model. This omission may dramatically affect the capacity of the triple-network model to represent all of the modulation that is involved in the emergence of hallucinations [Hoffman et al., 2011]. To overcome this issue, we evaluated effective connectivity between the components of a quadripartite model consisting of the DMN, the CEN, the SAL and the left hippocampus.
Effective Connectivity Modulation Within the Quadripartite Model During the Occurrence of Hallucinations
Previous studies have demonstrated the importance of ICNs in hallucinations [Hoffman and Hampson, 2011; Shinn et al., 2013; Sommer et al., 2012; Vercammen et al., 2010; Wolf et al., 2011b]. In the present study, we focused on state changes in these network dynamics related to the occurrence of hallucinations. In particular, we focused on the quadripartite model (DMN, CEN, SAL and the left hippocampus).
Our choice to include the hippocampal complex as a complementary ROI to the DMN requires further comment because some definitions of the DMN include the hippocampal complex and, more globally, MTL nodes. In the present study, the hippocampus was not part of the DMN-related IC. This could be a consequence of the reduced SNR of the 3D-PRESTO sequences chosen here for their higher temporal resolution compared to conventional EPI sequences. Because no correlation was observed between the time course of the left hippocampus and that of the DMN, the hippocampal complex was included as a separate ROI in the analysis.
The CEN and the DMN are usually described as anti-correlated ICNs. For example, if one network shows increased metabolic activity with attention-demanding cognitive tasks/states, the second network conversely exhibits higher metabolic activity at rest [Fox et al., 2005]. In healthy individuals, the switch between these two networks is supervised by the SAL [Goulden et al., 2014; Uddin, 2015]. Although impairments in triple-network connectivity in schizophrenia have already been demonstrated [Manoliu et al., 2014], the present study confirmed SAL control of the switch between the CEN and DMN. Indeed, the SAL controls the interaction between the CEN and DMN, resulting in the engagement/disengagement of one network at the expense of the other. This permanent arbiter role does not appear to be disturbed by hallucinations per se.
During the “OFF” periods, no external modulation was observed in this model. The SAL appeared to guarantee the balance of the DMN and CEN networks by integrating information to maintain the system in a rest state. As previously described [Uddin et al., 2009], in the absence of hallucinations, the SAL ensured greater involvement of the DMN.
The “TRANS” periods were transition periods between stages without (“OFF”) and with hallucinations (“ON”). The “TRANS” periods were associated with destabilization of the connections between the SAL, the CEN and the DMN. This imbalance made the system more vulnerable to inappropriate stimuli coming from the hippocampal complex (as observed during the “ON” periods).
In fact, the “ON” periods were associated with modulation of information that originated in the left hippocampal complex and was then transferred to the SAL. The involvement of the hippocampal complex during or just prior to the emergence of hallucinations has already been suggested by several other studies [Diederen et al., 2010; Jardri et al., 2011]. Notably, this observation agrees with a memory-based sensory experiences hypothesis of the emergence of hallucinations [Copolov et al., 2003], as the hippocampus is involved in memory retrieval [Weis et al., 2004a; Weis et al., 2004b] and self-referential processing [Gusnard, 2005; Zhu et al., 2012]. Furthermore, hallucinations are currently thought to be associated with emotional changes and, often, with an increased feeling of anxiety [Copolov et al., 2003; Freeman and Garety, 2003; Langer et al., 2015] that arises from aberrant top-down processing that drives a self-generated, emotionally salient, and memory-based sensory experience towards conscious access [Silbersweig and Stern, 1998]. Interestingly, the manner in which hallucinations are extinguished has been associated with modulation of the connections from the SAL to the CEN, suggesting that the SAL reinforces activation of the CEN to extinguish hallucinatory experiences. Because CEN activation is associated with highly attention-demanding tasks, these results (i.e., a takeover by the CEN) suggest that voluntary attentional control of perception may be involved in extinguishing hallucinatory experiences. This idea appears to agree with the positive outcomes of dedicated cognitive behavioral therapy programs that have been used to reduce the occurrence of hallucinations in patients with schizophrenia [David, 1999; Thomas et al., 2014]. Indeed, since 1981, several clinicians have suggested that increasing environmental complexity, despite stimulating patients with attention-demanding tasks [Gallagher et al., 1994; Margo et al., 1981], appear to reduce the incidence of hallucinations in patients with schizophrenia. Furthermore, by focusing on the characteristics of the hallucinations and encouraging the patients to accept that these events are self-generated, a patient can also attenuate these symptoms [Bentall et al., 1994; Haddock et al., 1993].
These overall results reinforce the idea that therapies that are based on improving coping strategies by helping patients take control of their symptoms and better manage stress could reduce hallucinations in patients with schizophrenia [Carr, 1988; Falloon and Talbot, 1981; Farhall and Gehrke, 1997; Jenner et al., 1998].
A summary of the modulations in effective connectivity observed within the quadripartite model during hallucinations is presented in Figure 9.
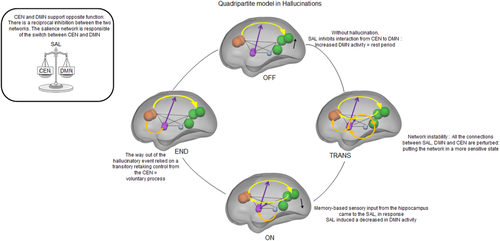
An overview of the quadripartite model for hallucinations. This diagram presents the modulation of effective connectivity within the quadripartite model that is associated with the different hallucinatory stages. Orange balls = central executive network (CEN); purple balls = salience network (SAL); green balls = default mode network (DMN); Blue ball = left hippocampus (HIPPO); dotted lines = endogenous connections; yellow arrows = connections impacted by the nonlinear modulation that arises from the SAL (purple arrows); orange arrows = connections impacted by the driving input (stage of hallucinatory experience). [Color figure can be viewed in the online issue, which is available at wileyonlinelibrary.com.]
Assets and Novelty
The current study was able to advance our understanding of the neural dynamics of hallucinations. First, our method allowed us to identify functional changes associated with the brief subjective events of hallucinations and to compare periods with and without hallucinations in the same patients. For the first time, it was possible to identify the occurrence and various stages of hallucinations. The recruitment of patients with complex hallucinations, including those that were not of the auditory modality, was also a strength of this report, as these experiences more accurately reflect the real life of patients with schizophrenia [Waters and Jardri, 2015].
Limitations
Three potential limitations of the present study need to be acknowledged. First, the sample of patients with schizophrenia enrolled in this experiment included primarily those with auditory hallucinations. Although considerable effort was made to recruit participants that exhibited a large range of hallucinatory experiences, the auditory modality remained dominant. We cannot exclude that this dominance of the auditory modality may have impacted the results by over-emphasizing the importance of mechanisms more related to hearing voices rather than to hallucinations in general. Nevertheless, this possibility seems unlikely because the networks considered for the effective connectivity analyses included amodal or multimodal areas (i.e., not attached to a particular sensory modality). Second, a relatively small number of volumes were dedicated to the capture of the hallucinations compared to the remainder of the acquisition. While this may have limited the power of the analysis, it reflects the clinical features of hallucinatory experiences, which are phasic and potentially short events, and the suggested methods were judged to be optimal for this type of analysis. Finally, one could argue that RFX BMS is more commonly employed than FFX BMS, but the use of FFX or RFX BMS is based on whether an optimal model structure is assumed to exist across subjects [Stephan et al., 2010]. This first assumption is considered valid for studies of a basic physiological mechanism that is unlikely to vary across participants, and FFX BMS was recently determined to be particularly well-suited for the exploration of RSN dynamics [Kahan et al., 2014]. The experimental setting we used to capture hallucinations during scanning (i.e., the patients were not required to perform a cognitive task—even signaling the presence/absence of hallucinations with a response button) provides a complementary argument that the experiences we captured should be considered outside of what is commonly referred to as higher-order functions.
CONCLUSION
By using a fine-grained detection method for hallucinations that occurred during scanning, the present report enabled dynamic exploration of the effective connectivity associated with the different stages of hallucinatory experiences. Notably, connectivity changes within a quadripartite model involving the CEN, the DMN, the SAL and the left hippocampus were found to be specifically associated with initiation, full perception and extinction. If the SAL ensures permanent control of the CEN/DMN switch, then hallucinations appear to also be associated with a memory-based sensory input from the left hippocampus to the SAL. Extinction of the hallucinatory percept seems to rely more heavily on a voluntary process that involves takeover of the quadripartite network by the CEN. This study not only expands knowledge of the processes that are involved in the emergence of a hallucination but may also have critical therapeutic implications, including reinforcing the utility of coping strategies based on specific executive training.


