Vascular endothelial growth factor increases the function of calcium-impermeable AMPA receptor GluA2 subunit in astrocytes via activation of protein kinase C signaling pathway
Funding information National Nature Science Foundation of China, Grant/Award Number: 81030020, 81571197 and 81771268
Abstract
Astrocytic calcium signaling plays pivotal roles in the maintenance of neural functions and neurovascular coupling in the brain. Vascular endothelial growth factor (VEGF), an original biological substance of vessels, regulates the movement of calcium and potassium ions across neuronal membrane. In this study, we investigated whether and how VEGF regulates glutamate-induced calcium influx in astrocytes. We used cultured astrocytes combined with living cell imaging to detect the calcium influx induced by glutamate. We found that VEGF quickly inhibited the glutamate/hypoxia-induced calcium influx, which was blocked by an AMPA receptor antagonist CNQX, but not D-AP5 or UBP310, NMDA and kainate receptor antagonist, respectively. VEGF increased phosphorylation of PKCα and AMPA receptor subunit GluA2 in astrocytes, and these effects were diminished by SU1498 or calphostin C, a PKC inhibitor. With the pHluorin assay, we observed that VEGF significantly increased membrane insertion and expression of GluA2, but not GluA1, in astrocytes. Moreover, siRNA-produced knockdown of GluA2 expression in astrocytes reversed the inhibitory effect of VEGF on glutamate-induced calcium influx. Together, our results suggest that VEGF reduces glutamate-induced calcium influx in astrocytes via enhancing PKCα-mediated GluA2 phosphorylation, which in turn promotes the membrane insertion and expression of GluA2 and causes AMPA receptors to switch from calcium-permeable to calcium-impermeable receptors, thereby inhibiting astrocytic calcium influx. The present study reveals that excitatory neurotransmitter glutamate-mediated astrocytic calcium influx can be regulated by vascular biological factor via activation of AMPA receptor GluA2 subunit and uncovers a novel coupling mechanism between astrocytes and endothelial cells within the neurovascular unit.
1 INTRODUCTION
Glial cells account for approximately 90% of all neural cells in the human brain and perform a vast range of vital functions (Allen & Barres, 2009). For example, radial glial cells and “stem” astrocytes control neurogenesis in the developing and adult brain under normal (Anthony, Klein, Fishell, & Heintz, 2004; Doetsch, Caille, Lim, Garcia-Verdugo, & Alvarez-Buylla, 1999; Gotz, Sirko, Beckers, & Irmler, 2015; Huang & Tan, 2015; Merkle, Tramontin, Garcia-Verdugo, & Alvarez-Buylla, 2004) and pathological conditions (Duan et al., 2015; Mo et al., 2018; Pan, Mao, & Sun, 2017; Saffary & Xie, 2011; Shen et al., 2016). Besides, astrocytes actively modulate synaptic transmission, especially glutamate and adenosine transmission within neurons and/or glial cells (Duan, Anderson, Stein, & Swanson, 1999; Panatier et al., 2011; Perea, Navarrete, & Araque, 2009; Tan et al., 2017). As we have known, glutamate, a major excitatory neurotransmitter, induces astrocytes excitability associated with the increase in the intracellular concentration of calcium ions ([Ca2+]i) partly through activation of ionotropic glutamate receptors (iGluRs). The iGluRs contain the N-methyl-d-aspartate (NMDA), the α-amino-3-(5-methyl-3-oxo-1, 2-oxazol-4-yl) propanoic acid (AMPA), and the kainate (KA) receptors (Zhu & Gouaux, 2017). The AMPA receptors consist of four subunits: GluA1–GluA4 (formerly named as GluR1–GluR4) (Traynelis et al., 2010). Among them, the GluA2 subunit is a critical regulator for calcium permeability in neurons (Bogaert et al., 2010; Gorter et al., 1997; Umeda et al., 2018) and glial cells (Beppu et al., 2013; Hoft, Griemsmann, Seifert, & Steinhauser, 2014). In general, the GluA2-lacking AMPA receptors endow neural cells with calcium flux into the intracellular cytoplasm; conversely, the GluA2-containing AMPA receptors inhibit calcium influx. Therefore, the GluA2-lacking AMPA receptors and GluA2-containing AMPA receptors are referred as the calcium-permeable AMPA receptors and calcium-impermeable AMPA receptors, respectively (Hollmann, Hartley, & Heinemann, 1991; Liu & Cull-Candy, 2005; Noh et al, 2005; Santos et al, 2006; Traynelis et al., 2010). The increase of [Ca2+]i in astrocytes may result from the calcium influx through GluA2-lacking AMPA receptors and/or the release of intracellular calcium storage through activation of the inositol 1,4,5-trisphosphate (IP3) signaling pathway (Hamilton et al., 2008; Zorec et al., 2012). GluA2-containing AMPA receptors inhibit calcium influx in neurons through PKC-mediated signaling pathway (Sun & Liu., 2007; Liu & Zukin, 2007). The calcium signaling within the brain plays important roles in crosslink between neuronal activities and astrocytic functions (Panatier et al., 2011; Zorec et al., 2012). Moreover, the movement of calcium ions in astrocytes contributes to the pathogenesis of acute brain injury. For example, ischemic cerebral stroke (Dong, He, & Chai, 2013; Rakers, Schmid, & Petzold, 2017), traumatic brain injury (Gao et al., 2013; Maneshi, Sachs, & Hua, 2015) or epilepsy (Ding et al., 2007; Fellin, Gomez-Gonzalo, Gobbo, Carmignoto, & Haydon, 2006; Tian et al., 2005) can cause significant increase of the [Ca2+]i in astrocytes. Such increase can be blocked by glutamate receptor antagonists (Ding et al., 2007) or antiepileptic drugs (Tian et al., 2005), which is accompanied with neuroprotection. It is plausible that disturbing astrocytic calcium homeostasis and gliotransmission result in dysfunction of the brain and/or cause specific disorders of the central nervous system (CNS). However, it is unclear how calcium homeostasis and transmission in astrocytes are regulated.
As we have well known, astrocytes can secrete several neurotrophic factors, such as brain-derived neurotrophic factor (BDNF) (Koppel et al., 2018), fibroblast growth factor (FGF) (Kajitani et al., 2015; Zhang et al., 2009), and vascular endothelial growth factor (VEGF) (Ijichi, Sakuma, & Tofilon, 1995). It has been reported that BDNF and FGF can modulate neurogenesis (Kang & Hebert, 2015), brain development (Marte, Messa, Benfenati, & Onofri, 2017; Shimada, Yoshida, & Yamagata, 2016). BDNF contributes to antidepressant effect (Li et al., 2018) and neural repair in disease brain (Xu, Lv, Dai, Lu, & Jin, 2018). Moreover, BDNF enhances glutamate release from presynaptic nerve terminals in normal condition but protects neurons against excitotoxicity via reduction of glutamate-mediated calcium overload in neurons under disease condition (Lau, Bengtson, Buchthal, & Bading, 2015). VEGF, especially VEGF-A, also possesses BDNF-like effects on neuronal function although it was originally as an endothelial growth factor with major function of angiogenesis and vascular endothelial permeability (Sun & Guo, 2005). VEGF regulates neural development, including enhancing neuronal cell proliferation (Jin et al., 2002; Wang, Guo, Qiu, Feng, & Sun, 2007; Wuestefeld, Chen, Meller, Brand-Saberi, & Theiss, 2012), differentiation (Avraham-Lubin, Goldenberg-Cohen, Sadikov, & Askenasy, 2012; Wu et al., 2017), transdifferentiation (Shen et al., 2016), migration (Meissirel et al., 2011), and plasticity (Wang et al., 2009; Yang et al., 2017). In addition, VEGF can regulate the activities of potassium channels (Qiu, Zhang, & Sun, 2003; Wu, Yang, Li, Liu, & Sun, 2015; Xu et al., 2003) and calcium channels (Ma et al., 2009) on neuronal membrane, thereby altering neuron excitability and protecting neurons against ischemic/hypoxic damage and excitotoxicity via activation of VEGF receptors (VEGFRs) (Bao, Lu, Wang, & Sun, 1999; Ruiz de Almodovar, Lambrechts, Mazzone, & Carmeliet, 2009; Sun & Guo, 2005). VEGFRs belong to tyrosine kinase receptor (Holmes, Roberts, Thomas, & Cross, 2007; Claesson-Welsh, 2016) and mainly include VEGFR-1(Flt1), VEGFR-2 (Flk1/KDR) and VEGFR-3(Flt4). VEGF-A (also known as VEGF) can bind to Flt1 and Flk1 receptors, VEGF-C and VEGF-D bind to Flt4 receptor and mainly participate in regulation of angiogenesis and lymphangiogenesis (Pan et al., 2017; Shibuya, 2013). VEGF modulates neuronal function mostly via activation of Flk1, but not Flt1 receptors in the brain (Carmeliet & Ruiz de Almodovar, 2013). Moreover, VEGF and its receptors are induced to highly express in astrocytes during the pathophysiological process of neurodegenerative diseases (Barbeito et al., 2010; Hsiao et al., 2015; Spampinato, Merlo, Sano, Kanda, & Sortino, 2017; Vijayalakshmi et al., 2015) and ischemic/hypoxic injury (Ijichi et al., 1995; Shin et al., 2008), in which activation of VEGFR2/Flk1 is protective (Freitas-Andrade, Carmeliet, Stanimirovic, & Moreno, 2008).
In the present study, we determined whether VEGF regulates glutamate-induced calcium influx in astrocytes and investigated the underlying molecular mechanisms. We used living cell imaging to detect the changes of [Ca2+]i levels and with pHluorin-tagged GluA1 (pH-GluA1)/pHluorin-tagged GluA2 (pH-GluA2) to track the plasma membrane insertion of GluA1/GluA2 in cultured astrocytes. We found that VEGF inhibited glutamate-induced calcium influx via increase of GluA2 phosphorylation and membrane insertion through activation of PKC in astrocytes. These results revealed that biological factor released from vascular endothelial cells also participated in the modulation of astrocytic calcium influx via activation of glutamate receptor subunit GluA2. Our results help us to understand functional and biochemical coupling mechanism within the neurovascular units in the mammalian brains.
2 MATERIALS AND METHODS
2.1 Reagents
VEGF165 (VEGF), SU1498, UBP310, rabbit monoclonal anti-GluA2, goat polyclonal anti-Flk1, and anti-mouse IgG-Cy5 were purchased from Abcam (Cambridge, UK). Rabbit polyclonal anti-phospho-PKCα (Thr638, p-PKCα), rabbit monoclonal anti-PKCα, and rabbit polyclonal anti-GluA1 were purchased from Abways Technology (Shanghai, China). Rabbit polyclonal anti-pan-cadherin and rabbit polyclonal anti-Flk1 were purchased from Cell Signaling Technology (Beverly, MA). Mouse monoclonal anti-phosphotyrosine (PY20), rabbit IgG, and mouse polyclonal anti-GFAP were purchased from Merck Millipore (Billerica, MA). Anti-rabbit IRDye 680 and anti-mouse IRDye 800CW were purchased from LI-COR bioscience (Lincoln, NC). Rabbit polyclonal anti-Flt1, rabbit polyclonal anti-Flk1, and horseradish peroxidase (HRP)-conjugated anti-rabbit/mouse IgG were purchased from Santa Cruz Biotechnology (Santa Cruz, CA). Glutamate, CNQX, and D-AP5 were purchased from Sigma-Aldrich (St. Louis, MO). Fluo-4AM, lipofectamine 2000, anti-goat IgG-Alexa Fluor 488, anti-rabbit IgG-Alexa Fluor 594, and rabbit monoclonal anti-phosphoserine (pSer) were purchased from Thermo Fisher Scientific (Waltham, MA). Calphostin C was purchased from Tocris Bioscience (Bristol, UK).
2.2 Culture of cortical astrocytes
Cultured astrocytes were prepared from cerebral cortices of newborn Sprague–Dawley rats (2 days old) (Department of Laboratory Animal Science, Fudan University) as reported previously (Gao et al., 2013; Shi et al., 2017) with a small adjustment. In brief, after removal of meninges and olfactory bulb neopallia were cut into small cubes (1 mm3). Then cubes were disrupted by moderate vortex and the resulting suspension was passed through a 70-μm sterile nylon filter. After centrifugation at 200g, the cell pellets were re-suspended in Dulbecco's modified Eagle medium (DMEM, Corning Inc., Corning, NY) with 10% (v/v) fetal bovine serum (Biological Industries, Cromwell, CT). Cells were plated in a culture dish or flask and then incubated at 37°C in a humidified incubator (Thermo Fisher Scientific, Waltham, MA) with 5% CO2 and 95% air. Culture medium was changed the next day and twice per week thereafter. Once confluent the cells were passaged and maintained in a 37°C incubator until used for the experiments.
2.3 Reagents treatment, protein preparation, Western blot and immunoprecipitation
2.3.1 Reagents treatment
Cells for protein acquisition were treated with interested reagents. In analyzing VEGF's effect on Flk1, Flt1, and GluA2 phosphorylation, we supplied VEGF (50 ng/mL) to the culture medium for 1, 10, 20 or 30 min. In analyzing the mechanism of VEGF effects, we pre-incubated the cultures with SU1498 (20 μM), calphostin C (1 μM), CNQX (20 μM), UBP310 (10 μM) or D-AP5 (100 μM) for 20 min before 20 min VEGF treatment based on specific requirement as indicated in each figure.
2.3.2 Protein preparation
Following treatment, cells were washed thoroughly in cold phosphate buffer (PBS, 0.1 M, pH 7.4) and quickly scraped off the plate by the cell scraper. Then cells were harvested by centrifugation at 200g for 5 min. For the extraction of total cellular proteins, cells were homogenized in cold lysis buffer (Beyotime Biotechnology, Nantong, China) with protease inhibitor cocktail for 30 min (Roche, Basel, Switzerland). The supernatant containing total cellular proteins was collected after centrifuged at 16,000g for 15 min. For the extraction of membrane proteins, Mem-PER™ Plus Membrane Protein Extraction Kit (Thermo Fisher Scientific, Waltham, MA) was used according to the manufacturer's instructions. Experiments were performed on ice and all centrifugations or mixings were performed at 4°C. The concentrations of total cellular proteins and membrane proteins were measured by the BCA protein assay kit (Beyotime Biotechnology, Nantong, China) according to the manufacturer's instructions.
2.3.3 Western blot
Equal amounts (20 μg) of proteins from each group were electrophoresed on 10% or 12% SDS-PAGE gels and then transferred to polyvinyl difluoride (PVDF) membranes (Bio-Rad, Berkeley, CA). After blocked by 10% milk in Tris-buffered saline (TBST, pH 7.4) containing 10 mM Tris, 150 mM NaCl, 0.1% Tween 20 at room temperature for 2 hr, the membranes were incubated with rabbit anti-GluA1 (1:500 dilution), rabbit anti-GluA2 (1:2,000 dilution) or rabbit anti-p-PKCα (1:500 dilution) at 4°C overnight. After washed in TBST, membranes were incubated with HRP-conjugated anti-rabbit IgG (1:3,000 dilution) for 1 hr at room temperature. Then peroxidase activity was visualized by Western blot luminescent reagent (Western lightning plus ECL, PerkinElmer, Akron, OH) and X-OMAT film. For normalization, membranes were stripped and washed overnight. Then membranes were reprobed with rabbit anti-pan-cadherin (1:2,000 dilution) or rabbit anti-PKCα (1:2,000 dilution). Optical densities of immune-stained bands were scanned with a scanner (Scan Maker i900, Microtek, Shanghai, China) and analyzed with an image processing and analysis system (Image J 1.48 software, NIH, Bethesda, MD).
2.3.4 Immunoprecipitation
For immunoprecipitation in total cellular proteins, 200 μg of proteins from each group were incubated with 0.5 μg following antibodies at 4°C overnight in lysis buffer (Beyotime Biotechnology, Nantong, China) with protease inhibitor cocktail: rabbit anti-Flk1, rabbit anti-Flt1, rabbit anti-GluA2, rabbit anti-PKCα, and rabbit IgG. Then incubated the protein–antibody complex substances with 40 μL protein A sepharose CL-4B beads (GE Healthcare, Abingdon, UK) at 4°C for 4 hr. Beads were then washed three times in cold lysis buffer with slight mixing and proteins were eluted by a final volume 40 μL 2 × SDS sample buffer (Beyotime Biotechnology, Nantong, China). After boiled for 5 min, samples were electrophoresed and transferred to the PVDF membranes as described in Western blot. After blocked by 5% BSA in TBST at room temperature for 2 hr, membranes were incubated with interested primary antibodies at 4°C overnight. For immunoprecipitation of anti-Flk1 or anti-Flt1, membranes were immunoblotted with anti-phosphotyrosine (1:1,000 dilution) and then reprobed with rabbit anti-Flk1 (1:1,000 dilution) or rabbit anti-Flt1 (1:200 dilution). For immunoprecipitation of anti-GluA2, the membrane was immunoblotted with rabbit anti-phosphoserine (1:1,000 dilution) or rabbit anti-Flk1 and reprobed with rabbit anti-GluA2 (1:2,000 dilution). For immunoprecipitation of anti-PKCα, the membrane was immunoblotted with rabbit anti-Flk1 or rabbit anti-GluA2 and then reprobed with rabbit anti-PKCα (1:1,000 dilution). Ten percent amount of proteins for immunoprecipitation from each group was electrophoresed and immunoblotted with antibodies against Flk1, Flt1, GluA1, GluA2, or PKCα to verify equal expression of target proteins between samples.
2.4 Immunocytochemistry
For triple labeling of GFAP–Flk1-GluA2, quiescent astrocytes cultured on coverslips were fixed with 4% paraformaldehyde dissolved in PBS after washed thoroughly in cold PBS. After washed in PBS for three times, cells were incubated in a blocking solution (0.3% Triton X-100 and 10% fetal calf serum dissolved in PBS) for 1 hr at 37°C. Then cells were stained with goat anti-Flk1 (1:200 dilution) at 4°C overnight and then anti-goat IgG-Alexa Fluor 488 (1:1,000 dilution) second antibody. Then the cells were stained with rabbit anti-GluA2 antibody (1:200 dilution) at 4°C overnight and then anti-rabbit IgG-Alexa Fluor 594 antibody (1:1,000 dilution). Next, the cells were stained with mouse anti-GFAP antibody (1:500) at 4°C overnight and then anti-mouse IgG-Cy5 (1:1,000 dilution) second antibody. Coverslips were mounted by mounting medium (Vector Laboratories, Burlingame, CA). Images were acquired on Leica confocal microscope (SP8, Leica, Wetzlar, Germany) equipped with 63 × 1.4 NA (numeral aperture) objective at excitation and emission wavelengths of 488 nm and 525 nm (Alexa Fluor 488), 590 nm and 617 nm (Alexa Fluor 594), 650 nm and 667 nm (Cy5).
2.5 Cell transfection and pHluorin assay
2.5.1 Cell transfection
For visualizing the membrane insertion of GluA1 and GluA2, astrocytes were transfected with plasmid-encoding N terminus of GluA1/GluA2 tagged with pH-sensitive fluorescent protein (“pHluorin”) (pRK5-pH-GluA1/A2, pH-GluA1/A2) (Araki, Lin, & Huganir, 2010).
For knockdown GluA2 expression, astrocytes were transfected with a specific pool of three different siRNA duplexes (5′-GCA UAU UUC UGU CCU CCU UTT-3′; 5′-GCA GGU GAC UGC UAU CAA UTT-3′; 5′-GCA CAC ACA GCG ACA AUU ATT-3′, Gene Pharma, Shanghai, China) against GluA2 or a non-specific siRNA (scramble, 5′-UUC UCC GAA CGU GUC ACG UTT-3′).
Plasmids and siRNA were respectively transfected using lipofectamine 2000 system. In brief, astrocytes were passed into the 3.5 cm glass-bottomed cell culture dishes or 96-well plates and cultured in the antibiotic-free culture medium. One day after incubation, the cultured astrocytes were transfected with plasmids (final concentration of 1 μg/mL) and siRNA (50 nM) using lipofectamine 2000 system (Invitrogen, Carlsbad, CA) according to the manufacturer's protocol. The astrocytes transfected with plasmids were used for pHluorin assay during 24–48 hr after transfection, and the astrocytes transfected with siRNA were used for analyzing the effects of VEGF on calcium influx with fluorescence microplate reader at 48 hr after transfection.
2.5.2 Living cell pHluorin assay
The pHluorin assay was processed as reported before with small adjustment (Araki et al., 2010). The growth media was substituted with imaging buffer (119 mM NaCl, 25 mM HEPES, 10 mM d-glucose, 2 mM NaHCO3, 2.5 mM KCl, 1 mM NaH2PO4, 2.5 mM CaCl2, 1.3 mM MgSO4, pH 7.4). To investigate whether VEGF modulates GluA1 or GluA2 insertion, VEGF (50 ng/mL) was supplied to the imaging buffer 20 min before data acquisition. In analyzing whether VEGF’ effect on GluA2 insertion was related to Flk1 activation, SU1498 (20 μM) was supplied to imaging buffer 20 min before VEGF application. The pHluorin was detected from a single confocal plane at excitation and emission wavelength of 488 nm and 525 nm by using a Leica SP8 confocal microscope. Images of 1,024 × 1,024 pixels were collected at a rate of 12 per min for 10 min. All imaging experiments were performed at 37°C by using a heating system.
2.5.3 Insertion analysis
Recordings were analyzed using Image J software. After import to Image J, the images were background corrected and noise filtered using the Gaussian blur (Sigma = 1). In order to show the insertion events, y-t rendering images were generated by rotating the original x-y-t image stack 90° along y-axis using maximum intensity projection algorithm (MIP) of Image J and the maximum intensity of each x line was projected onto a single pixel of the y-axis. This algorithm exhibited the original images in a single image and displayed the insertion event in a “line” like shape-the insertion events were appear as horizontal lines. The y-t rendering images were displayed the time on “x” axis (time passes from left to right of image) and the insertion events lasting over 10 s were registered as insertion events manually. Total events per 10 min were taken as the frequency of insertion.
2.6 Intracellular calcium measurement
The intracellular calcium level was quantified using either inverted microscopy (DMI4000, Leica, Wetzlar, Germany) or fluorescence microplate reader (Thermo Fisher Scientific, Waltham, MA) as previously described with small adjustment (Hemstapat, Smith, & Monteith, 2004; Ma et al., 2009). Briefly, cultured astrocytes were grown in 3.5 cm glass-bottom culture dish or 96-well plate were prepared for detection of calcium influx by inverted microscopy or fluorescence microplate reader, respectively. The cultured astrocytes were washed twice in HEPES-buffered saline (HBS, pH 7.2) containing 125 mM NaCl, 25 mM HEPES, 10 mM d-glucose, 5 mM KCl, 2 mM CaCl2, 1 mM MgCl2, and incubated in HBS containing 5 μM Fluo-4AM for 20 min at 37°C to ensure the entrance of Fluo-4AM. The astrocytes were then washed with HBS and incubated for an additional 20 min allow de-esterification of acetoxymethyl (AM) ester. Then, the calcium influx in astrocytes was stimulated by incubation of glutamate at a concentration of 100 μM in the HBS medium for 1 min. The fluorescent signals were detected before and after incubation of glutamate.
To observe the effect of VEGF on glutamate-induced calcium influx, the cultured astrocytes were incubated with VEGF at a concentration of 50 ng/mL in HBS medium for 20 min before stimulation with glutamate. To investigate the molecular mechanism of VEGF's effect on the glutamate-induced calcium influx, the astrocytes were pre-incubated with the HBS medium containing SU1498 (20 μM), calphostin C (1 μM), CNQX (20 μM), D-AP5 (100 μM) or UBP310 (10 μM) for 20 min before VEGF treatment. To confirm whether VEGF's effect is dependent extracellular calcium, the astrocytes were washed with calcium-free HBS (127 mM NaCl, 25 mM HEPES, 10 mM d-glucose, 5 mM KC, 1 mM MgCl2, 5 mM EGTA, pH 7.2) and incubated with VEGF (50 ng/mL) in calcium-free HBS for 20 min.
The fluorescent signals of Fluo-4 in astrocytes grown in 3.5 cm culture dish were detected under a fluorescent microscope equipped with 20× 0.4 NA objectives at an excitation of 480/40 nm, 505 nm long pass dichroic and emission of 527/30 nm. The images of 1,024 × 1,024 pixels were collected at a rate of twice per sec for 5 min.
The fluorescent signals of Fluo-4 in astrocytes grown in 96-well plate were recorded by microplate reader equipped with the 485/527 filter pair (excitation: 485/20 nm, emission 527/20 nm). Fluorescence intensity was recorded at 2 s intervals. Quantification of fluorescence intensity was conducted in the LAS AF Lite software (Leica, Wetzlar, Germany) or Ascent software for Fluoroskan Ascent.
The Fluo-4 fluorescence intensity positively reflected [Ca2+]i in astrocytes. The fluorescence baseline (F0) was defined as an average of 10 s fluorescence before stimulus onset. The real-time fluorescence was defined as F. Normalized changes of intercellular calcium concentration at different times were calculated as dF/F0 (%) = . The values were then exported into Sigma plot 12.3 (Systat Software, Chicago, IL) for constructing curves and the peak calcium response was obtained for comparison between groups.
2.7 In-cell Western analysis
In-cell Western was performed as previously described with a small modification (Pandey et al., 2015). After calcium measurement, the astrocytes transfected with GluA2 siRNA or scramble non-target siRNA were washed thoroughly in cold PBS, fixed with 4% paraformaldehyde in PBS for 20 min, blocked with PBS buffer containing 0.3% Triton X-100 and 10% fetal calf serum for 90 min at room temperature. Then, the astrocytes were incubated with rabbit anti-GluA2 (1:200 dilution) and mouse anti-β-actin (1:1,000 dilution) at 4°C overnight. The immunoreactive signals were revealed by 1 hr incubation with anti-rabbit IRDye 680 (1:1,000 dilution) and anti-mouse IRDye 800CW (1:1,000 dilution). The fluorescent signals of IRDye 680 and IRDye 800 were detected at 700 and 800 nm channels assisted with LI-COR, Odyssey machine (LI-COR Corporate, Lincoln, NE), and analyzed by Odyssey software (Version 3.0).
2.8 Oxygen–glucose deprivation treatment
Cultured astrocytes were loaded of Fluo-4AM and recorded intracellular fluorescent signals as described above before subjected to oxygen–glucose deprivation (OGD) treatment. After recording of basal fluorescence for 30 s in normal HBS, the cultures were perfused with glucose-free HBS buffer saturated of 95% N2/5% CO2 using a constant-flow pump (flow rate: 4 mL/min) at room temperature and the fluorescent signals in astrocytes were simultaneously recorded. To observe the effect of VEGF on OGD-induced calcium change, astrocytes were incubated with VEGF for 20 min before OGD treatment. To investigate the molecular mechanism of VEGF's effect, astrocytes were incubated with CNQX (20 μM), D-AP5 (100 μM) or UBP310 (10 μM) for 20 min before VEGF treatment.
2.9 Statistics
All of the statistical tests were performed using SPSS 9.0 (IBM, Chicago, IL), or Sigma plot. The significance of the differences among multiple groups were analyzed via one-way ANOVA followed by Fisher's least significant difference (LSD). Comparisons for two groups of data were done by Student's t test. Values were expressed as mean ± SEM. Results were considered statistically significant at a p-value of less than 0.05.
3 RESULTS
3.1 VEGF increases serine phosphorylation of AMPA receptor GluA2 subunit in astrocytes via activation of Flk1 receptor
To reveal whether VEGF regulates AMPA receptors phosphorylation in astrocytes, proteins were extracted from the cultured astrocytes at different time points following incubation with VEGF at a concentration of 50 ng/mL as indicated in Figure 1a–d. The proteins were incubated with antibodies against Flk1, Flt1, GluA1 or GluA2 to precipitate corresponding receptor proteins, and then immunoblotted with anti-phosphotyrosine (PY20) or phosphoserine (pSer) antibodies to detect Flk1/Flt1 phosphorylation at tyrosine residues (p-Flk1 and p-Flt1 in Figure 1a,b), and GluA1/GluA2 phosphorylation at serine residues (p-GluA1 and p-GluA2 in Figure 1c, d). We found that VEGF increased Flk1 phosphorylation to 4.52 ± 0.68 times at 1 min, further to 7.14 ± 1.43 times at 20 min, and still to 6.04 ± 1.44 times at 30 min after VEGF treatment, compared with vehicle-treatment (Figure 1a). However, VEGF did not change the levels of Flt1 phosphorylation during the entire time period of VEGF treatment (Figure 1b). Interestingly, we also found that VEGF treatment significantly increased the serine phosphorylation of AMPA receptor subunit GluA2, but not GluA1 in astrocytes, while it had no effect on total GluA1 and GluA2 protein levels (Figure 1c,d). VEGF treatment increased the serine phosphorylated GluA2 levels to 4.32 ± 0.71 times at 1 min, 3.23 ± 0.40 at 20 min and turned to baseline at 30 min, compared to vehicle treatment (Figure 1d). Moreover, VEGF (20 min, 50 ng/mL)-increased GluA2 serine phosphorylation was completely blocked by co-incubation with SU1498, an antagonist for VEGF Flk1 receptor, and the antagonist alone had no effect on the GluA2 serine phosphorylation (Figure 1e,f).

3.2 VEGF increases membrane insertion and expression of AMPA receptor GluA2 subunit in astrocytes
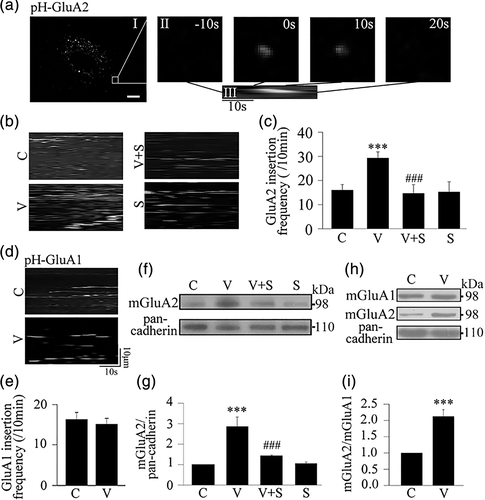
To explore the effect of VEGF on GluA1 and GluA2 membrane insertion in astrocytes, we used living cell imaging to detect fluorescent signals of pHluorin-tagged GluA1/GluA2, which shows fluorescence at the neutral extracellular surface and non-fluorescence in acidic intracellular vesicular compartments (Araki et al., 2010), and analyzed the membrane insertion events of GluA1/GluA2 based on appearance of fluorescent signals within 10 min recordings in each single astrocyte (Figure 2a). We found that VEGF treatment (20 min, 50 ng/mL) significantly increased the GluA2 insertion events in astrocytes (29.24 ± 2.60) compared with vehicle treatment (16.41 ± 3.27). The increase in the GluA2 insertion events induced by VEGF was completed abolished by co-incubation with SU1498 (Figure 2b,c). The same VEGF treatment had no effect on the GluA1 insertion events (Figure 2d,e). Next, we extracted the membrane fraction of the astrocytes to examine the effect of VEGF treatment (20 min, 50 ng/mL) on GluA2 membrane expression using Western blot analysis. We showed that the VEGF treatment significantly increased the membrane expression of GluA2 in astrocytes compared with vehicle treatment and that this VEGF effect was dramatically inhibited by co-incubation with SU1498, while the antagonist alone had no effect on GluA2 membrane expression (Figure 2f,g). Moreover, VEGF treatment increased the ratio of membrane GluA2/membrane GluA1 (mGluA2/mGluA1) to 2.12 ± 0.21 times compared with vehicle treatment (Figure 2h,i).
3.3 VEGF increases serine phosphorylation of AMPA receptor GluA2 subunit in astrocytes via activation of PKCα signaling pathway
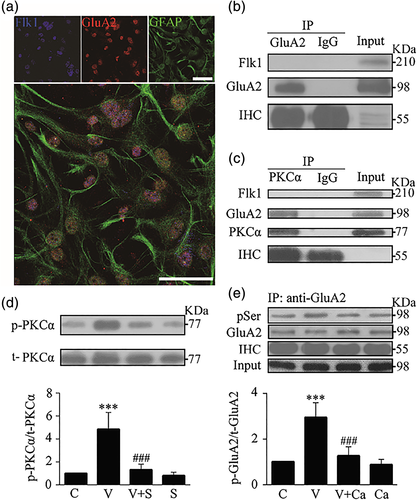
To further analyze the mechanism of VEGF-induced serine phosphorylation of GluA2, we carried out the following experiments. Firstly we conducted triple immunostaining with antibodies against Flk1, GluA2 and GFAP (a marker for astrocytes) in cultured astrocytes. We observed that GFAP positive astrocytes were co-labeled with GluA2 and Flk1 (Figure 3a), suggesting that both Flk1 and GluA2 receptors are expressed in astrocytes. Secondly, we conducted co-immunoprecipitation to examine if Flk1 and GluA2 receptors directly bind to each other. Whole cell extracts were immunoprecipitated with antibody against GluA2, and then immunoblotted with antibody against Flk1. Our results showed that the anti-GluA2 antibody did not pull down Flk1 (Figure 3b), suggesting that Flk1 and GluA2 did not bind to each other in astrocytes. Thirdly, we conducted co-immunoprecipitation to examine if PKCα and GluA2 directly bind to each other. The results showed that PKCα directly bound with GluA2, but not Flk1 (Figure 3c). Fourth, we conducted immunoblotting with antibodies against phospho-PKCα (Thr638, p-PKCα) and total PKCα (t-PKCα) in whole cell proteins to examine if the VEGF-increased GluA2 phosphorylation in astrocytes was mediated by activation of PKCα signaling. We found that VEGF treatment (20 min, 50 ng/mL) significantly increased the level of p-PKCα compared with vehicle treatment. Such increase in p-PKCα was markedly inhibited by the Flk1 antagonist SU1498, while the antagonist alone had no effect on PKCα phosphorylation (Figure 3d). Fifthly, we further showed that co-incubation with calphostin C, a PKC inhibitor, significantly abolished serine phosphorylation of GluA2 induced by VEGF, while the inhibitor alone had no effect on GluA2 phosphorylation (Figure 3e).
3.4 VEGF inhibits glutamate-induced calcium influx in astrocytes via activation of AMPA receptor GluA2 subunit and PKC signaling
To further analyze whether VEGF inhibits glutamate-induced calcium influx in astrocytes and its possible mechanism, we conducted living cell imaging to investigate the effect of VEGF under different conditions. We first observed that glutamate (100 μM) induced a rapid increase in Fluo-4 fluorescence in astrocytes of the control group (left column, Figure 4a). Using this model, we found that VEGF treatment significantly diminished the glutamate-induced calcium influx in astrocytes, and the effect of VEGF was completely blocked by SU1498, while the antagonist alone had no effect on the glutamate-induced calcium influx (Figure 4b,c). As a control, we observed that VEGF lost such inhibitory effect in calcium-free perfusion buffer (Figure 4d,e), indicating that VEGF inhibited the glutamate-induced increase of [Ca2+]i levels through reducing calcium influx from extracellular buffer rather than release from intracellular storage.
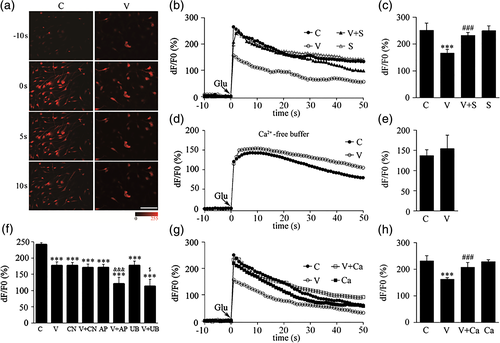
In order to analyze which glutamate receptors were involved in VEGF-inhibited calcium influx by glutamate, we further observed the effects of co-incubation of VEGF with CNQX, D-AP5 or UBP310 (antagonist for AMPA, NMDA or KA receptor, respectively). As we expected, CNQX, D-AP5 or UBP310 treatment alone could significantly reduce glutamate-induced calcium influx. Interestingly, VEGF co-incubation with D-AP5 or UBP310 showed additive inhibition. However, VEGF did not show further inhibition when it co-incubated with CNQX. These results indicated that CNQX, but D-AP5 or UBP310, can blockade VEGF-inhibited calcium influx (Figure 4f), indicating that inhibitory effect of VEGF on glutamate-induced calcium influx is dependent of activation of AMPA receptors.
Furthermore, we also found that the inhibition of calcium influx produced by VEGF was completely blocked by pretreatment with calphostin C while this PKC inhibitor alone had no effect on the glutamate-induced calcium influx (Figure 4g,h).
3.5 Knockdown of AMPA receptor GluA2 subunit reverses inhibitory effect of VEGF on glutamate-induced calcium influx in astrocytes
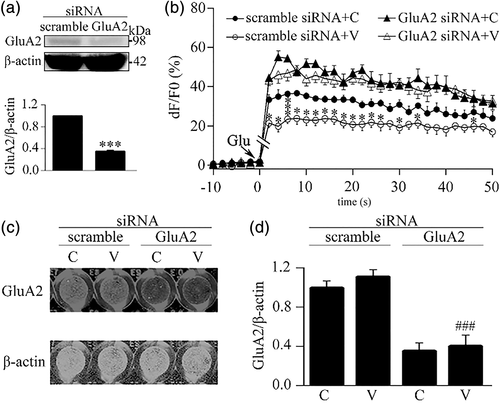
Next, we investigated the effect of knockdown of GluA2 subunit on the VEGF-inhibited calcium influx in astrocytes. The GluA2 subunit in astrocytes was knocked down by a specific siRNA pool. As shown in Figure 5a, at 48 hr after transfection with the siRNA pool, the level of GluA2 protein in astrocytes was reduced to 35.4% ± 1.7% compared to that in the scramble siRNA group, indicating that the siRNA pool is able to downregulate GluA2 expression in astrocytes. Then, using this knockdown approach, we found that the effect of VEGF-inhibited calcium influx was disappeared in astrocytes transfected with the GluA2 siRNA pool while it was still presented in astrocytes transfected with scramble non-target siRNA (Figure 5b). And, we even observed that the GluA2 siRNA treatment enhanced the glutamate-induced calcium influx in astrocytes no matter whether astrocytes were treated with VEGF (Figure 5b). Following the calcium imaging, we performed in-cell Western analysis with antibodies against GluA2 and β-actin to confirm siRNA-produced knockdown of GluA2 subunit in the imaging wells. The fluorescent images in Figure 5c representing the results of in-cell Western analysis in the wells with different treatments showed that the GluA2 siRNA pool, but not scramble non-target siRNA, effectively and statistically downregulated the GluA2 expression in the culture astrocytes (Figure 5d).
3.6 VEGF inhibits OGD-induced calcium influx in astrocytes via AMPA receptors
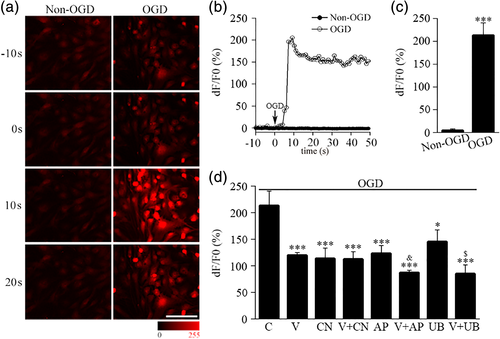
In order to explore the effect of VEGF on the changes in calcium influx during hypoxic/ischemic insults, we performed calcium-imaging analysis in astrocytes with OGD model, a popular ischemic/hypoxic in vitro model. We found that the Fluo-4 fluorescent signals in cultured astrocytes was increased after exposure to OGD (Figure 6a). The intracellular calcium signals in astrocytes were rapidly increased after OGD treatment and peaked within a few seconds and lasted at least 40 s (Figure 6b,c). We treated cells with VEGF before OGD treatment, and analyzed the effect of VEGF on the increase of calcium influx induced by OGD by measuring the calcium response peak (Figure 6d). The calcium response peak induced by OGD was significantly lower in VEGF group (V) than in vehicle group (C) (Figure 6d), suggesting VEGF could reduce OGD-induced calcium influx. We further observed interaction of CNQX, D-AP5 or UBP310 on this inhibition of VEGF. The results showed that CNQX (CN), D-AP5 (AP) and UBP310 (UB) all reduced the calcium response peak induced by OGD. More interestingly, VEGF further inhibited OGD-induced calcium influx in the presence of D-AP5 or UBP310, showing additive inhibition of VEGF and D-AP5 (V-AP) or UBP310 (V-UB). However, VEGF no longer showed further inhibition in the presence of CNQX, suggesting CNQX could block inhibition of VEGF (Figure 6d). These results suggest that VEGF reduce OGD-induced calcium influx via activation of AMPA receptors, but not NMDA or KA receptors, in astrocytes.
4 DISCUSSION
In the present study, we have demonstrated for the first time that VEGF inhibits glutamate/OGD-induced calcium influx in astrocytes via enhancing the function of AMPA receptors. Our results reveal that VEGF enhances AMPA receptor GluA2 subunit serine phosphorylation and membrane insertion through activation of PKCα signaling, thereby diminishing the glutamate-induced calcium influx in astrocytes. Present results indicated that excitatory neurotransmitter glutamate-mediated activation of astrocytes could be regulated by vascular biological active factor. Our results supported the ideas that VEGF is a vital coupling factor within neural vascular networks in the CNS (Ma et al., 2009; Shen et al., 2016; Wu, Lv, Lei, Qian, & Sun, 2019).
Our data from living cell imaging showed that VEGF-inhibited glutamate-induced calcium influx is completely blockaded by SU1498, an antagonist for Flk1 receptor, indicating that the inhibitory effect of VEGF on the glutamate-induced calcium influx is specifically via activation of Flk1 receptor (Figure 4b,c). Present results further support that VEGF can modulate the calcium homeostasis in neuronal cells (El Ghazi et al., 2012; Ma et al., 2009) besides endothelial cells. However, effects of VEGF on the calcium homeostasis in different types of cells are not identical (Faehling et al., 2002; Kim et al., 2008; Meissirel et al., 2011). The current study provides an evidence to support that VEGF is highly critical of the regulation of glutamate-mediated calcium signaling or calcium homeostasis in astrocytes.
It has been demonstrated that glutamate increases calcium influx via activation of iGluRs, including AMPA receptors, NMDA receptors, and KA receptors in neurons (Cornell-Bell, Finkbeiner, Cooper, & Smith, 1990; Hamilton et al., 2008). In this study, we revealed that VEGF inhibits glutamate-induced calcium influx depending on the activation of AMPA receptors in astrocytes, because inhibitory effect of VEGF on glutamate-induced calcium influx is blocked by CNQX, an antagonist of AMPA receptor, but not D-AP5 or UBP310, antagonists of NMDA or KA receptor, respectively (Figure 4f). As we have known, AMPA receptors consist of four subunits: GluA1–GluA4. Among them, GluA1 subunit is in favor of calcium influx, and GluA2 subunit is against calcium influx (Pougnet et al., 2014). Therefore, GluA2-lacking AMPA receptors allow calcium influx from extracellular space, whereas GluA2-containing AMPA receptors prohibit calcium influx. Using siRNA-produced specific knockdown approach, we identified that AMPA receptor GluA2 subunit mediates the inhibitory effect of VEGF on astrocytic calcium influx because siRNA-produced specific knockdown of GluA2 prevents VEGF-inhibited astrocytic calcium influx (Figure 5b).
Serine phosphorylated GluA2 subunit preferentially retains on the surface membrane of neurons (Christian et al., 2012; States et al., 2008). The increase of GluA2 expression on neural cell membrane reduces calcium permeability (Beppu et al., 2013). In contrast, the decrease of membrane expression of GluA2 enhances calcium influx in neurons (Conrad et al., 2008). Our data showed that, in astrocytes, VEGF increases serine phosphorylation (Figure 1d–f), membrane insertion (Figure 2b, c), and membrane expression of GluA2 (Figure 2f,g), but not GluA1 (Figures 1c and 2d,e). By enhancing GluA2 phosphorylation and trafficking, VEGF increases the ratio of GluA2/GluA1 on cell membrane of astrocytes (Figure 2h, i), thereby inhibiting glutamate-induced calcium influx.
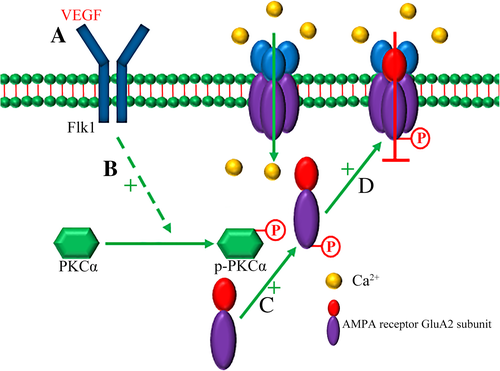
PKC modulates GluA2 phosphorylation (Ahn & Choe, 2010), membrane insertion (Christian et al., 2012; States et al., 2008), and switch of synaptic AMPA receptors from GluA2-lacking (calcium-permeable) to GluA2-containing (calcium-impermeable) receptors in neurons (Sun & Liu, 2007). PKC-mediated GluA2 phosphorylation can regulate its internalization in neurons of the CNS (Chung, Xia, Scannevin, Zhang, & Huganir, 2000; Park et al., 2009). In the present study, we showed that VEGF increases PKCα phosphorylation, which can be blocked by SU1498 (Figure 3d). And we also showed that co-incubation with calphostin C (an inhibitor of PKC) completely blocked VEGF-induced GluA2 phosphorylation (Figure 3e) and inhibition of calcium influx (Figure 4g, h). These results suggest that the effects of VEGF on serine phosphorylation of GluA2 and calcium influx depend on the activation of PKC in astrocytes. Based on the present findings, we propose a signaling pathway for VEGF-inhibited astrocytic calcium influx as summarized in Figure 7. VEGF inhibits glutamate-induced astrocytic calcium influx by activating its receptor Flk1 and then enhancing PKCα-mediated AMPA receptor GluA2 subunit phosphorylation at serine residues, which can promote membrane insertion and expression of GluA2. Through the increasing of GluA2 trafficking to the membrane, VEGF treatment will cause AMPA receptors to switch from calcium-permeable to calcium-impermeable, thereby inhibiting calcium influx in astrocytes (Figure 7).
We have known that ischemic insults both in vivo (Rakers & Petzold, 2017) and in vitro (Dong et al., 2013; Duffy & MacVicar, 1996; Fern, 1998) increase intracellular concentration of calcium in astrocytes. Present results revealed that OGD-induced increase of astrocytic calcium influx was dependent of activation of iGluRs since CNQX, D-AP5 and UBP310 respectively decreased the calcium influx (Figure 6a–d). Using this model, we further found that VEGF inhibited OGD-induced calcium influx via activation of AMPA receptor in astrocytes since only CNQX could block such inhibition of VEGF (Figure 6b–d).
VEGF possesses a diversity of functions in a different type of cells. For modulation of calcium dynamics, VEGF increases calcium influx in endothelial cells via activation of extracellular signal-regulated kinase (ERK) 1/2 through the phospholipase γ-PKCα-Raf pathway (Olsson, Dimberg, Kreuger, & Claesson-Welsh, 2006), whereas it reduces calcium currents and influx in neurons (Ma et al., 2009) via activation of nitric oxide (NO) production (El Ghazi et al., 2012). It has been demonstrated that VEGF-increased endothelial calcium influx induces angiogenesis, which is beneficial to the reconstruction of cerebral vessels and resupplying blood flows to ischemic brains. Meanwhile, VEGF reduces glutamate-induced calcium influx in neural cells, which might be helpful for protection against excitotoxicity in neurons (Bogaert et al., 2010; Gorter et al., 1997; Liu et al., 2004) and astrocytes. Collectively, such diversity effects of VEGF in the vessels and neural cells might be required for the maintenance of brain homeostasis or self-protection especially during ischemic brain injury (Lin et al., 2015; Ruan, Wang, ZhuGe, & Jin, 2015; Wittko-Schneider, Schneider, & Plate, 2013). In addition, recent studies support that VEGF is an important coupling factor within endothelial cells as well as astrocytes and neurons in the CNS (Pan, Mao, & Sun., 2017; Wu et al., 2015, 2017; Yang et al., 2017). Given that glutamate is a very important excitatory neurotransmitter and VEGF is a vascular biological factor, our results demonstrated that VEGF inhibits the glutamate-induced calcium influx in astrocytes via activation of the PKCα-mediated signaling pathway, which further suggests that astrocytes in the brain possess capabilities to receive information from neighboring cells, endothelial and neuronal cells, and then initiate intracellular signaling pathways to regulate calcium signaling within neurovascular units.
ACKNOWLEDGMENTS
This work was supported by grants from National Nature Science Foundation of China (81030020, 81571197 and 81771268).
CONFLICT OF INTEREST
The authors declare no conflicts of interest.


