Geochemistry and geochronology of intermediate volcanic rocks from the Compostela area, Nayarit, Mexico: Implications for petrogenesis and tectonic setting
Handling Editor: I. Somerville
Funding information: Consejo Nacional de Ciencia y Tecnología, Grant/Award Number: 270565; Newton Advanced Fellowship award - The Royal Society, Grant/Award Number: NA160116
Abstract
The Compostela area is located in the western Trans-Mexican Volcanic Belt, which consists of volcanic rocks that produced during the Pliocene to Recent volcanism. In this paper, we present petrography, whole-rock major- and trace-element concentrations, Ar–Ar ages, and Sr–Nd isotopic data of volcanic rocks from the Compostela area in the south of the city of Tepic, Nayarit, Mexico. These volcanic rocks are of intermediate composition and belong to the transitional series: basaltic trachyandesites [52.72–53.94 wt% SiO2; 0.69–2.53 wt% MgO] and subalkaline series: low-Si [55.11–60.94 wt% SiO2; 0.79–2.74 wt% MgO] and high-Si [61.60–62.71 wt% SiO2; 0.36–0.80 wt% MgO] andesites. The 40Ar/39Ar dating of two basaltic trachyandesites yields plateau ages of 1.05 ± 0.15 Ma and 1.07 ± 0.17 Ma and the andesites yielded a plateau age of 2.42 ± 0.36 Ma. These results indicate that the studied rocks were formed during the Pleistocene in two discrete episodes. The basaltic trachyandesites show enriched light rare earth elements patterns relative to high rare earth elements [(La/Yb)N = 5.81–8.07] with negligible Eu anomalies. The andesites display enriched large-ion lithophile elements (Ba, K) with anomalies of Nb (Th/Ce) and Ti in the three groups identified in the subalkaline series. The basaltic trachyandesites appear in a tight cluster of initial 87Sr/86Sr ratios (0.703519–0.703882) as compared to the basaltic andesite 87Sr/86Sr (0.704073) and positive ɛNd(t) values of +5.6 to +3.4, respectively, indicating that the basaltic trachyandesites were derived from intermediate magmas from a shallow mantle source. Geochemical modelling reveals that both basaltic trachyandesite and andesite rocks were derived by a process of crystal fractionation accompanied by assimilation of crustal rocks at the lower or middle level. Geochemical ratios and multidimensional discrimination diagrams, combined with the cross-section of the subduction zone indicates that basaltic trachyandesites were generated from a rift and/or Ocean Island Basalt-type source, whereas andesites were generated from a slab-derived source in a subduction environment.
1 INTRODUCTION
The Trans-Mexican Volcanic Belt (TMVB; also named as Mexican Volcanic Belt-MVB) is described as a Miocene to Recent E-W-oriented volcanic province that extends approximately 1,000 km long from Tepic to Veracruz (Figure 1), and about 200–500 km wide and contains ~8,000 volcanic structures (Andreani, Le Pichon, Rangin, & Martínez-Reyes, 2008; Verma, 2015). The TMVB has been divided by several authors (i.e., Ferrari, Orozco-Esquivel, Manea, & Manea, 2012; Verma, 2015; Verma, Pandarinath, & Rivera-Gómez, 2016) in three main sectors: western, central and eastern. The geodynamic evolution of the TMVB is very complex due to their significant differences in geochemical, isotopic, and geochronological composition of the volcanic rocks, as well as tectonic setting. Several kinds of models (subduction-related, plume-related, continental rifting, and strike-slip faulting) have been proposed by several researchers for the origin and evolution of the TMVB (Díaz-Bravo, Gómez-Tuena, Ortega-Obregón, & Pérez-Arvizu, 2014; Frey et al., 2014; Gómez-Tuena, Langmuir, Goldstein, Straub, & Ortega-Gutiérrez, 2007; Petrone, Orozco-Esquivel, & Ferrari, 2014; Verma & Nelson, 1989; Verma et al., 2016) and an extensional tectonic regime is developed in the triple rift system known as Tepic-Zacoalco Rift, Colima Rift and Chapala Rift (TZR-CR-ChR; Frey, Lange, Hall, Delgado-Granados, & Carmichael, 2007; Luhr, Nelson, Allan, & Carmichael, 1985).
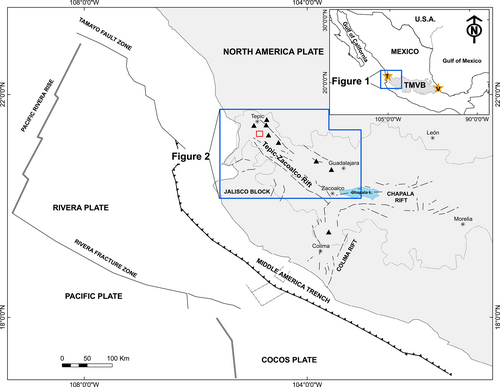
At the western sector of the Trans-Mexican Volcanic Belt (WTMVB), the Rivera Plate and northern part of the Cocos Plate are subducting (Figure 1; Yang et al., 2009) and the triple rift system TZR-CR-ChR on land is active (Figure 1; Selvans, Stock, DeMets, Sanchez, & Marquez-Azua, 2011), which have been causing that the Jalisco Block drift westward towards the Pacific Ocean (Figure 2; Frey et al., 2007; Pacheco et al., 1999).
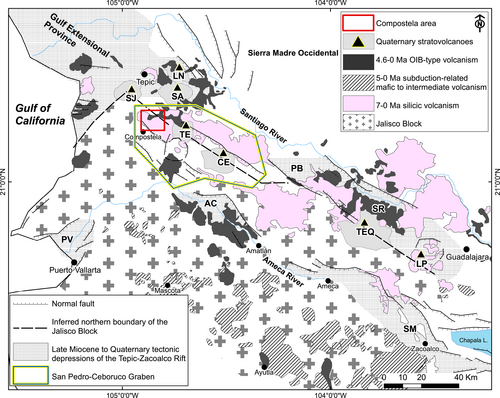
The WTMVB has been extensively studied (i.e., Crummy, Savov, Navarro-Ochoa, Morgan, & Wilson, 2014; Luhr, 2000; Luhr & Carmichael, 1980; Nelson, 1980; Verma et al., 2016), nevertheless, there is still remaining detailed geochemical studies in some areas from the WTMVB. This is the case of the Compostela area (study area ~123 km2) that is located south of the city of Tepic (Figure 1) and is mainly characterized by different volcanic lithologies. In addition, geologically, the study of the Compostela area is also important due to a complex tectonic setting between active subduction and continental extension, resulting in the emplacement of a wide variety of volcanic rock types (i.e., basalt, andesite, dacite, trachyte, and rhyolite). Therefore, in this study, we report new 40Ar/39Ar ages along with whole-rock geochemistry and Rb–Sr and Sm–Nd isotopes data from the intermediate volcanic rocks. Furthermore, this study contributes to a better understanding of the role of magma evolution and its relationships to tectonic features and volcanic activity in the WTMVB and TZR.
2 TECTONIC AND GEOLOGICAL FRAMEWORK
The western sector of the TMVB consists of a continental magmatic arc (Gómez-Tuena et al., 2007) related to the subduction of the young Rivera Plate (~10 Ma) that is dipping at ~50° (Pardo & Suárez, 1993) beneath the North American Plate. In this sector, the extensional tectonic regime of the TZR forms a ~50 km wide, NW-trending corridor, extending ~250 km from south of Guadalajara to the Pacific coast near the city of Tepic (Frey et al., 2007; Figure 2). The TZR is defined by extensional deformation that produced several discontinuous grabens of different ages; during Late Miocene (12–9 Ma), continuing through the Early Pliocene (5.5–3.5 Ma), and decreasing in the Quaternary (Ferrari & Rosas-Elguera, 2000). The San Pedro-Ceboruco (SPC) Graben is part of the TZR (Figure 2) where four volcanic systems are recognized: (a) the polygenetic stratovolcanoes Tepetiltic and Ceboruco; (b) the San Pedro-Cerro Grande Volcanic Complex (SCVC); (c) the Northern Volcanic Chain (NVC); and (d) the Southern Volcanic Chain (SVC; Ferrari et al., 2003; Petrone, 2010).
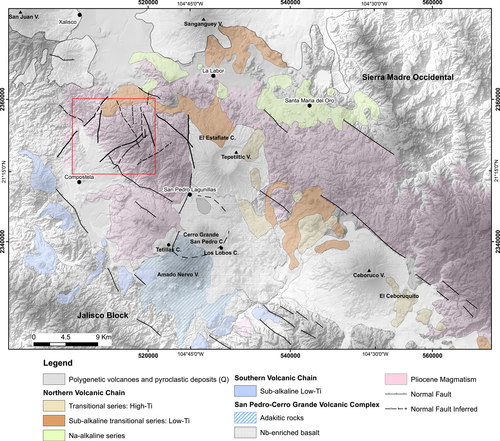
These volcanic systems can be correlated with the following units from the Compostela area (Figure 3). The effusive and explosive volcanic periods from Tepetiltic volcano and the caldera collapse in the SCVC; the volcanic activity of the Tepetiltic volcano around 0.5 Ma was followed by a Plinian event, in a narrow time interval ca. 560–450 Ka (Frey et al., 2014). The magmatic series identified in the NVC and SVC systems can be correlated to the basaltic andesite and andesite rocks in the Compostela area. The NVC system consists of a Na-alkaline series, transitional high-Ti series, and sub-alkaline transitional low-Ti series (Petrone, Francalanci, Carlson, Ferrari, & Conticelli, 2003) and is represented by the alignment of monogenetic volcanic centers, which are mainly scoria cones associate with lava flows, and secondarily by domes. Some of these volcanic centers are linked with the volcanic activity of the flanks Ceboruco and Tepetiltic volcanoes (Petrone, 2010). The age of the magmatic series in the NVC system is constrained by numerous ages from 0.51 Ma to present (Ferrari et al., 2003), with the most evident monogenetic magmatism being quite young 11–4 ka (Petrone, 2010). The SVC system consists of aligned sub-alkaline low-Ti series scoria cones, lava flows and domes (Petrone, 2010). This activity started at 2.52 Ma (Petrone, 2010) and possibly continued until 0.43 Ma (Ferrari et al., 2003). NNW–SSE trend following the north-east and south-east borders of the SPC Graben, respectively.
3 VOLCANIC LITHOLOGIES
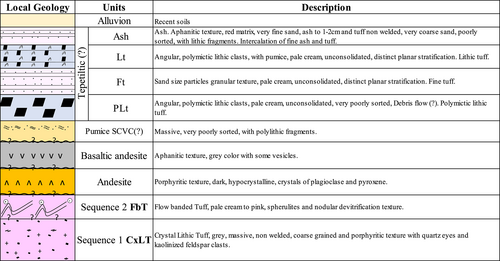
The local lithologies in the Compostela area include rhyolites, andesite and basaltic andesite, (Figures 4 and 5).

3.1 Rhyolite
Based on the field observations, rhyolite was divided into two sequences: crystal lithic tuff (CxLT) and flow banded tuff (FbT). The CxLT has a porphyritic texture with a grey and green color matrix with lithoclasts ~5 mm and phenocrysts of plagioclase, potassic feldspar and quartz within a very fine ash matrix. The FbT has foliated flow texture, some spherulites, and grey aphanitic matrix. In some outcrops, the flow-banded tuff has oxidized bands of ~1 mm to 5 cm.
3.2 Andesite
In the north-east and south-west part of the study area, the sequence of crystal lithic tuff of rhyolites is overlain by andesite lavas. In both the north-east and the south-west, the contact between the two units is poorly exposed. At the north-east and south-west, the andesite lavas are found in topographic lows and have an estimated thickness of ~140–60 m, respectively. The location of the volcanic feeders for both andesite lavas is not exposed. Both andesite lavas have a porphyritic texture with phenocrysts of plagioclase (3–5 mm), scarce pyroxene (1–2 mm), with some vesicles within an aphanitic matrix.
3.3 Basaltic andesite (later classified as basaltic trachyandesite)
In the center of the study area, basaltic andesite lava flows cut and cover extensive sequences of crystal lithic tuff. The basaltic andesite lava erupted via a feeder dyke which apparently follows a NW-SE oriented normal fault. In this area, the lava flow has a thickness at around ~7 m. The south-west basaltic andesites form a plateau and follow the topography of the sequences of crystal lithic tuff. About ~7 km to the north-west of this principal basaltic andesite lava flow, another lava flow is found with thickness of roughly ~10 m. For this basaltic andesite lava flow, the source in the field has not been identified. The basaltic andesites are aphanitic, dark green and in some parts, display vesicles.
4 MATERIALS AND METHODS
4.1 Sampling
Twenty-eight samples (Figure 4) including 16 basaltic andesites and 12 andesites from the Compostela area were collected. Two basaltic andesite and three andesite samples were selected for thin section examination. The powders of these samples were analyzed using X-ray diffraction (XRD) for mineral identification. Geochemical and whole-rock analysis were completed for all 28 samples by Inductively Coupled Plasma Mass Spectrometry (ICP-MS) for trace elements and press pellets for X-ray Fluorescence Spectrometer (XRF) for whole rock. Sr–Nd isotope analysis was completed on one andesite and three basaltic andesite samples. 40Ar-39Ar radiometric age dates were obtained for the same andesite used for Sr–Nd isotope analysis and two basaltic andesite samples. The selection of the samples for Sr–Nd isotope analysis 40Ar-39Ar geochronology was in the basis of their stratigraphic position. The samples COM-06C and COM-06E were collected from the feeder dike from the basaltic andesite flows and COM-06J as well as COM-06P were collected within the topographic lows where basaltic andesite was deposited. The basaltic andesite COM-07Fa was collected in the topographic low, which hosts this massive body.
4.2 Mineral analysis by XRD
XRD was used to identify mineral species for the selected samples for petrography including two basaltic andesites (COM-06C and COM-06J) and three andesites (COM-03E, COM-07C, and COM-07Fa). The powdered samples were analyzed by XRD at the Instituto Potosino de Investigación Científica y Tecnológica, IPICYT, San Luis Potosi, Mexico using a SmartLab Rigaku, equipped with a copper tube, a scintillation detector of Nal and silicon strip detector D/teX Ultra high velocity. The diffractometer was operated at 40 kV and 44 mA and the data were collected between 5 and 90 (2theta scale). The diffraction patterns were searched and/or matched with the PDXL-2 software.
4.3 Whole-rock major and trace element analysis
The pressed pellets were analyzed for major elements oxides by XRF using a Rigaku ZXS Primus II model (rhodium X-ray tube; 4 kW) in the Instituto Potosino de Investigación Científica y Tecnológica, IPICYT, San Luis Potosi, Mexico. The sample preparation, analytical procedure, accuracy, and precision followed the detailed methods of Verma et al. (2018), Verma et al. (2021), and Torres-Sánchez, Verma, Verma, Velasco-Tapia, and Torres-Hernández (2019). The precision and accuracy were considered <3% for major elements and CIPW norm calculations were obtained from the IgRocs (Verma & Rivera-Gómez, 2013). Trace and rare earth elements were analyzed by Thermo Scientific quadrupole ICP-MS in the University of Leicester, United Kingdom using three standards (BCR-1, AGV-1, and JG-3) for calibrate the analytical data quality.
4.4 Rb–Sr and Sm–Nd isotope systematics
Four samples (COM-06C, COM-06E, COM-06P, and COM-7Fa) were selected for the Rb–Sr and Sm–Nd isotopic analyses. These samples were the same samples selected for the 40Ar/39Ar dating. The isotopic analysis was performed at the Centro de Geocronología y Geoquímica Isotópica from the Universidad Complutense de Madrid, Spain. These analyses were performed in whole-rock powders using 87Rb-84Sr and 150Nd- 149Sm tracer by Isotope Dilution-Thermal Ionization Mass Spectrometry (ID-TIMS). Samples were weighted in Teflon vessels, with enriched spike solution (84Sr-87Rb and 149Sm-150Nd - Oak Ridge) and dissolved in 5 ml of ultrapure HF and 3 ml of ultrapure HNO3 (Merck-Suprapur). The PFA-vessels were placed into an oven for 65 hr at 120°C temperature. After that time, cold vials were evaporated on a heat plate at 120°C. Once samples were completely dried, 1 ml of HNO3 (Merck-Suprapur) were added and place back over the heat plate for evaporation at 120°C. Then, 4 ml of 6N distilled HCl 6N were added to the dried samples and placed in an oven overnight at 120°C. Samples were evaporated and remains were dissolved in 3 mL of distilled and titrated 2.5N HCl. After that, samples were centrifuged at 4,000 r.p.m. for 10 min, in order to separate the dissolved fraction from the residue if any.
Chromatographic separation of the Rb and Sr was performed using cation exchange resin DOWEX 50W-X12 200–400 mesh (previously calibrated). Resulting fractions were collected in clean vials and placed over a hot plate to dry out at about 80°C. On the other hand, chromatographic separation of the total group of REE was performed using cation exchange resin DOWEX 50W-X8 200–400 mesh (previously calibrated).
REE fractions recovered from the previous chromatographic stage were dried completely before dissolve again in 200 μl HCl 0.18N. These solutions were passed through a new chromatographic step (Ln-Resin). The result is a complete separation between the Nd (using 0.3N HCl as eluent) and the Sm (using 0.4N HCl as eluent) fractions of the samples, being ready for the subsequent analysis in the mass spectrometer (TIMS).
Dried Rb samples were dissolved with 1 μl of 1M phosphoric acid and loaded on a simple filament of Ta. The Rb analyses were performed in an IsotopX-Phoenix (TIMS) following a static multi-collection method for 100 cycles, with a stable intensity of 1 V in the mass 87Rb. Sr samples were dissolved in 1 μl of 1M phosphoric acid and loaded, together with 2 μl of Ta2O5, onto a single filament of Re. Sr analyses were performed on an IsotopX-Phoenix (TIMS) following a dynamic multi-collection method for 160 cycles, with a stable beam intensity of 3 V in the mass 88Sr. Possible 87Rb interferences were corrected in the Sr analysis and the 87Sr/86Sr ratio was normalized in order to correct for mass fractionation, taking into account a reference value of 86Sr/88Sr = 0.1194. NBS 987 (87Sr/86Sr = 0.710248 ± 0.000003. NBS 1982. National Bureau of Standards Certificate of Analysis. Standard Reference Material 987) data have been used to correct the samples ratios, attending to the standard drift, and considering the standard certified value. Analytical error (2STD) has been checked for the ratios provided 87Rb/86Sr = 1%, and 87Sr/86Sr = 0.01%. Sr procedural blanks were always below 0.5 ng.
4.5 40Ar/39Ar geochronology
The 40Ar/39Ar age was determined for three selected samples and dating were performed at The Open University, United Kingdom. The basaltic samples were crushed, washed, and groundmass basalt pieces (fragments) were separated. Groundmass fractions were leached in acetone and de-ionized water for one hour in an ultrasonic bath. Following the leaching, the samples were wrapped in AL-foil and dried on a hotplate prior to irradiation.
The samples were irradiated at the McMaster Nuclear Reactor of McMaster University, Canada for 101 hr in the cadmium-shielded position 8D. After irradiation, samples and standards were loaded in an ultra-high vacuum system and a 1,059 nm CSI fibre laser was focussed into the sample chamber and was used to step-heat basalt at The Open University, United Kingdom following analytical procedures of Torres-Sánchez, Verma, Barry, Verma, and Torres-Hernández (2020).
5 RESULTS
5.1 Petrography and mineralogy
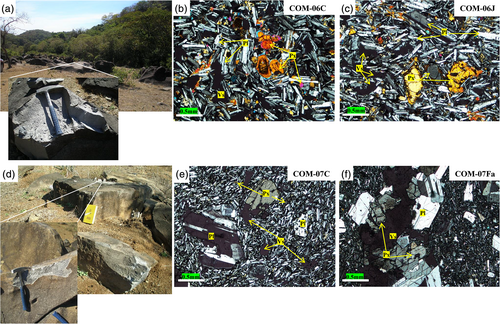
Two representative samples of basaltic trachyandesite (COM-06C and COM-06J) and three andesites (COM-03E, COM-07C, and COM-07Fa) were selected for petrography and mineral identifications by XRD (Table 1 and Figure 6a–f). The quantitative mineral identification and percentage were determined by the reference intensity ratio (RIR) method (Hubbard & Snyder, 1988). Pyroxene compositions were able to plot using the Morimoto's diagram (Morimoto, 1988).
| Sample | Long. (W) | Lat. (N) | Lava type | Descriptions | Mineral identified (mineral [%] based on RIR method %) |
|---|---|---|---|---|---|
| COM-06C | 104° 49′ 42.1″ | 21°7′ 32.8″ | Basaltic trachyandesite | 20% Ph (Pl + Px + Vs), 70% gms (Pl + Px) and 5% Opaque minerals | Plagioclase (84), Ferrosilite (16) |
| COM-06J | 104° 51′ 04.8″ | 21° 15′ 53.9″ | Basaltic trachyandesite |
25% Ph (Pl + Px + Vs), 70% gms (Pl + Px) and 5% Opaque minerals | Plagioclase (87), Ferrosilite (13) |
| COM-03E | 104° 48′ 52.5″ | 21° 20′ 19.2″ | Andesite | 15% Ph (Pl + Px), 82% gms (Pl + Px + glass), and less 3% Opaque minerals | Plagioclase (88), Ferrosilite (12) |
| COM-07C | 104° 54′ 32.6″ | 21° 15′ 33.2″ | Andesite | 15% Ph (Pl + Px + Vs), 82% gms (Pl + Px + glass) and 3% Opaque minerals | Plagioclase (87), Ferrosilite (13) |
| COM-07Fa | 104° 53′ 42.9″ | 21° 16′ 08.3″ | Basaltic andesite | 15% Ph (Pl + Px + Vs), 82% gms (Pl + Px + glass) and less 1% Opaque minerals | Plagioclase (82), Ferrosilite (18) |
- Abbreviations: Ph, phenocrysts are defined as >0.3 mm; gms, groundmass; Pl, plagioclase; Px, pyroxene; Vs, vesicles.
5.1.1 Basaltic trachyandesite
The basaltic trachyandesite samples show a porphyritic texture with 20% plagioclase and 5% clinopyroxene phenocrysts and vesicles within a groundmass (70%) of plagioclase, clinopyroxene and 5% of opaque minerals (Figure 6b,c). Plagioclase phenocrysts are very fine to fine (0.4–1 mm), euhedral to subhedral and display albite and Carlsbad twining. The clinopyroxene phenocrysts are fine-grained ~0.4–0.6 mm, anhedral with some of them displaying zonation along the rims with high birefringence. The groundmass is very fine 0.2 mm, with hyalopilitic texture, with plagioclase and subhedral pyroxene microlites, and sparse accessory opaque minerals. Quantitative mineral composition identified by XRD in both samples was plagioclase (87–84%) and ferrosilite (16–13%). It was not possible to identify the opaque minerals due to the fine fractions were not quantitative using this method (Table 1). In the Morimoto's diagram (Morimoto, 1988), most of the clinopyroxenes for 16 basaltic trachyandesite samples are identified as (clino) ferrosilite (Figure S1a).
5.1.2 Andesite
The andesite samples (Table 1; Figure 6e–f) have a porphyritic texture with 10% phenocrysts of plagioclase and 5% clinopyroxene and vesicles with 82% groundmass of plagioclase and clinopyroxene microlites, glass, and 3% opaque minerals. The plagioclase phenocrysts are very fine 0.4 mm, euhedral to subhedral, and display albite and Carlsbad twining. Some phenocrysts have disequilibrium sieve textures and zonation around the rim. Clinopyroxene phenocrysts are very fine 0.2–0.6 mm and display rounded shapes. The groundmass is hypocrystalline, consisting of plagioclase and clinopyroxene microlites with glass and opaque minerals. This groundmass texture is common in lava flows (Díaz-Bravo et al., 2014). XRD for three samples, the quantitative mineralogical assemblage (Table 1) is plagioclase (88–87%) and ferrosilite (13–12%), and orthopyroxene in sample (COM-07Fa) is identified as plagioclase (82%) and ferrosilite (18%), respectively. In the Morimoto's diagram (Morimoto, 1988), clinopyroxenes for eleven andesites samples are classified as (clino) ferrosilite, except one sample as enstatite (Figure S1b).
5.2 Whole-rock major oxides, trace and rare earth elements
A total of 28 volcanic rock samples were analyzed for major and trace element compositions, (summarized in Tables 2 and 3) All data were processed using IgRoCS software (Verma & Rivera-Gómez, 2013) for the magma classification and adjustment of Fe-oxidation on anhydrous basis. Thus, adjusted data have been used in this work.
| Sample rock (TAS)Long. (W) Lat. (N) | COM-06A basaltic trachyandesite 104° 49′ 19.4″ 21° 17′ 33.1″ | COM-06B basaltic trachyandesite 104° 49′ 19.0″ 21° 17′ 26.0″ | COM-06C basaltic trachyandesite 104° 49′ 42.1″ 21° 17′ 32.8″ | COM-06D basaltic trachyandesite 104° 49′ 49.9″ 21° 17′ 37.0″ | COM-06E basaltic trachyandesite 104° 50′ 25.9″ 21° 17′ 18.2″ | COM-06F basaltic trachyandesite 104° 50′ 47.5″ 21° 16′ 15.3″ | COM-06G basaltic trachyandesite 104° 50′ 46.9″ 21° 16′ 11.3″ |
|---|---|---|---|---|---|---|---|
| SiO2 | 51.523 | 52.756 | 53.199 | 53.003 | 52.920 | 53.344 | 53.008 |
| TiO2 | 1.555 | 1.319 | 1.346 | 1.384 | 1.502 | 0.892 | 1.327 |
| Al2O3 | 22.621 | 24.915 | 23.431 | 23.031 | 20.369 | 26.304 | 24.445 |
| Fe2O3t | 7.188 | 5.208 | 5.786 | 6.183 | 7.673 | 3.601 | 5.184 |
| MnO | 0.138 | 0.121 | 0.128 | 0.134 | 0.150 | 0.094 | 0.116 |
| MgO | 1.783 | 1.096 | 1.455 | 1.710 | 2.486 | 0.688 | 1.218 |
| CaO | 8.194 | 7.716 | 7.477 | 7.720 | 7.702 | 7.779 | 7.666 |
| Na2O | 2.575 | 2.865 | 3.130 | 3.207 | 3.604 | 2.899 | 3.018 |
| K2O | 2.272 | 2.470 | 2.373 | 2.301 | 1.834 | 2.884 | 2.686 |
| P2O5 | 0.432 | 0.594 | 0.561 | 0.480 | 0.581 | 0.792 | 0.571 |
| LOI | 0.970 | 0.319 | 0.468 | 0.273 | 0.608 | 0.145 | 0.190 |
| SiO2adj | 52.728 | 53.471 | 54.039 | 53.711 | 53.871 | 53.881 | 53.628 |
| TiO2adj | 1.592 | 1.337 | 1.367 | 1.403 | 1.529 | 0.901 | 1.343 |
| Al2O3adj | 23.150 | 25.253 | 23.801 | 23.339 | 20.735 | 26.569 | 24.731 |
| Fe2O3adj | 1.564 | 1.264 | 1.408 | 1.501 | 1.871 | 0.871 | 1.256 |
| FeOadj | 5.212 | 3.612 | 4.022 | 4.288 | 5.345 | 2.489 | 3.589 |
| MnOadj | 0.141 | 0.122 | 0.130 | 0.135 | 0.152 | 0.095 | 0.117 |
| MgOadj | 1.825 | 1.110 | 1.478 | 1.733 | 2.531 | 0.695 | 1.233 |
| CaOadj | 8.386 | 7.821 | 7.595 | 7.823 | 7.840 | 7.857 | 7.756 |
| Na2Oadj | 2.635 | 2.904 | 3.180 | 3.250 | 3.669 | 2.929 | 3.053 |
| K2Oadj | 2.325 | 2.504 | 2.411 | 2.332 | 1.867 | 2.913 | 2.717 |
| P2O5adj | 0.442 | 0.602 | 0.569 | 0.486 | 0.591 | 0.800 | 0.577 |
| Sumadj | 100 | 100 | 100 | 100 | 100 | 100 | 100 |
| Q | 6.366 | 8.639 | 7.529 | 5.826 | 3.831 | 8.927 | 7.025 |
| Or | 13.743 | 14.797 | 14.248 | 13.782 | 11.030 | 17.212 | 16.057 |
| Ab | 22.295 | 24.571 | 26.904 | 27.500 | 31.047 | 24.780 | 25.835 |
| An | 38.715 | 34.868 | 33.962 | 35.635 | 34.593 | 33.756 | 34.705 |
| C | 2.109 | 4.987 | 3.514 | 2.408 | 0.000 | 6.227 | 4.048 |
| HyM | 4.545 | 2.766 | 3.682 | 4.316 | 6.213 | 1.731 | 3.070 |
| HyF | 5.911 | 3.606 | 4.205 | 4.567 | 5.938 | 2.539 | 3.551 |
Hy Ol |
10.456 0 |
6.372 0 |
7.887 0 |
8.883 0 |
12.150 0 |
4.271 0 |
6.621 0 |
| Mt | 2.267 | 1.833 | 2.041 | 2.176 | 2.712 | 1.263 | 1.821 |
| Il | 3.023 | 2.539 | 2.597 | 2.664 | 2.904 | 1.711 | 2.550 |
| Ap | 1.024 | 1.395 | 1.319 | 1.126 | 1.370 | 1.853 | 1.337 |
| Mg# | 38.427 | 35.402 | 39.585 | 41.874 | 45.775 | 33.233 | 37.978 |
| FeOt/MgO | 3.628 | 4.277 | 3.578 | 3.254 | 2.777 | 4.709 | 3.828 |
| Sample rock (TAS) Long. (W) Lat. (N) | COM-06H basaltic trachyandesite 104° 50′ 52.0″ 21° 16′ 02.9″ | COM-06I basaltic trachyandesite 104° 50′ 58.3″ 21° 15′ 58.8″ | COM-06J basaltic trachyandesite 104° 51′ 04.8″ 21° 15′ 53.9″ | COM-06K basaltic trachyandesite 104° 51′ 12.7″ 21° 15′ 53.1″ | COM-06L basaltic trachyandesite 104 °51′ 40.9″ 21° 15′ 52.9″ | COM-06M basaltic trachyandesite 104° 51′ 48.2″ 21° 15′ 52.1″ | COM-06N basaltic trachyandesite 104° 51′ 53.6″ 21° 15′ 50.9″ |
|---|---|---|---|---|---|---|---|
| SiO2 | 53.396 | 52.839 | 52.723 | 53.112 | 53.323 | 52.817 | 53.593 |
| TiO2 | 1.030 | 1.053 | 1.233 | 1.228 | 1.062 | 1.231 | 1.067 |
| Al2O3 | 26.166 | 24.983 | 24.770 | 23.717 | 25.608 | 25.522 | 25.023 |
| Fe2O3t | 3.708 | 4.612 | 4.928 | 5.392 | 3.961 | 4.531 | 4.583 |
| MnO | 0.103 | 0.115 | 0.114 | 0.113 | 0.096 | 0.110 | 0.106 |
| MgO | 0.828 | 1.141 | 1.225 | 1.514 | 0.746 | 1.098 | 1.224 |
| CaO | 7.869 | 7.868 | 7.747 | 7.790 | 7.698 | 7.970 | 7.592 |
| Na2O | 3.069 | 3.269 | 3.293 | 3.606 | 2.881 | 3.171 | 3.353 |
| K2O | 2.698 | 2.554 | 2.433 | 2.373 | 2.776 | 2.505 | 2.530 |
| P2O5 | 0.721 | 0.738 | 0.684 | 0.692 | 0.778 | 0.684 | 0.726 |
| LOI | −0.059 | 0.235 | 0.254 | −0.029 | 0.376 | −0.098 | −0.215 |
| SiO2adj | 53.769 | 53.470 | 53.377 | 53.580 | 54.065 | 53.192 | 53.890 |
| TiO2adj | 1.037 | 1.065 | 1.248 | 1.239 | 1.077 | 1.239 | 1.073 |
| Al2O3adj | 26.349 | 25.281 | 25.077 | 23.926 | 25.965 | 25.703 | 25.162 |
| Fe2O3adj | 0.894 | 1.118 | 1.195 | 1.303 | 0.962 | 1.093 | 1.104 |
| FeOadj | 2.555 | 3.194 | 3.414 | 3.723 | 2.749 | 3.123 | 3.154 |
| MnOadj | 0.103 | 0.117 | 0.116 | 0.114 | 0.097 | 0.111 | 0.106 |
| MgOadj | 0.834 | 1.155 | 1.240 | 1.528 | 0.756 | 1.106 | 1.231 |
| CaOadj | 7.924 | 7.961 | 7.843 | 7.859 | 7.805 | 8.027 | 7.635 |
| Na2Oadj | 3.090 | 3.308 | 3.334 | 3.637 | 2.921 | 3.194 | 3.372 |
| K2Oadj | 2.717 | 2.584 | 2.463 | 2.394 | 2.814 | 2.523 | 2.544 |
| P2O5adj | 0.726 | 0.747 | 0.692 | 0.698 | 0.789 | 0.689 | 0.730 |
| Sumadj | 100 | 100 | 100 | 100 | 100 | 100 | 100 |
| Sample rock (TAS) Long. (W) Lat. (N) | COM-06P basaltic trachyandesite 104° 52′ 14.0″ 21° 16′ 43.4″ | COM-07E basaltic trachyandesite 104° 53′ 08.2″ 21° 16′ 29.5″ | COM-03A andesite 104° 49′ 01.3″ 21° 20′ 30.8″ | COM-03B andesite 104° 49 00.7″ 21° 20′ 30.5″ | COM-03C andesite 104° 49′ 03.5″ 21° 20′ 28.6″ | COM-03D andesite 104° 49′ 04.4″ 21° 20′ 27.5″ | COM-03E andesite 104° 48′ 52.5″ 21° 20′ 19.2″ |
|---|---|---|---|---|---|---|---|
| Q | 8.115 | 6.117 | 6.293 | 4.323 | 9.468 | 6.694 | 6.903 |
| Or | 16.055 | 15.273 | 14.554 | 14.148 | 16.632 | 14.911 | 15.033 |
| Ab | 26.148 | 27.990 | 28.212 | 30.777 | 24.718 | 27.022 | 28.532 |
| An | 34.568 | 34.616 | 34.386 | 34.431 | 33.568 | 35.319 | 33.105 |
| C | 5.656 | 4.355 | 4.324 | 2.732 | 5.810 | 4.774 | 4.728 |
| HyM | 2.077 | 2.876 | 3.089 | 3.805 | 1.883 | 2.754 | 3.065 |
| HyF | 2.431 | 3.397 | 3.435 | 3.925 | 2.653 | 2.990 | 3.303 |
Hy Ol |
4.509 0 |
6.273 0 |
6.524 0 |
7.730 0 |
4.537 0 |
5.743 0 |
6.368 0 |
| Mt | 1.297 | 1.620 | 1.732 | 1.889 | 1.395 | 1.584 | 1.600 |
| Il | 1.970 | 2.023 | 2.371 | 2.353 | 2.045 | 2.354 | 2.038 |
| Ap | 1.682 | 1.731 | 1.604 | 1.617 | 1.828 | 1.597 | 1.692 |
| Mg# | 36.784 | 39.194 | 39.305 | 42.248 | 32.905 | 38.694 | 41.023 |
| FeOt/MgO | 4.028 | 3.637 | 3.620 | 3.204 | 4.780 | 3.714 | 3.370 |
| Sample rock (TAS) Long. (W) Lat. (N) | COM-06O andesite 104° 53′ 42.5″ 21° 14′ 57.8″ | COM-07A andesite 104° 54′ 12.5″ 21° 16′ 12.8″ | COM-07B andesite 104° 54′ 04.9″ 21° 16′ 04.9″ | COM-07C andesite104° 54′ 32.6″ 21° 15′ 33.2″ | COM-07D andesite 104° 53′ 27.3″ 21° 16′ 18.0″ | COM-07Fb andesite104° 53′ 42.9″ 21° 16′ 08.3″ | COM-07Fa basaltic andesite 104° 53′ 42.9″ 21°16′ 08.3″ |
|---|---|---|---|---|---|---|---|
| SiO2 | 52.403 | 53.458 | 60.901 | 59.744 | 60.672 | 61.308 | 60.044 |
| TiO2 | 1.247 | 1.174 | 0.781 | 0.677 | 0.746 | 0.775 | 0.728 |
| Al2O3 | 26.617 | 24.012 | 20.441 | 22.883 | 21.391 | 20.472 | 21.757 |
| Fe2O3t | 4.053 | 5.176 | 4.447 | 3.176 | 3.990 | 4.039 | 3.363 |
| MnO | 0.119 | 0.112 | 0.089 | 0.042 | 0.080 | 0.060 | 0.078 |
| MgO | 0.735 | 1.415 | 0.784 | 0.347 | 0.692 | 0.702 | 0.597 |
| CaO | 8.118 | 7.865 | 4.163 | 2.803 | 4.254 | 4.430 | 4.870 |
| Na2O | 2.853 | 3.298 | 3.499 | 2.663 | 3.256 | 3.220 | 2.761 |
| K2O | 2.739 | 2.318 | 2.698 | 3.051 | 2.847 | 2.799 | 3.256 |
| P2O5 | 0.674 | 0.661 | 0.244 | 0.298 | 0.248 | 0.266 | 0.260 |
| LOI | −0.038 | 0.010 | 1.203 | 2.849 | 1.035 | 1.154 | 1.333 |
| SiO2adj | 52.799 | 53.948 | 62.330 | 62.597 | 61.990 | 62.711 | 61.608 |
| TiO2adj | 1.257 | 1.184 | 0.799 | 0.709 | 0.762 | 0.792 | 0.747 |
| Al2O3adj | 26.818 | 24.231 | 20.920 | 23.976 | 21.85 | 20.940 | 22.324 |
| Fe2O3adj | 0.978 | 1.251 | 1.090 | 0.797 | 0.977 | 0.990 | 0.827 |
| FeOadj | 2.795 | 3.574 | 3.114 | 2.277 | 2.790 | 2.827 | 2.361 |
| MnOadj | 0.120 | 0.113 | 0.091 | 0.044 | 0.082 | 0.061 | 0.080 |
| MgOadj | 0.741 | 1.428 | 0.802 | 0.363 | 0.707 | 0.719 | 0.613 |
| CaOadj | 8.179 | 7.937 | 4.260 | 2.936 | 4.347 | 4.531 | 4.997 |
| Na2Oadj | 2.875 | 3.328 | 3.581 | 2.790 | 3.327 | 3.293 | 2.833 |
| K2Oadj | 2.760 | 2.339 | 2.762 | 3.197 | 2.909 | 2.863 | 3.341 |
| P2O5adj | 0.679 | 0.667 | 0.250 | 0.312 | 0.254 | 0.272 | 0.267 |
| Sumadj | 100 | 100 | 100 | 100 | 100 | 100 | 100 |
| Q | 7.673 | 6.660 | 19.640 | 27.072 | 20.392 | 21.136 | 20.303 |
| Or | 16.310 | 13.822 | 16.320 | 18.891 | 17.189 | 16.919 | 19.745 |
| Ab | 24.327 | 28.162 | 30.303 | 23.610 | 28.151 | 27.868 | 23.973 |
| An | 36.144 | 35.019 | 19.502 | 12.528 | 19.908 | 20.703 | 23.048 |
| C | 5.854 | 3.390 | 4.892 | 11.335 | 5.938 | 4.836 | 5.600 |
| HyM | 1.845 | 3.557 | 1.998 | 0.905 | 1.762 | 1.790 | 1.527 |
| HyF | 2.471 | 3.783 | 3.667 | 2.435 | 3.209 | 3.178 | 2.568 |
Hy Ol |
4.315 0 |
7.339 0 |
5.665 0 |
3.340 0 |
4.971 0 |
4.968 0 |
4.094 0 |
| Mt | 1.418 | 1.814 | 1.580 | 1.156 | 1.416 | 1.435 | 1.198 |
| Il | 2.386 | 2.249 | 1.518 | 1.346 | 1.447 | 1.505 | 1.419 |
| Ap | 1.573 | 1.545 | 0.580 | 0.723 | 0.588 | 0.630 | 0.619 |
| Mg# | 32.088 | 41.595 | 31.464 | 22.149 | 31.128 | 31.180 | 31.632 |
| FeOt/MgO | 4.961 | 3.291 | 5.106 | 8.239 | 5.186 | 5.174 | 5.066 |
| SiO2 | 60.108 | 57.395 | 56.830 | 58.223 | 58.666 | 57.099 | 54.329 |
| TiO2 | 0.523 | 0.605 | 0.594 | 0.611 | 0.691 | 0.623 | 0.699 |
| Al2O3 | 22.642 | 24.286 | 24.938 | 22.997 | 21.281 | 23.129 | 23.415 |
| Fe2O3t | 3.651 | 3.570 | 3.484 | 3.945 | 4.631 | 4.404 | 5.262 |
| MnO | 0.081 | 0.084 | 0.083 | 0.093 | 0.099 | 0.094 | 0.107 |
| MgO | 0.921 | 0.895 | 0.773 | 1.126 | 1.406 | 1.493 | 2.711 |
| CaO | 5.463 | 5.968 | 5.630 | 6.335 | 6.345 | 6.759 | 8.292 |
| Na2O | 3.380 | 2.879 | 2.590 | 2.846 | 3.109 | 2.831 | 2.782 |
| K2O | 1.927 | 2.157 | 2.071 | 2.015 | 1.946 | 1.757 | 1.230 |
| P2O5 | 0.205 | 0.218 | 0.222 | 0.210 | 0.211 | 0.207 | 0.168 |
| LOI | 0.458 | 1.067 | 1.663 | 0.846 | 0.920 | 0.889 | 0.413 |
| SiO2adj | 60.948 | 58.695 | 58.618 | 59.351 | 59.844 | 58.229 | 55.111 |
| TiO2adj | 0.531 | 0.619 | 0.613 | 0.623 | 0.705 | 0.635 | 0.709 |
| Al2O3adj | 22.958 | 24.837 | 25.722 | 23.442 | 21.708 | 23.587 | 23.752 |
| Fe2O3adj | 0.887 | 0.874 | 0.861 | 0.963 | 1.131 | 1.076 | 1.135 |
| FeOadj | 2.533 | 2.498 | 2.459 | 2.752 | 3.232 | 3.073 | 3.782 |
| MnOadj | 0.082 | 0.086 | 0.086 | 0.095 | 0.101 | 0.096 | 0.109 |
| MgOadj | 0.934 | 0.916 | 0.797 | 1.148 | 1.435 | 1.522 | 2.750 |
| CaOadj | 5.539 | 6.103 | 5.807 | 6.458 | 6.473 | 6.893 | 8.411 |
| Na2Oadj | 3.427 | 2.944 | 2.671 | 2.901 | 3.172 | 2.887 | 2.822 |
| K2Oadj | 1.953 | 2.206 | 2.137 | 2.054 | 1.985 | 1.791 | 1.248 |
| P2O5adj | 0.208 | 0.223 | 0.229 | 0.214 | 0.215 | 0.211 | 0.170 |
| Sumadj | 100 | 100 | 100 | 100 | 100 | 100 | 100 |
| Q | 19.408 | 17.948 | 20.574 | 18.122 | 16.564 | 16.368 | 9.982 |
| Or | 11.544 | 13.035 | 12.627 | 12.136 | 11.730 | 10.587 | 7.375 |
| Ab | 28.997 | 24.909 | 22.603 | 24.546 | 26.839 | 24.425 | 23.880 |
| An | 26.122 | 28.824 | 27.314 | 30.640 | 30.705 | 32.821 | 40.616 |
| C | 5.633 | 7.043 | 9.005 | 5.218 | 3.088 | 4.870 | 2.873 |
| HyM | 2.327 | 2.281 | 1.986 | 2.589 | 3.573 | 3.792 | 6.850 |
| HyF | 3.194 | 3.003 | 2.950 | 3.405 | 4.023 | 3.883 | 5.037 |
Hy Ol |
5.522 0 |
5.283 0 |
4.936 0 |
6.264 0 |
7.596 0 |
7.675 0 |
11.887 0 |
| Mt | 1.285 | 1.268 | 1.248 | 1.396 | 1.640 | 1.559 | 1.645 |
| Il | 1.008 | 1.175 | 1.164 | 1.183 | 1.339 | 1.207 | 1.347 |
| Ap | 0.482 | 0.516 | 0.530 | 0.495 | 0.499 | 0.488 | 0.395 |
| Mg# | 39.670 | 39.518 | 36.631 | 42.646 | 44.171 | 46.894 | 56.452 |
| FeOt/MgO | 3.565 | 3.588 | 4.055 | 3.153 | 2.963 | 2.655 | 1.746 |
| Sample rock (TAS) Long. (W) Lat. (N) | COM-06A basaltic trachyandesite 104° 49′ 19.4″ 21° 17′ 33.1″ | COM-06B basaltic trachyandesite 104° 49′ 19.0″ 21° 17′ 26.0″ | COM-06C basaltic trachyandesite 104° 49′ 42.1″ 21° 17′ 32.8″ | COM-06D basaltic trachyandesite 104° 49′ 49.9″ 21° 17′ 37.0″ | COM-06E basaltic trachyandesite 104° 50′ 25.9″ 21° 17′ 18.2″ | COM-06F basaltic trachyandesite 104° 50′ 47.5″ 21° 16′ 15.3″ | COM-06G basaltic trachyandesite 104° 50′ 46.9″ 21° 16′ 11.3″ |
|---|---|---|---|---|---|---|---|
| La | 26.857 | 28.458 | 32.511 | 36.277 | 32.462 | 25.290 | 27.016 |
| Ce | 53.112 | 54.225 | 53.973 | 57.969 | 58.971 | 50.636 | 53.742 |
| Pr | 6.684 | 6.913 | 7.088 | 7.962 | 8.193 | 6.401 | 6.516 |
| Nd | 26.262 | 28.544 | 29.149 | 33.056 | 32.446 | 25.051 | 26.613 |
| Sm | 5.903 | 5.901 | 6.116 | 7.294 | 7.384 | 5.512 | 5.657 |
| Eu | 2.182 | 2.165 | 2.340 | 2.856 | 2.931 | 2.072 | 2.134 |
| Gd | 5.687 | 6.216 | 6.721 | 9.228 | 8.628 | 5.423 | 5.889 |
| Tb | 0.838 | 0.947 | 0.983 | 1.318 | 1.334 | 0.813 | 0.815 |
| Dy | 4.947 | 5.544 | 6.013 | 8.577 | 8.281 | 4.815 | 5.010 |
| Ho | 0.887 | 1.080 | 1.202 | 1.848 | 1.590 | 0.888 | 0.923 |
| Er | 2.628 | 3.045 | 3.509 | 5.380 | 4.780 | 2.671 | 2.649 |
| Tm | 0.380 | 0.480 | 0.524 | 0.740 | 0.690 | 0.364 | 0.374 |
| Yb | 2.273 | 2.625 | 3.026 | 4.240 | 3.788 | 2.302 | 2.296 |
| Lu | 0.384 | 0.443 | 0.504 | 0.743 | 0.625 | 0.367 | 0.381 |
| Ba | 566.560 | 637.687 | 625.569 | 583.206 | 614.969 | 530.512 | 593.868 |
| Cr | 59.380 | 69.851 | 72.279 | 86.837 | 67.727 | 56.913 | 67.136 |
| Cs | 0.191 | 0.241 | 0.226 | 0.247 | 0.131 | 0.108 | 0.224 |
| Hf | 5.475 | 5.646 | 5.679 | 5.729 | 5.830 | 5.366 | 5.648 |
| Nb | 25.114 | 26.978 | 26.207 | 26.412 | 27.662 | 24.403 | 27.579 |
| Pb | 5.082 | 5.175 | 4.970 | 4.845 | 5.044 | 5.035 | 5.215 |
| Rb | 18.537 | 21.622 | 20.245 | 21.857 | 13.720 | 19.136 | 22.096 |
| Sc | 20.973 | 21.107 | 22.112 | 20.799 | 20.497 | 19.606 | 19.374 |
| Sr | 820.411 | 729.462 | 715.449 | 683.466 | 687.090 | 767.988 | 711.423 |
| Ta | 1.509 | 1.636 | 1.628 | 1.624 | 1.748 | 1.520 | 1.697 |
| Th | 2.628 | 3.038 | 2.891 | 2.833 | 3.037 | 2.510 | 2.965 |
| U | 0.729 | 0.781 | 0.796 | 0.811 | 0.736 | 0.685 | 0.847 |
| V | 196.599 | 186.926 | 184.358 | 192.353 | 182.270 | 190.621 | 174.063 |
| Y | 24.288 | 30.214 | 41.717 | 62.366 | 46.755 | 23.835 | 25.536 |
| Zr | 210.760 | 221.343 | 222.925 | 216.907 | 220.290 | 201.815 | 217.419 |
| W | 0.429 | 0.258 | 0.322 | 0.519 | 0.741 | 0.463 | 0.356 |
| La/Nb | 1.069 | 1.054 | 1.240 | 1.373 | 1.173 | 1.036 | 0.979 |
| Sample no. Rock (TAS) Long. (W) Lat. (N) | COM-06H basaltic trachyandesite 104° 50′ 52.0″ 21° 16′ 02.9″ | COM-06I basaltic trachyandesite 104° 50′ 58.3″ 21° 15′ 58.8″ | COM-06J basaltic trachyandesite 104° 51′ 04.8″ 21° 15′ 53.9″ | COM-06K basaltic trachyandesite 104° 51′ 12.7″ 21° 15′ 53.1″ | COM-06L basaltic trachyandesite 104 °51′ 40.9″ 21° 15′ 52.9″ | COM-06M basaltic trachyandesite 104° 51′ 48.2″ 21° 15′ 52.1″ | COM-06N asaltic trachyandesite 104° 51′ 53.6″ 21° 15′ 50.9″ |
|---|---|---|---|---|---|---|---|
| La | 24.813 | 26.515 | 27.652 | 26.265 | 26.465 | 25.126 | 24.981 |
| Ce | 51.871 | 50.976 | 50.702 | 54.077 | 51.997 | 52.325 | 51.383 |
| Pr | 6.393 | 6.495 | 6.705 | 6.726 | 6.836 | 6.459 | 6.495 |
| Nd | 25.664 | 25.903 | 25.752 | 27.680 | 27.550 | 26.811 | 26.396 |
| Sm | 5.471 | 5.702 | 5.740 | 5.690 | 5.824 | 5.725 | 5.495 |
| Eu | 2.057 | 2.110 | 2.103 | 2.179 | 2.071 | 2.060 | 2.135 |
| Gd | 5.745 | 5.615 | 5.733 | 5.796 | 5.959 | 5.546 | 5.597 |
| Tb | 0.821 | 0.879 | 0.851 | 0.857 | 0.908 | 0.836 | 0.844 |
| Dy | 4.612 | 4.907 | 4.990 | 4.885 | 4.930 | 4.906 | 4.813 |
| Ho | 0.921 | 0.964 | 0.936 | 0.949 | 0.997 | 0.946 | 0.905 |
| Er | 2.543 | 2.716 | 2.689 | 2.756 | 2.849 | 2.656 | 2.671 |
| Tm | 0.362 | 0.371 | 0.378 | 0.410 | 0.432 | 0.438 | 0.464 |
| Yb | 2.286 | 2.231 | 2.408 | 2.300 | 2.425 | 2.392 | 2.381 |
| Lu | 0.380 | 0.351 | 0.393 | 0.407 | 0.399 | 0.390 | 0.382 |
| Ba | 550.313 | 525.860 | 521.478 | 578.182 | 581.241 | 563.034 | 562.063 |
| Cr | 60.232 | 60.429 | 58.818 | 60.544 | 57.350 | 60.860 | 60.570 |
| Cs | 0.100 | 0.067 | 0.070 | 0.085 | 0.087 | 0.097 | 0.087 |
| Hf | 5.321 | 5.434 | 5.159 | 5.518 | 5.396 | 5.406 | 5.404 |
| Nb | 24.771 | 25.503 | 25.721 | 26.722 | 24.260 | 25.813 | 24.162 |
| Pb | 4.652 | 4.331 | 4.450 | 5.570 | 4.141 | 5.848 | 4.530 |
| Rb | 17.765 | 18.761 | 16.120 | 17.833 | 18.790 | 17.155 | 19.889 |
| Sc | 21.338 | 21.161 | 21.635 | 21.322 | 20.765 | 20.492 | 19.458 |
| Sr | 768.802 | 764.240 | 761.160 | 802.708 | 742.877 | 773.388 | 767.728 |
| Ta | 1.494 | 1.620 | 1.572 | 1.540 | 1.415 | 1.548 | 1.468 |
| Th | 2.574 | 2.505 | 2.585 | 2.791 | 2.632 | 2.765 | 2.689 |
| U | 0.705 | 0.705 | 0.703 | 0.723 | 0.692 | 0.729 | 0.708 |
| V | 192.199 | 197.341 | 198.029 | 195.253 | 179.101 | 190.565 | 191.267 |
| Y | 23.222 | 25.622 | 28.064 | 25.465 | 25.814 | 23.904 | 23.148 |
| Zr | 202.942 | 198.896 | 202.105 | 210.533 | 199.138 | 199.804 | 199.674 |
W La/Nb |
0.366 1.001 |
0.395 1.039 |
0.339 1.075 |
0.461 0.982 |
0.143 1.090 |
0.159 0.973 |
0.324 1.033 |
| Sample no.Rock (TAS) Long. (W) Lat. (N) | COM-06P basaltic trachyandesite 104° 52′ 14.0″ 21° 16′ 43.4″ | COM-07E basaltic trachyandesite 104° 53′ 08.2″ 21° 16′ 29.5″ | COM-03A andesite 104° 49′ 01.3″ 21° 20′ 30.8″ | COM-03B andesite 104° 49 00.7″ 21° 20′ 30.5″ | COM-03C andesite 104° 49′ 03.5″ 21° 20′ 28.6″ | COM-03D andesite 104° 49′ 04.4″ 21° 20′ 27.5″ | COM-03E andesite 104° 48′ 52.5″ 21° 20′ 19.2″ |
|---|---|---|---|---|---|---|---|
| La | 27.601 | 24.230 | 52.776 | 91.143 | 129.010 | 59.580 | 23.724 |
| Ce | 55.313 | 48.881 | 77.538 | 220.724 | 72.229 | 87.619 | 46.809 |
| Pr | 6.901 | 6.184 | 21.188 | 48.820 | 34.852 | 21.625 | 5.887 |
| Nd | 28.010 | 26.011 | 92.061 | 266.146 | 161.076 | 109.595 | 24.625 |
| Sm | 5.922 | 5.272 | 23.673 | 77.591 | 33.852 | 30.727 | 5.105 |
| Eu | 2.220 | 1.963 | 6.612 | 22.764 | 8.827 | 10.030 | 1.730 |
| Gd | 6.101 | 5.670 | 28.339 | 97.385 | 50.123 | 41.770 | 5.004 |
| Tb | 0.886 | 0.848 | 4.340 | 15.670 | 7.557 | 6.165 | 0.733 |
| Dy | 5.159 | 4.597 | 27.174 | 108.508 | 47.216 | 38.553 | 4.315 |
| Ho | 1.010 | 0.941 | 5.544 | 23.647 | 11.458 | 7.989 | 0.844 |
| Er | 2.959 | 2.652 | 16.845 | 77.340 | 34.753 | 23.436 | 2.397 |
| Tm | 0.475 | 0.439 | 2.535 | 12.215 | 4.914 | 3.471 | 0.410 |
| Yb | 2.511 | 2.363 | 15.036 | 80.449 | 28.639 | 20.916 | 2.155 |
| Lu | 0.404 | 0.409 | 2.468 | 12.960 | 5.062 | 3.498 | 0.371 |
| Ba | 608.374 | 559.781 | 985.276 | 1,305.788 | 1,156.494 | 1,057.490 | 1,011.243 |
| Cr | 75.360 | 50.754 | 21.200 | 4.265 | 13.818 | 102.550 | 16.487 |
| Cs | 0.145 | 0.116 | 0.795 | 0.568 | 0.554 | 0.462 | 0.778 |
| Hf | 5.760 | 4.879 | 7.545 | 6.251 | 5.801 | 5.516 | 5.501 |
| Nb | 28.710 | 22.866 | 10.325 | 9.621 | 9.215 | 9.408 | 9.212 |
| Pb | 4.733 | 4.171 | 8.584 | 12.713 | 9.594 | 8.541 | 9.009 |
| Rb | 19.449 | 19.085 | 48.872 | 44.944 | 42.551 | 40.812 | 44.587 |
| Sc | 21.460 | 20.075 | 17.558 | 11.621 | 12.280 | 13.591 | 12.794 |
| Sr | 709.648 | 759.833 | 549.977 | 453.061 | 544.511 | 556.942 | 554.021 |
| Ta | 1.755 | 1.481 | 2.330 | 0.938 | 0.766 | 0.693 | 0.660 |
| Th | 3.176 | 2.582 | 3.366 | 3.532 | 3.562 | 3.566 | 3.511 |
| U | 0.739 | 0.606 | 0.859 | 0.881 | 0.869 | 0.900 | 0.887 |
| V | 187.344 | 175.393 | 124.802 | 91.119 | 104.852 | 104.653 | 100.322 |
| Y | 27.640 | 23.548 | 157.060 | 641.097 | 325.910 | 216.082 | 21.759 |
| Zr | 214.437 | 191.269 | 192.244 | 194.092 | 190.659 | 187.830 | 187.821 |
W La/Nb |
0.443 0.961 |
0.106 1.059 |
0.639 5.111 |
0.980 9.473 |
0.639 14 |
0.670 6.332 |
0.445 2.575 |
| Sample no. Rock (TAS) Long. (W) Lat. (N) | COM-06O andesite 104° 53′ 42.5″ 21° 14′ 57.8″ | COM-07A andesite 104° 54′ 12.5″ 21° 16′ 12.8″ | COM-07B andesite 104° 54′ 04.9″ 21° 16′ 04.9″ | COM-07C andesite 104° 54′ 32.6″ 21° 15′ 33.2″ | COM-07D andesite 104° 53′ 27.3″ 21° 16′ 18.0″ | COM-07Fb andesite 104° 53′ 42.9″ 21° 16′ 08.3″ | COM-07Fa basaltic andesite 104° 53′ 42.9″ 21°16′ 08.3″ |
|---|---|---|---|---|---|---|---|
| La | 25.992 | 50.021 | 83.478 | 57.356 | 38.614 | 30.663 | 15.563 |
| Ce | 39.994 | 60.106 | 65.294 | 41.714 | 45.321 | 30.833 | 24.063 |
| Pr | 6.870 | 18.012 | 32.718 | 12.898 | 8.952 | 6.533 | 3.762 |
| Nd | 27.773 | 81.654 | 143.208 | 52.527 | 38.293 | 27.421 | 15.295 |
| Sm | 5.291 | 21.672 | 31.966 | 10.648 | 8.749 | 5.940 | 3.611 |
| Eu | 2.026 | 6.297 | 9.112 | 3.124 | 2.975 | 2.030 | 1.440 |
| Gd | 5.362 | 21.179 | 33.755 | 11.994 | 11.193 | 7.477 | 3.856 |
| Tb | 0.720 | 3.191 | 5.033 | 1.749 | 1.552 | 1.045 | 0.552 |
| Dy | 4.305 | 17.841 | 29.829 | 10.643 | 9.607 | 6.544 | 3.667 |
| Ho | 0.822 | 3.396 | 6.053 | 2.181 | 1.949 | 1.380 | 0.677 |
| Er | 2.245 | 9.409 | 17.896 | 6.291 | 5.684 | 4.099 | 2.024 |
| Tm | 0.373 | 1.396 | 2.523 | 0.932 | 0.818 | 0.567 | 0.268 |
| Yb | 2.155 | 8.370 | 15.767 | 5.235 | 4.580 | 3.197 | 1.672 |
| Lu | 0.337 | 1.290 | 2.654 | 0.876 | 0.798 | 0.572 | 0.253 |
| Ba | 512.523 | 714.234 | 823.418 | 689.718 | 730.057 | 632.935 | 433.384 |
| Cr | 6.959 | 57.802 | 48.622 | 74.348 | 53.281 | 115.039 | 178.551 |
| Cs | 0.143 | 0.406 | 0.467 | 0.421 | 0.415 | 0.311 | 0.302 |
| Hf | 4.149 | 4.082 | 3.831 | 3.385 | 3.712 | 3.234 | 2.787 |
| Nb | 3.707 | 6.218 | 5.890 | 5.200 | 5.722 | 4.843 | 4.114 |
| Pb | 5.403 | 6.513 | 6.283 | 5.802 | 6.030 | 4.862 | 4.023 |
| Rb | 12.675 | 31.562 | 24.267 | 27.429 | 27.859 | 22.726 | 14.539 |
| Sc | 10.484 | 14.609 | 14.704 | 13.748 | 14.213 | 15.273 | 19.187 |
| Sr | 1,131.086 | 676.059 | 631.733 | 675.369 | 668.822 | 674.660 | 750.743 |
| Ta | 0.692 | 0.610 | 0.477 | 0.413 | 0.437 | 0.367 | 0.481 |
| Th | 2.138 | 2.474 | 2.441 | 2.188 | 2.326 | 1.877 | 1.132 |
| U | 0.585 | 0.609 | 0.592 | 0.577 | 0.583 | 0.493 | 0.333 |
| V | 123.875 | 124.456 | 108.144 | 108.521 | 111.807 | 113.494 | 152.109 |
| Y | 26.957 | 76.034 | 144.243 | 56.733 | 57.640 | 56.425 | 26.273 |
| Zr | 125.995 | 127.622 | 131.688 | 127.041 | 124.034 | 120.055 | 100.222 |
W La/Nb |
0.348 7.011 |
0.820 8.044 |
0.322 14.172 |
0.295 11.03 |
0.478 6.748 |
0.241 6.331 |
0.167 3.782 |
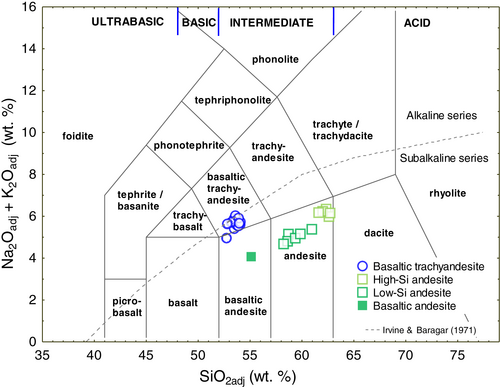
In the total alkalis versus silica diagram (TAS; Le Bas, Le Maitre, Streckeisen, & Zanettin, 1986; Figure 7), most of the samples have an intermediate composition. These intermediate volcanic rocks are grouped between the alkaline and subalkaline series fields and are defined as transitional series in the basaltic trachyandesites field. Andesites belong to the subalkaline series, which are divided with respect to the contents of SiO2: a single basaltic andesite sample (55.11 wt% SiO2), low-Si andesites (58.22–60.94 wt% SiO2), and high-Si andesites (61.60–62.71 wt% SiO2). These andesites display an evolutionary trend from basaltic andesite to high-Si andesites.
On the SiO2 versus K2O diagram (Figure S2; Rickwood, 1989), basaltic trachyandesites are plotted in the field of high-K. The basaltic andesite sample plot in the medium-K, the low-Si andesites plot along the boundary between medium-K and high-Si andesites plot in the high-K field. Andesites samples display the same evolutionary trend as in TAS diagram.
On a SiO2 versus TiO2 diagram (Figure S3), basaltic trachyandesites display a vertical trend and the andesites display a slightly horizontal trend from the basaltic andesite, through the low-Si andesites to high-Si andesites. For all samples, the TiO2 values are low with respect to the mafic rocks in the NVC and SVC with much higher TiO2 values of (1.6 wt%) reported by Petrone et al. (2003).
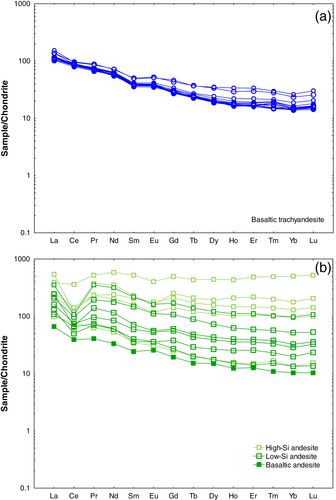
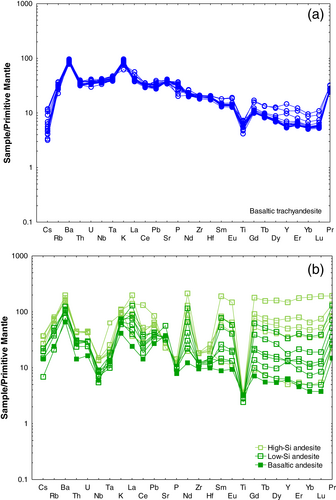
On a chondrite-normalized diagram (McDonough & Sun, 1995; Figure 8a, Table 3), the basaltic trachyandesites are characterized by enriched light rare earth elements (LREE) patterns relative to high rare earth elements (HREE) [(La/Yb)N = 5.81–8.07], with weak to negligible Eu anomalies (Eu/Eu* = 1.06–1.16). The basaltic andesites display slightly enriched LREE patterns to HREE [(La/Yb)N = 6.32] with a positive Eu anomalies (Eu/Eu* = 1.16). The high and low-Si andesites display fractionated REE patterns, [(La/Yb)N = 3.59–8.19] with slightly positive Eu anomalies (Eu/Eu* = 0.83–1.14, Figure 8b). In a primitive-mantle-normalized multi-element diagram (McDonough & Sun, 1995; Figure 9a), the basaltic trachyandesites show pronounced enrichment in large-ion lithophile elements (LILE), but negligible depletion in Nb (Nb/Nb* = 0.52–0.62) and negative Ti (Ti/Ti* = 0.39–0.74), anomalies, typical for Ocean Island Basalt (OIB)-like basalts. The basaltic andesites and low-Si and high-Si andesites show enrichment in LILE, along with negative Nb-Ta, P, and Ti anomalies, typical for arc-related magmas (Figure 9b).
5.3 Sr–Nd isotopic data
Three basaltic trachyandesite and one basaltic andesite samples were further analyzed for whole-rock Sr–Nd isotope compositions. The basaltic trachyandesite display initial 87Sr/86Sr ratios of 0.703519–0.703882 and positive ƐNd(t) values of +5.5 to +5.6 (Table 4). The basaltic andesite exhibits comparatively little high 87Sr/86Sr ratio of 0.704073 and positive ƐNd(t) values of +3.4 (Table 4). Initial 87Sr/86Sr ratios and ƐNd(t) values were calculated to t = 1.05 Ma for the basaltic trachyandesites and t = 2.42 Ma for the basaltic andesites, respectively (Table 4).
| Sample | Rock type | Age (Ma) | Rb (ppm) | Sr (ppm) | 87Rb/86Sr | 87Sr/86Sr | ±2σ | 87Sr/86Sr(i) | Sm (ppm) | Nd (ppm) | 147Sm/144Nd | 143Nd/144Nd | ±2σ | 143Nd/144Nd(i) | ƐNdt |
|---|---|---|---|---|---|---|---|---|---|---|---|---|---|---|---|
| COM-06C | BTA | 1.05 | 19.72 | 2,608.14 | 0.0219 | 0.703883 | 2 | 0.703882 | 5.01 | 24.41 | 0.1242 | 0.512919 | 5 | 0.512918 | 5.6 |
| COM-06E | BTA | 1.05 | 12.19 | 2,462.51 | 0.0143 | 0.703520 | 3 | 0.703519 | 6.16 | 28.66 | 0.1299 | 0.512913 | 2 | 0.512912 | 5.5 |
| COM-06P | BTA | 1.05 | 15.77 | 2,403.39 | 0.0190 | 0.703618 | 3 | 0.703617 | 4.83 | 22.87 | 0.1278 | 0.512917 | 1 | 0.512916 | 5.6 |
| COM-7Fa | A | 2.42 | 12.63 | 2,686.78 | 0.0000 | 0.704074 | 3 | 0.704073 | 2.33 | 12.66 | 0.1111 | 0.512807 | 2 | 0.512805 | 3.4 |
- Note: Reports values for 87Sr/86Sr(i) and 143Nd/144Nd(i) are age corrected with their respectively age sample. For calculations ƐNdt CHUR, we use the values taken from Faure (1977) for 143Nd/144Nd = 0.51263 and 147Sm/144Nd = 0.1960. The ±2σ for individual instruments are multiplied by 106 for Sr and Nd.
- Abbreviations: A, andesite; BTA, basaltic trachyandesites.
5.4 40Ar/39Ar geochronology
A total of three samples were collected for 40Ar/39Ar dating COM-06C and COM-06J belong to the basaltic trachyandesites and COM-7Fa belong to the basaltic andesite (Table 5). The whole-rock fragments of the samples are used for 40Ar/39Ar dating. The results indicate two different age intervals 1.05 for basaltic trachyandesite and 2.42 Ma for basaltic andesite (Figure 10a–f and Table 5). The groundmass fraction of sample COM-06C shows a plateau age of 1.05 ± 0.15 Ma (Figure 10a). This plateau contains 71.8% of the 39Ar released during the step-heating. The inverse isochron plot from this data calculates to and an age of 1.35 ± 0.32 Ma (Figure 10b). The inverse isochron plot calculation of the 40Ar/36Ar ratio is slightly sub-atmospheric Ar, 285.8 ± 8.1 (compared to the atmospheric Ar ratio of 298.56 Ma, Lee et al., 2006).
| Sample | Material dated* | 39Ar (%) | Isochrone (Ma) | Isochrone MSWD | (40Ar/39Ar)I | Plateau age (Ma) | Plateau MSWD | Steps used |
|---|---|---|---|---|---|---|---|---|
| Basaltic trachyandesite | ||||||||
| COM-06C | gms | 71.8 | 1.35 ± 0.32 | 0.84 | 285.8 ± 8.1 | 1.05 ± 0.15 | 0.43 | 7–13 |
| COM-06 J | gms | 100 | 1.25 ± 0.47 | 1.19 | 289 ± 20 | 1.07 ± 0.17 | 1.16 | 13 |
| Basaltic andesite | ||||||||
| COM-7Fa | gms | 100 | 2.53 ± 0.85 | 1.08 | 297.0 ± 9.3 | 2.42 ± 0.36 | 1.00 | 13 |
- Note: All errors reported as 2σ. Material dated*: gms, groundmass. MSDW, mean square of weighted deviates. Monitor was biotite mineral standard GA1550 (99.73 Ma).
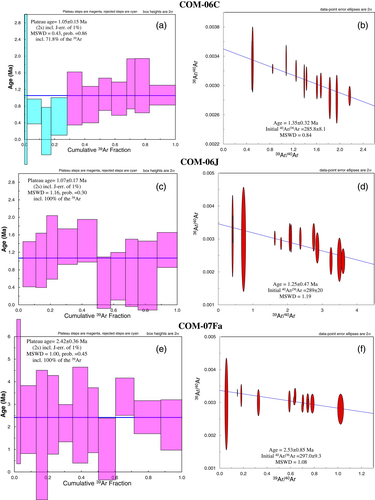
COM-06J has a plateau age of 1.07 ± 0.17 Ma (Figure 10c). This plateau contains all 13 steps of the step-heating experiment. The inverse isochron correlation plot from these data (Figure 10d) gives an age within error of the plateau age at 1.25 ± 0.47 Ma and a 40Ar/36Ar intercept within error of atmospheric Ar (289 ± 20 Ma). The isochron age from this sample could not be considered reliable due to the spread of error display; nevertheless, the more robust age to consider for this sample is the plateau age.
40Ar-39Ar analyses of groundmass from the basaltic andesite sample COM-07Fa gives a plateau age of 2.42 ± 0.36 Ma (Figure 10e) produced from all 13 steps of the step-heating experiment. The inverse isochron correlation plot (Figure 10f) calculates an age of 2.53 ± 0.85 Ma and an atmospheric 40Ar/36Ar intercept value of 297.0 ± 9.3 Ma.
6 DISCUSSION
6.1 40Ar/39Ar geochronology
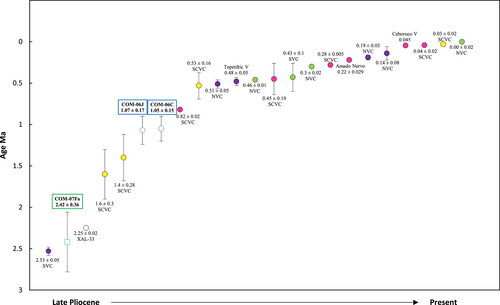
The major volcanic activity of the SPC Graben, which is a part of TZR started around the late Pliocene and was continuous to the present (Figure 11). The borders of the SPC Graben follows a NW-SE trend of the NVC and SVC. The volcanic activity of the SVC represented by scoria cones, lava flows and domes started at 2.53 Ma and possibly continued until 0.43 Ma, represented by scoria cones, lava flows and domes. The monogenetic volcanic activity in the NVC was started during 0.51 Ma and continues to the present (Ferrari et al., 2003). It has been linked with the volcanic activity of the flanks of Ceboruco and Tepetiltic volcanoes (Petrone, 2010). However, Frey et al. (2007) reported an age of 2.25 Ma, which could be correlated with the beginning of volcanic activity of the NVC, because it follows the same NW-SE trend and compositionally correlates with the sub-alkaline transitional low-Ti series distinguished by Petrone et al. (2003). In the Compostela area, the ages for the basaltic trachyandesites are younger than the andesites (Figure 11). The calculated ages for the basaltic trachyandesites COM-06C are 1.05 ± 0.15 Ma from lavas erupted via a feeder dyke that cuts and covers discordantly the crystal lithic tuff. While sample COM-06J with an age of 1.07 ± 0.17 Ma is from subaerial flows deposited where the topography lows. The new ages reported here extend the constrained ages for the NVC from the volcanic activity around 0.51 Ma and continued to the present (Ferrari et al., 2003) that follow the WNW trend of the cinder cones and domes of the flanks of Tepetiltic and Ceboruco volcanoes (Petrone, 2010). The andesitic lavas represented by basaltic andesite have a calculated age of 2.42 ± 0.36 Ma. This age correlates with the volcanic activity at the SVC at 2.53 ± 0.05 Ma (Petrone et al., 2001) represented by scoria cones, lava flows, and domes. In this study, the andesites in the north-east part of the Compostela area were not dated. Frey et al. (2007) have already dated these andesites at 2.25 ± 0.02 Ma (Figure 12).

6.2 Petrogenesis
6.2.1 Crustal contamination
Crustal contamination could be due to addition of subducted pelagic sediments to the mantle source region (source contamination) and/or to assimilation of crustal material during ascent of mantle-derived magma (Davidson & Harmon, 1989; James, 1981). This caused a change in the chemical composition of the primary magma, which could be explained by a combined process of crystal fractionation and assimilation. A small amount of crustal contamination has been used to explain the assimilation and fractional crystallization (AFC) processes in both the Mexican Volcanic Belt (MVB) and TMVB (Verma, 1983; Verma & Dobson, 1987; Verma & Nelson, 1989).
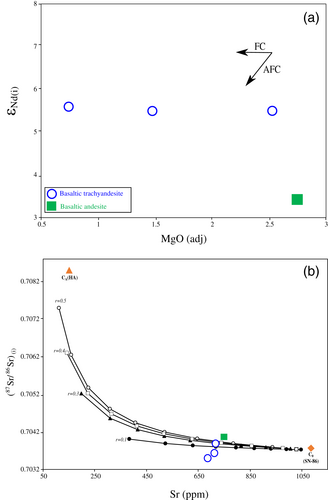
In this study, the low negative trending between ƐNd(i) values and MgO contents in the basaltic andesite rock suggests that small levels of fractionation were associated with crustal contamination (Figure 13a). Nevertheless, the basaltic trachyandesite samples display a flat trend that suggest fractionation of the evolved rocks (Figure 13a). For a better understanding of the processes that involved the evolution of the basaltic trachyandesites and andesites from the Compostela area, a quantitative treatment was carried out to determine the AFC processes. The model was developed following the equations proposed by DePaolo (1981). Isotopic and trace concentrations of a calc-alkaline basalt (SN-86, SiO2 = 50.5% m/m) taken from Verma and Nelson (1989), were considered as initial magma (Co), for assimilated wall rock (CA), a hypothetical assimilant (HA) proposed by Verma (2000). A mineralogical arrangement of 0.65Plg + 0.2Cpx + 0.08Ol + 0.05Mt + 0.01Opx + 0.01 Amp was considered for the fractional crystallization process. The partition coefficients used for this model were taken from McKenzie and O'Nions (1991) and Villemant, Jaffrezic, Joron, and Treuil (1981). Isotope AFC model (Figure 13b) was calculated considering ratios for r = 0.1, r = 0.3, r = 0.4, r = 0.5 for the assimilation to the fractional crystallization, as well as the fraction of magma remaining F = 0.9 to 0.1. The AFC model displays that basaltic trachyandesite and basaltic andesite samples experience low degrees of assimilation (r > 0.1) of the assimilated wall rock combined with fractional crystallization. The model reveals ~40% of assimilation from the assimilated wall rock. This can be correlated with the small amount of sieved textures found in the mineral analysis (Figure 6f). The finding of the low degree of assimilation in calc-alkaline volcanic rocks from this area is consistent with the results of Verma and Nelson (1989), which suggest that most of the contamination occurs in deeper levels of the crust, below the level of magma chambers, where most of the fractionation occurs (Verma & Nelson, 1989).
6.2.2 Implications for the magma source
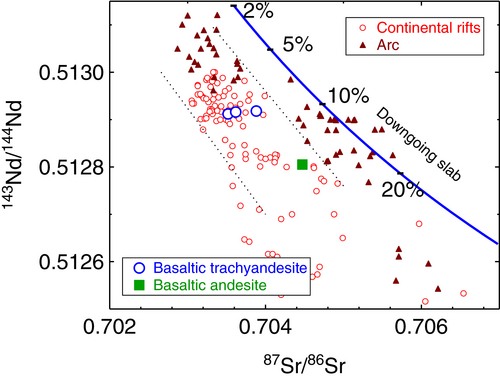
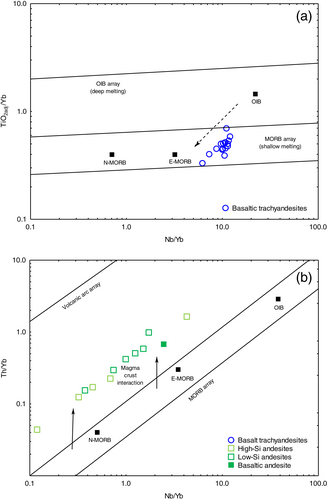
On a conventional Sr–Nd isotope diagram (Figure 14), the basaltic trachyandesite and basaltic andesite samples plot within the mantle array. The basaltic trachyandesites exhibit higher 143Nd/144Nd and 87Sr/86Sr ratios suggesting a predominantly mantle component of the parent magma without any evidence of subduction component involved in the petrogenesis (Figure 14). The continental rift rocks plot mainly within and close to the mantle array (Figure 14). The island arc rocks plot from the mantle array towards the trace of the ‘Downgoing slab’ as is the case of all other arcs. The basaltic trachyandesites plot mainly to mantle array and related with a continental rift into the WTMVB (Figure 14). The basaltic andesite (COM-07Fa) displays lower 143Nd/144Nd and higher 87Sr/86Sr values suggesting that mantle-lower crust component may be involved in the evolution with a subduction component (Figure 14). This basaltic andesite (COM-07Fa) plots close to the ‘Downgoing slab’ that is related with the subduction magmatism along the western sector of the TMVB. Moreover, the bivariate diagram Nb/Yb versus TiO2/Yb (Figure 15a; Pearce, 2008) shows that the basaltic trachyandesites were derived from a plume-ridge interaction from the OIB-type to the MORB source, and indicate a mantle component involved in the magma generation (Figure 15a; Pearce, 2008). The Nb/Yb versus Th/Yb diagram (Figure 15b; Pearce, 2008) displays a MORB-like mixed source (mantle–crust) for the andesites (Figure 15b), which may have been derived from a subducted slab and/or subducted sediments.
6.3 Tectonic setting and geodynamic implications
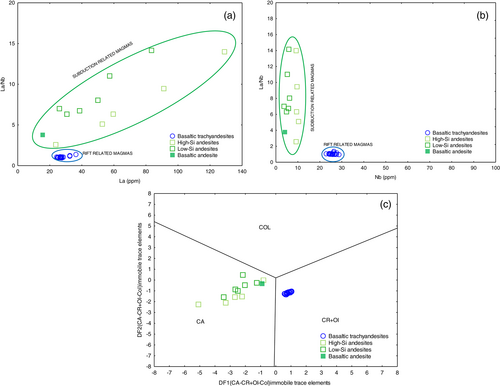
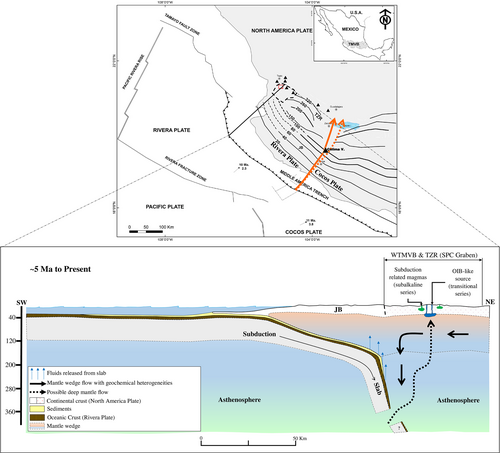
The geochemical evidence indicates that magmas that produced the andesitic lavas show a subduction related tectonic regime with high ratios of La/Nb (Barth, McDonough, & Rudnick, 2000) and the basaltic trachyandesites originated in an intraplate regime with low ratios of La/Nb (Sun & McDonough, 1989; Figure 16a,b). In addition, we tested multi-dimensional discrimination diagrams, which were based on the linear discriminant analysis (LDA) and log-ratio transformation (Verma, 2010). In this discrimination diagram (Figure 16c), basaltic andesite and andesite rocks were discriminated as arc-related (continental arc (CA) by Verma & Verma, 2013) and the basaltic trachyandesites were discriminated as within-plate (combined continental rift and Ocean Island [CR + OI] by Verma & Verma, 2013). Figure 17 presents a schematic illustration of the Rivera Plate and the Cocos Plate are subducting beneath the Jalisco Block in the WTMVB, the solid and interrupted orange line shows approximately the slab separation between the Rivera and Cocos Plate close to the Colima Volcano. This separation increases in size at depth; therefore, the Rivera Plate subducts more steeply than Cocos's Plate into the continent (North American Plate). This observation supports the argument that the young and small Rivera Plate has rolled back toward the trench in the WTMVB. In Figure 17, the section of the subduction zone of the Rivera Plate at ⁓5 Ma to present shows that the Rivera Plate's slab increased and rolled back that induced fluid from the asthenosphere into the mantle wedge, which is responsible for the mantle mixing and magma generation such as mixed volcanism -subduction, rifting and OIB. Furthermore, volcanism of OIB-like basalts (transitional series) is a result of rising in the mantle wedge and andesitic composition (sub-alkaline series) is a subduction of shallow slab of Rivera Plate. In the Compostela area, the basaltic trachyandesite and andesite rocks represent these two signatures, and the tectonic structure that allowed these magmas to rise to the surface is the SPC Graben within the TZR.
7 CONCLUSIONS
- New geochemical and isotopic data for the Compostela volcanic rocks provide insight regarding the petrogenesis and mantle source of the basaltic trachyandesite and andesite rocks. Compositionally, these volcanic rocks are of the high-K calc-alkaline to medium-K calc-alkaline.
- Modeling of trace element and isotope ratios suggest that the AFC has operated during the evolution of basaltic trachyandesite and andesite rocks.
- The 40Ar/39Ar data presented in this study clearly shows that the studied rocks were erupted in two discrete episodes of 1.07–1.05 Ma and 2.42 Ma, respectively.
- Trace element geochemistry, isotopic data and plate tectonic model indicate that both rifting and subduction appear to be taking place in the origin of basaltic trachyandesite and andesite rocks.
ACKNOWLEDGEMENTS
V.R.M. is thankful to the National Council of Science and Technology (CONACYT), Mexico for her doctoral fellowship [grant # 270565], whose doctoral thesis is in preparation under the guidance of S.K.V. S.K.V. and T.L.B. acknowledge the financial support provided by the Newton Advanced Fellowship award – The Royal Society, UK under grant [NA160116] for the field and analytical works. We extend our sincere thanks to Dr. Alison Halton for running and recalculating the Ar–Ar dating work at The Open University, Milton Keynes, United Kingdom. Technical support for XRD powered Beatriz Adriana Rivera Escoto at División de Materiales Avanzados LINAN-IPICyT and Ing. Hector Chavez Polina for facilitating the access in the field in Compostela. We much appreciate the journal reviewers Dr. Cláudia R Passarelli and two anonymous individual for numerous constructive comments and the Editor-in-Chief Prof. Ian D. Somerville for his valuable comments and efficient handling of our manuscript.
Open Research
DATA AVAILABILITY STATEMENT
Data available on request from the authors: The data that support the findings of this study are available from the corresponding author upon reasonable request.


