Genesis and fluid evolution of the Yuku porphyry Mo deposit, East Qinling orogen, China
Handling Editor: L. Tang
Funding information: National Natural Science Foundation of China, Grant/Award Number: 41572318
Abstract
The Yuku is a large porphyry Mo deposit (1.5 Mt at 0.12% Mo) in the Luanchuan ore district of the East Qinling orogen, central China. The economic Mo ore bodies occur as veins, veinlets, and disseminated ore and are developed mainly within the late Mesozoic Yuku porphyritic granite. Molybdenum mineralization is generally associated with potassic and phyllic alteration. Hydrothermal processes in the Yuku deposit are divided into four stages: (I) a quartz–K-feldspar–biotite ± pyrite stage, (II) a quartz–molybdenite ± pyrite ± K-feldspar ± sericite stage, (III) a quartz–polymetallic sulphide stage, and (IV) a calcite ± quartz ± fluorite ± pyrite stage. The fluid evolution during these hydrothermal stages was constrained through systematic investigation of fluid inclusions (FIs) and H−O isotopes. Four types of primary or pseudosecondary FIs were recognized in hydrothermal quartz and calcite: two-phase liquid-rich inclusions (L-type), two-phase vapour-rich inclusions (V-type), halite-bearing (hypersaline) inclusions (H-type), and three-phase CO2-bearing inclusions (C-type). FIs within Stages I–IV have homogenization temperatures of 375 to >550, 297–400, 198–298, and 149–188°C, with salinities of 0.53–13.18, 0.35–40.23, 5.11–11.81, and 5.71–9.73 wt% NaCl equiv., respectively. In Stage I, coexisting vapour-rich (V-type) and liquid-rich (L-type) FIs have similar homogenization temperatures (488 to >550°C) and distinct salinities, indicating fluid boiling during the formation of quartz–K-feldspar–biotite veins at a pressure of 550–700 bar and a lithostatic depth of 2.3–2.8 km. In Stage II, FIs in quartz were also trapped under boiling conditions, as evidenced by coexisting hypersaline H-type (34.13–40.23 wt% NaCl equiv.) and low-salinity V-type (0.35–2.24 wt% NaCl equiv.) inclusions, which formed at temperatures of 309–361°C and hydrostatic depths of 1.0–2.0 km, equivalent to pressures of 100–200 bar. During Stage III, the ore-forming fluids were cooler (198–298°C) and more dilute (5.11–11.81 wt% NaCl equiv.) due to the involvement of meteoric water, with minimum trapping pressures estimated at <100–150 bar, corresponding to a hydrostatic depth of <1.0 km. In Stage IV, temperatures decreased further to 149–188°C, with lower salinities (5.71–9.73 wt% NaCl equiv.), indicating a post-ore fluid stage. These data suggest that the mineralizing fluids forming the Yuku Mo deposit changed from early moderate- to low-salinity CO2-rich fluids in the H2O–NaCl–CO2 system that formed at high temperature and pressure, to late H2O–NaCl low-salinity fluids that formed at low temperature and pressure. H−O isotopic compositions indicate that the mineralizing fluids had a dominantly magmatic signature but were diluted by meteoric waters. Combining our integrated analysis of the fluid evolution and deposit geology, we propose that fluid boiling and fluid–rock interaction, including intensive potassic alteration, changed the salinity and triggered CO2 escape, leading to a decrease in fO2 and an increase in the acidity of the ore-forming fluids, which ultimately controlled the deposition of molybdenite in the Yuku Mo deposit.
1 INTRODUCTION
The East Qinling–Dabie orogen is an important molybdenum metallogenic belt, hosting >8 Mt Mo and 40 Mo-related deposits or occurrences, and constitutes >60% of Mo reserves in China (Li & Pirajno, 2017; Mao et al., 2011; Zeng et al., 2013). These Mo deposits are predominantly porphyry or skarn types (Mao et al., 2011; Ni et al., 2015; Pirajno & Zhou, 2015; Wang et al., 2012, 2015, 2017), with some magmatic hydrothermal vein-type or carbonatite-hosted deposits (Deng, Santosh, Yao, & Chen, 2014; Deng et al., 2015; Tang et al., 2021a). Within this belt, porphyry Mo deposits formed in a post-collisional regime (Chen & Li, 2009; Chen, Wang, Li, Yang, & Pirajno, 2017; Li et al., 2012; Yang, Chen, Pirajno, & Li, 2015), which is distinct from traditional porphyry deposits that formed mainly in oceanic subduction–related magmatic arcs (Audétat & Li, 2017; Klemm, Pettke, & Heinrich, 2008; Lawley, Richards, Anderson, Creaser, & Heaman, 2010; Seedorff & Einaudi, 2004a, 2004b; Selby & Creaser, 2001; Selby, Nesbitt, Muehlenbachs, & Prochaska, 2000). The occurrence of post-collision-related porphyry Mo deposits suggests that an intercontinental setting is also conducive to the formation of porphyry Mo mineralization (Chen et al., 2017; Mao et al., 2011; Yang et al., 2013; Zhang, Wang, Liu, & Wang, 2018). Thus, these deposits offer the opportunity to study porphyry Mo systems formed within post-collision settings.
The Yuku deposit is a large and recently explored porphyry Mo deposit in the Luanchuan ore district, representing a new breakthrough in porphyry Mo prospecting in the East Qinling orogen. This deposit contains >1.5 Mt Mo at an average grade of 0.12% (Guo et al., 2018). Because of its economic importance, there have been several recent studies on the deposit (Cao et al., 2015; Du, Wang, & Jia, 2019; Guo et al., 2018; Li et al., 2015; Xue et al., 2018; Yang et al., 2020). Molybdenite Re–Os data yielded mineralizing ages of 147–144 Ma that are coeval with the zircon U–Pb age of the Yuku porphyritic granite (Guo et al., 2018; Li et al., 2015; Xue et al., 2018). Multiple isotopes indicate that the Yuku intrusion was sourced from partial melting of the lower crust with a minor mantle contribution (Bao, Wang, Zhao, Li, & Gao, 2014; Guo et al., 2018; Li et al., 2015; Xue et al., 2018; Yang et al., 2019). However, existing research has focused on geochronology, geochemistry, and mineralogy, meaning that the evolution and source of the ore-forming fluids and the processes of Mo mineralization remain poorly understood.
Our research presents a systematic fluid inclusion (FI) and H–O isotope study of the Yuku Mo deposit. These data provide new insights into: (a) the origin and evolution of the ore-forming fluids and (b) the processes of molybdenite precipitation. These results enhance our understanding of the formation and evolution of porphyry-type Mo deposits in intercontinental collision settings.
2 REGIONAL GEOLOGY
The East Qinling orogen hosts more than 6 Mt Mo metal resources (Li & Pirajno, 2017; Li, Ulrich, et al., 2012; Mao et al., 2011; Wang et al., 2015) and is limited by the Sanmenxia–Lushan Fault in the north and the Shang-Dan Fault in the south (Figure 1; Bao et al., 2014; Mao et al., 2011; Tang et al., 2016, 2021a, 2021b; Wang et al., 2015). It consists of Late Archean (2.9–2.6 Ga) Taihua Group crystalline basement (primarily, TTG lithology; Mao et al., 2010), superimposed unconformably by the Xiong'er Group that is composed of metamorphosed volcanic sequence, including basaltic andesite, andesite, dacite, and rhyolite (Li, Chen, Pirajno, & Ni, 2013; Li, Ulrich, et al., 2012). This group is overlain by the Meso- to Neoproterozoic sedimentary rocks of the Guandaokou and Luanchuan groups in the region (Chen, Pirajno, & Sui, 2004; Wang et al., 2019).
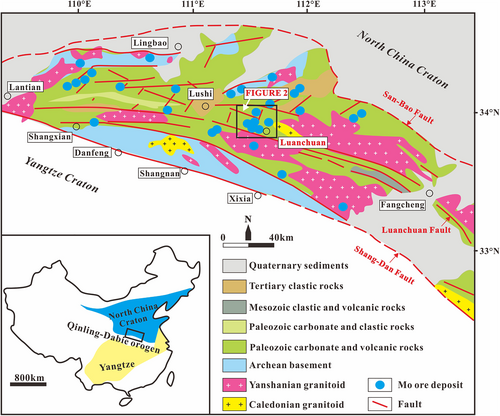
The Luanchuan ore district is the large porphyry–skarn Mo ore cluster in the East Qinling orogen (Figure 2; Mao et al., 2011; Wang et al., 2012, 2015; Wang, Ma, et al., 2017) and sandwiched by the Miaozi Fault to the north and the Luanchuan Fault to the south. The sedimentary rocks in the Luanchuan area are dominated by the Mesoproterozoic Guandaokou Group, the Meso- to Neoproterozoic Kuanping Group, the Neoproterozoic Luanchuan Group, and the Early Palaeozoic Taowan Group. These stratigraphic units have similar constituents, including dolomite, marble, sandstone, quartzite, schist, and amphibolite. The WNW-, NE-, and NNE-trending faults are the major structures in the Luanchuan ore district. The main WNW-trending structures are the Luanchuan and Miaozi faults, while the NE-trending faults are the Huangbeiling-Nannihui-Majuan and the Shibaogou-Zhuangke faults, which represent the result of the continental collision between the North China Craton and the Yangtze Craton. These different trend structures restricted the distribution of intrusive rocks (Mao et al., 2011), which consist of Mesozoic granitic porphyry, monzogranite, granite, and quartz diorite, as well as some of the Neoproterozoic gabbro (Bao et al., 2014; Li, Ulrich, et al., 2012; Wang et al., 2011, 2018; Xue et al., 2018). Numerous data of zircon U–Pb revealed that these Mesozoic granitoids were emplaced during 158–141 Ma (Bao et al., 2014; Guo et al., 2018; Mao et al., 2005, 2010; Wang, Zhang, Zhang, et al., 2018; Xue et al., 2018).
3 DEPOSIT GEOLOGY
3.1 Geology
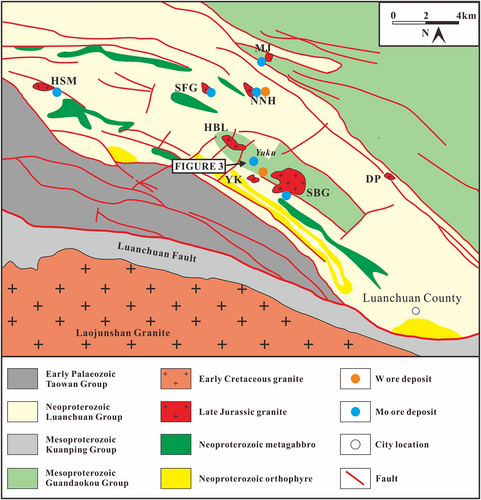
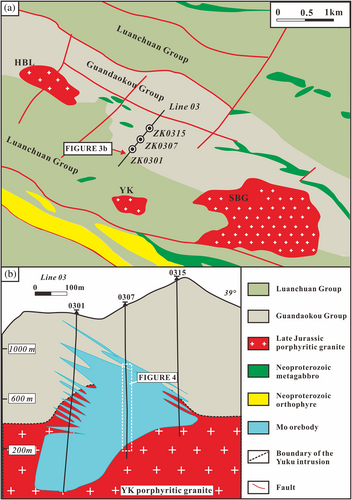
The Yuku Mo deposit is located in the north of the Yuku porphyritic granite that was emplaced into the Guandaokou (dominate Baishugou Formation) and Luanchuan (the Sanchuan, Nannihu, and Meiyaogou formations) groups, with an outcrop area of 0.05 km2. The country rocks exposed are mainly composed of sandstone, meta-sandstone, quartzite, schists, hornfels, and marble (Figure 3a). The WNW- and NE-trending faults are the primary fracture trends in the Yuku deposit, whereas both of them preceded the Mo mineralization, which produced channels for the subsequent ore-bearing hydrothermal fluids. The Mo ore bodies appear approximately lenticular or stratoid in the cross-section. The main ore body is hosted within the porphyritic granite, ranging from 4 to 641 m in thickness (Figure 3b). The large-scale Yuku deposit contains 1.5 Mt Mo metal reserves at a mean grade of 0.12%. The igneous phase of the Yuku intrusion consists of porphyritic granite, aplite, and leucogranite. The porphyritic granite is more abundant and the major host rock of Mo mineralization, comprising of K-feldspar (40–55%), quartz (20–35%), and plagioclase (~10%) as phenocrysts, with K-feldspar (<10%), quartz (<5%), and infrequent biotite as groundmass. Previous research indicated that the Yuku intrusion was emplaced at 154–147 Ma (Guo et al., 2018; Li et al., 2015; Xue et al., 2018) and belonged to the high-K calc-alkaline to shoshonite I-type granitoid (Guo et al., 2018; Xue et al., 2018). Also, isotopic studies indicate a mixed mantle–crust origin, exhibiting primary re-melting of the Taihua Group with minor input of mantle materials (Bao et al., 2014; Guo et al., 2018; Xue et al., 2018).
3.2 Alteration and Mineralization
3.2.1 Representative alteration
Hydrothermal alteration is widespread and intensive in the Yuku deposit and identified by potassic and sericitic zones from the inner porphyritic granite through biotite hornfels, skarn, and prophylitic alteration zones to outer marble and schists (Figure 4). Mo mineralization with minor Pb–Zn mineralization in the Yuku deposit is predominately associated with potassic and phyllic alterations. The prophylitic alteration contains rare Pb–Zn mineralization, whereas no molybdenite or other sulphides coexist with garnet and pyroxene in the skarn zone.
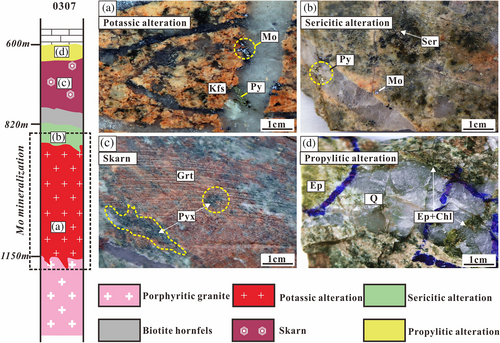
Potassic alteration dominates the deposit and is closely related to the molybdenite mineralization in the study area. The intense and pervasive potassic alteration is composed of K-feldspar, quartz, and biotite, with locally disseminated magnetite, presenting as planar or massive aggregation (Figure 4a), veins, or veinlets, with the major form of quartz–K-feldspar–biotite and minor quartz–K-feldspar–pyrite assemblages.
Phyllic alteration (sericitization or sericitic alteration) is the subordinate and generally overlains the potassic alteration (Figure 4b), which contains abundant sericite, quartz, and minor pyrite. Plagioclase, K-feldspar, and biotite have been altered by sericite or hydrothermal muscovite.
Skarn alteration is relatively weak compared with the development of potassic and phyllic alterations in the Yuku deposit (Figure 4c). This alteration is related to the anhydrous calc-silicate mineral assemblage that consists of abundant garnet, moderate abundances of pyroxene, and minor amounts of wollastonite. Owning to the limited distribution, we did not implement further detailed skarn zones in this paper.
Propylitic alteration assemblage is close to the outer sedimentary rocks, composed of quartz, epidote, chlorite, and minor pyrite (Figure 4d). Rare disseminated galena and sphalerite occur, whereas no molybdenite develops the propylitic alteration zone.
3.2.2 Mineralization and paragenesis
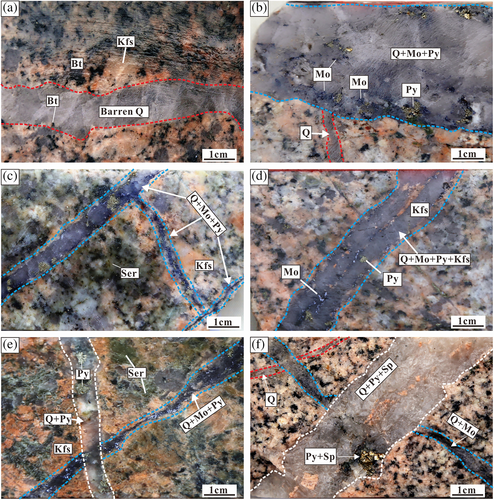
- Stage I: early barren quartz–K-feldspar–biotite ± pyrite veins (Figure 5a). These veins symbolize early barren hydrothermal events, in which ubiquitous quartz, K-feldspar, and locally biotite typify early mineral assemblages in the porphyry system (Li, Chen, Ulrich, & Lai, 2012; Zhang et al., 2016, 2018; Zhang, Wang, Xue, Liu, & Zhang, 2019). Stage I veins are commonly 0.5–10 cm thick, but occasionally up to 50 cm thick, and enveloped by potassic alteration.
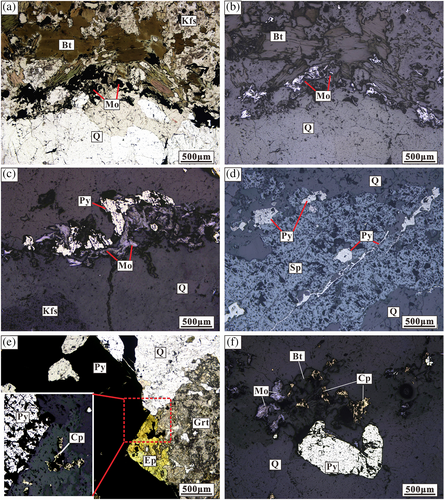
- Stage II: quartz–molybdenite ± pyrite ± K-feldspar ± sericite veins or stockworks (Figure 5b–d). Stage II veins contain the main Mo mineralization (>80% of the Mo reserve) in the Yuku deposit and are developed within the potassic and phyllic alteration zones (Figure 4a,b). These veins are 0.5–8 cm wide and composed of quartz, molybdenite, minor pyrite, and K-feldspar (Figure 5b–d). Molybdenite occurs as fine- or medium-grained crystals present as irregular streaks or flakes (Figure 6a–d) that are distributed along vein walls (Figure 5b) or fill the cores of veins (Figure 5d). Some quartz–molybdenite veins are hosted in the phyllic alteration zone (Figure 5c). Biotite is extensively altered to sericite, presenting as green aggregates that coexist with molybdenite-forming quartz–molybdenite–sericite veins or stockworks. The quartz–molybdenite veins commonly cross-cut and, therefore, postdate, the barren quartz–K-feldspar veins (Figure 5b).
- Stage III: quartz–polymetallic sulphide veins (Figure 5e,f). These veins are characterized by the widespread development of quartz and pyrite and the local development of galena and sphalerite (Figure 5f,6d). Rare molybdenite and chalcopyrite coexist with pyrite (Figure 5e,f). The quartz–polymetallic sulphide veins are 0.5–2 cm thick and commonly cross-cut the Stage II quartz–molybdenite veins. Such veins are generally hosted in potassic, phyllic, and propylitic alteration zones within the Yuku deposit.
- Stage IV: late barren calcite ± quartz ± fluorite ± pyrite veins or veinlets. This mineral assemblage typifies the latest stages of the hydrothermal evolution of the Yuku Mo deposit and are a typical post-mineralization characteristic of porphyry systems in general (e.g., Li, Chen, et al., 2012; Wang, Zhang, Liu, et al., 2018; Zhang et al., 2018).
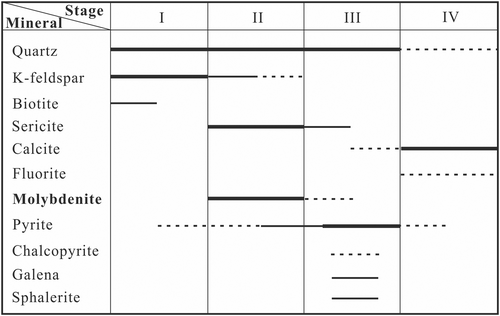
Based on the above cross-cutting relationships and mineral assemblages, the paragenetic sequence of the Yuku Mo deposit is summarized in Figure 7.
4 SAMPLING AND ANALYTICAL METHODS
4.1 Microthermometry
FIs in different stages quartz and calcite from multiple drill cores (ZK0301, ZK0305, and ZK0307) were selected for microthermometry and laser Raman spectroscopic analyses. In this paper, a total of 28 doubly polished thin sections were performed above experiments. FI microthermometry was carried out using a Linkam THMSG600 Heating-Freezing stage combined with a Zeiss microscopy with a temperature range of −195 to +600°C, at the Institute of Mineral Resources of the Chinese Academy of Geological Sciences, Beijing. Selected FIs were performed freezing measurements to −150°C and then heated gradually to total homogenization. Heating/freezing rates were restricted to <15°C/min and 1–0.1°C/min near phase transformations. Salinities of aqueous (NaCl−H2O) inclusions were calculated using the final melting temperatures of ice (Bodnar, 1993). Salinities of halite-bearing (hypersaline) inclusions were calculated using the method outlined by Hall, Sterner, and Bodnar (1988), while the salinities of CO2-bearing inclusions were calculated using the melting temperatures of clathrate (Collins, 1979). The salinities of inclusions that host non-melting opaque or transparent daughter minerals upon heating were calculated according to aqueous (NaCl−H2O) or CO2-bearing inclusions.
4.2 Laser Raman spectroscopy
The compositions of single FI were conducted using an RM-2000 laser Raman probe, at the Institute of Mineral Resources of the Chinese Academy of Geological Sciences, Beijing. The Ar+ laser wavelength was 514.5 nm, the laser power was 40 mW, the diameter of the laser beam spot was 2 μm, and the spectrometer resolution was 1 cm−1.
4.3 H–O Isotopes
Seven quartz samples from Stages I to III veins were performed oxygen and hydrogen isotopic analyses by the MAT 253EM mass spectrometer at the Beijing Kuangyan Geoanalysis Laboratory, China. Hydrogen isotope ratios of decrepitated quartz-hosted FIs were measured by mechanically crushing quartz grains of approximately 5 g and 1 mm in size, according to the method described by Simon (2001). Oxygen was drawn from quartz using BrF5 (Clayton & Mayeda, 1963) and was converted into CO2 on a platinum-coated carbon rod. The V-SMOW standards are used to standardize the results, and the analytical precision levels are ±0.2‰ for δ18O and ±2.0‰ for δD.
5 RESULTS
5.1 Fluid inclusions
5.1.1 Type and distribution
Numerous isolated FIs and random groups within the quartz and calcite crystals are considered as being primary or pseudosecondary in origin, whereas those located in micro-fractures or trails cross-cutting the boundaries of host minerals are recognized as secondary (Lu et al., 2004; Roedder, 1984). Four types of primary FIs were recognized in quartz and calcite based on phase relationships, transitions, and vapour–liquid constituents: two-phase liquid-rich inclusions (L-type), two-phase vapour-rich inclusions (V-type), halite-bearing (hypersaline) inclusions (H-type), and CO2-bearing inclusions (C-type).
L-type: liquid-rich FIs are common in all stages and are typically composed of coexisting liquid (LH2O) and vapour (VH2O) at room temperature (21°C), with the vapour bubbles comprising 20–50 vol% (Figure 8a,b). L-type inclusions comprise 50–70% of all inclusions and range from 5 to 30 μm in size and vary from flat to rounded, to elongate, and irregular in shape (Figure 8c–g).
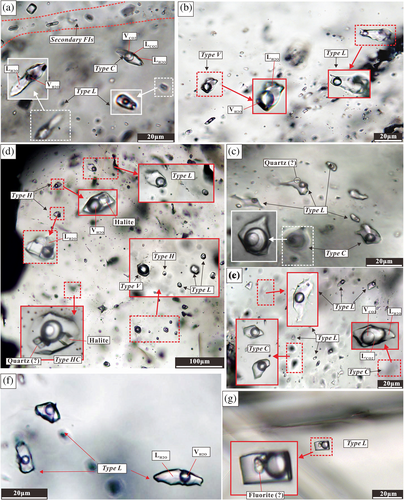
V-type: This FI normally contains a dark vapour (>50 vol%) at room temperature (Figure 8b), have rounded or negative crystal shapes, are 3–15 μm in size, and represent 10–20% of the total number of inclusions. V-type inclusions mainly coexist with L-type (Figure 8b) and H-type inclusions in Stages I–II (Figure 8d).
C-type: C-type FIs are predominately present as three-phase (VCO2 + LCO2 + LH2O) and minor two-phase (VCO2 + LH2O) inclusions (Figure 8c,e). The C-type inclusions represent 15–25% of all inclusions, range from 5 to 30 μm in size, and are flat to irregular in shape. Most occur in Stage I, with minor C-type inclusions detected in Stage II.
H-type: Hypersaline FI contains a liquid-rich bubble (10–30 vol%) and a halite mineral, occupying 10–20% of total inclusions (Figure 8d). H-type inclusions are flat, elongate, or irregular in shape and range from 5 to 20 μm in size. In addition, a rare CO2-bearing hypersaline inclusion was also detected (Figure 8d), which includes a halite mineral and a CO2-rich bubble, here defined as an HC-type inclusion. The abundance of these hypersaline inclusions is far less than L-, V-, and C-type inclusions, and they occur mainly in Stage II.
5.1.2 Laser Raman spectroscopy
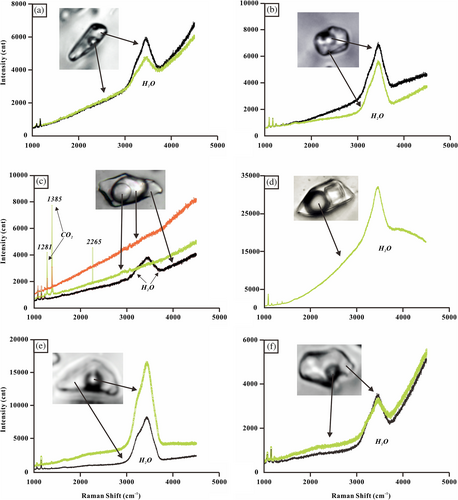
To constrain the vapour- and liquid-phase compositions of the mineralizing fluids, the representative FIs in the Yuku were selected for the Raman spectroscopic analyses. The results of individual FIs in quartz veins from different stages are shown in Figure 9. The gaseous and liquid phases in L-type FIs from the quartz–K-feldspar–biotite veins (Stage I) are mainly composed of H2O (3,439 cm−1; Figure 9a), and type L inclusions in the quartz–molybdenite veins (Stage II) have similar vapour- and liquid-phase compositions, dominated by H2O (Figure 9b). The gas phases of type-C inclusions from Stage II veins are composed of CO2 dominated (1,281 and 1,385 cm−1), with an unknown gaseous composition or cosmic ray, and the liquid is dominated by H2O and/or CO2 (Figure 9c). The H-type FIs from Stage II have a similar gaseous composition with that of L-type FIs (Figure 9d). The vapor and liquid phase compositions of type L inclusions in stages III and IV are only detected H2O without CO2 or other gaseous phases (Figure 9e,f).
5.1.3 Microthermometry
The microthermometric results of diverse FIs are fixed in Table 1 and Figure 10, which clearly show the linkage between mineral assemblages, physicochemical conditions, and metallogenic stages.
| Stage | Typea | Host mineral | Tm, ice (°C)b | Tm, CO2 (°C)c | Tm, cla (°C)d | Th, CO2 (°C)e | Tm, halite (°C)f | Th, total (°C)g | Salinity (wt%) |
|---|---|---|---|---|---|---|---|---|---|
| I | L | Quartz | −9.3 to −3.0 | 392–533 | 4.96–13.18 | ||||
| V | −1.5 to −0.3 | 501 to >550 | 0.53–2.57 | ||||||
| C | −62.5 to −56.9 | 4.5–9.4 | 24.7–30.9 | 375–447 | 1.22–9.71 | ||||
| II | L | Quartz | −15.7 to −2.4 | 297–400 | 4.03–19.21 | ||||
| V | −1.3 to −0.2 | 317–361 | 0.35–2.24 | ||||||
| C | −63.6 to −58.1 | 4.6–7.6 | 24.3–30.8 | 326–365 | 4.62–9.56 | ||||
| H | 241–326 | 309–353 | 34.13–40.23 | ||||||
| HC | 294–307 | 309–332 | 37.71–38.72 | ||||||
| III | L | Quartz | −8.1 to −3.1 | 198–298 | 5.11–11.81 | ||||
| H | 223 | 228 | 33.09 | ||||||
| C | −59.7 to −56.1 | 6.1–6.7 | 27.2–28.5 | 224–275 | 6.20–7.21 | ||||
| IV | L | Quartz | −6.4 to −3.5 | 158–188 | 5.71–9.73 | ||||
| Calcite | −6.2 to −4.4 | 149–175 | 7.17–9.47 |
- a Fluid inclusion type: L, liquid rich; V, vapour rich; H, halite bearing; HC═CO2 and halite bearing; C═CO2 bearing.
- b Tm, ice: Final ice melting temperature.
- c Tm, CO2: Final solid CO2 melting temperature.
- d Tm, cla: Final CO2 clathrate dissociation temperature.
- e Th, CO2: CO2 phase homogenization temperature.
- f Tm, halite: Halite dissociation temperature.
- g Th, total: Total homogenization temperature.
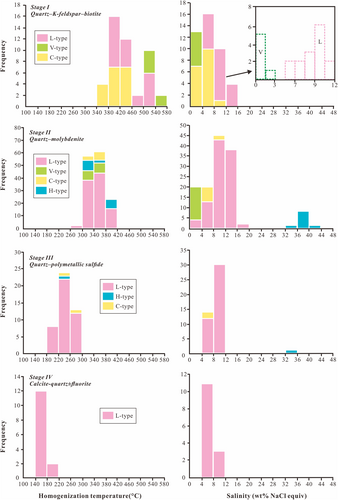
During the early barren quartz–K-feldspar–biotite Stage (I), FIs are dominated by L-type (>70%), followed by C- and minor V-type inclusions. L-type inclusions in this stage have homogenization temperatures of 392–533°C and final ice melting temperatures of −9.3 to −3.0°C, corresponding to salinities of 4.96–13.18 wt% NaCl equivalent (equiv.). Coexisting V-type inclusions record 501 to >550°C homogenization temperatures, with final ice melting temperatures varying from −1.5 to −0.3°C, corresponding to salinities of 0.53–2.57 wt% NaCl equiv. Homogenization temperatures of C-type FIs range from 411 to 447°C, with melting temperatures of solid CO2 varying from −62.5 to −56.9°C. The temperatures of clathrate melting are 4.5–9.4°C, with corresponding salinities of 1.22–9.71 wt% NaCl equiv (Table 1).
In the quartz–molybdenite ± pyrite Stage (II), the quartz veins contain all types of FIs. The liquid-rich L-type FIs have final ice melting temperatures between −15.7 and −2.4°C, indicating salinities of 4.03–19.21 wt% NaCl equiv., and are homogenized to a liquid phase at temperatures of 297–400°C. The V-type inclusions are homogenized to a vapour phase at temperatures of 317–361°C, with ice melting temperatures between −1.3 and −0.2°C, reflecting salinities ranging from 0.35 to 2.24 wt% NaCl equiv. Coexisting H-type inclusions homogenize to a liquid phase following disappearance of the bubble (after halite melting) at temperatures of 309–353°C, with halite dissolution occurring at 241–326°C, corresponding to salinities of 34.13–40.27 wt% NaCl equiv. Of these hypersaline FIs, four HC-type FIs have homogenization temperatures of 309–332°C, with halite melting temperatures of 294–307°C. Although the clathrate melting temperature can be measured owing to the existence of CO2 in the HC-type inclusions, salinities in this type of FI were determined by halite dissolution (Chen & Wang, 2011; Li et al., 2014), indicating salinities of 37.70–38.71 wt% NaCl equiv. The C-type FIs yield melting temperatures of solid CO2 ranging from −63.6 to −58.1°C, clathrate melting temperatures of 4.6–7.6°C, carbonic-phase homogenization temperatures of 24.3–30.8°C, and final homogenization temperatures between 326 and 365°C, with corresponding salinities of 4.62–9.56 wt% NaCl equiv (Table 1).
In the quartz–polymetallic sulphide Stage (III), the quartz veins contain predominantly L-type and rare H- and C-type inclusions. The L-type FIs yield homogenization temperatures of 198–298°C and final ice-melting temperatures of −8.1 to −3.1°C that indicate salinities of 5.11–11.81 wt% NaCl equiv. Stage III contains one H-type FI, in which the vapour bubble disappeared at a temperature of 223°C; the halite crystal dissolved at a temperature of 228°C, corresponding to a salinity of 33.09 wt% NaCl equiv. Two C-type FIs have homogenization temperatures of 224–275°C, solid CO2 melting temperatures ranging from −59.7 to −56.1°C, and clathrate melting temperatures varying from 6.1 to 6.7°C, corresponding to salinities of 6.20–7.21 wt% NaCl equiv (Table 1).
In the late barren calcite ± quartz ± fluorite Stage (IV), L-type FIs are dominant. The homogenization temperatures and final ice melting temperature of L-type FIs are 158–188°C and −6.4 to −3.5°C in quartz and 149–175°C and −6.2 to −4.4°C in calcite, corresponding to salinities from 5.71 to 9.73 and from 7.17 to 9.47 wt% NaCl equiv., respectively (Table 1).
5.2 Isotopes
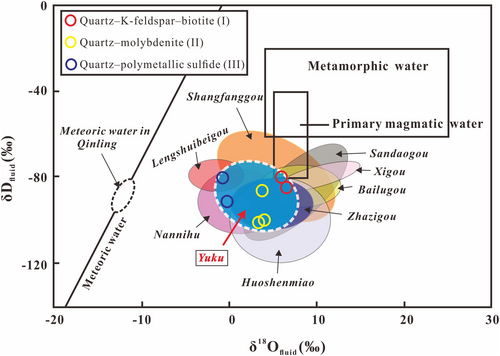
Oxygen and hydrogen isotopic results and re-calculated δ18Ofluid for seven quartz samples from different mineralization stages within the Yuku Mo deposit are fixed in Table 2 and Figure 11. Oxygen isotope data of water (δ18Ofluid) in equilibrium with quartz were calculated from the fractionation formula: 1000lnαquartz-water = (3.38 × 10⁶) × T2–3.40, reported by Clayton, O'Neil, and Mayeda (1972); T is the average homogenization temperature in the corresponding FIs. The δ18Ofluid and δDfluid values of Stage I veins are in the range from 6.0 to 6.6‰ and −84.4 to −79.5‰, respectively. In Stage-II veins, values of δ18Ofluid and δDfluid are 3.5–4.0‰ and −85.7‰ to −100.8‰. The δ18Ofluid and δDfluid results in quartz veins of Stage III vary from −0.7 to −0.2‰ and from −79.9 to −89.5‰, respectively.
| Stage | Sample | Mineral | Th (°C) | δ18OSMOW (‰) | δ18Ofluid (‰) | δDSMOW (‰) |
|---|---|---|---|---|---|---|
| I | 0307-1 | Quartz | 451 | 9.6 | 6.6 | −84.4 |
| 0307-20 | 451 | 9.0 | 6.0 | −79.5 | ||
| II | 0307-10 | 347 | 8.9 | 3.5 | −100.8 | |
| 0307-19 | 347 | 9.2 | 3.8 | −85.7 | ||
| 0307-28 | 347 | 9.4 | 4.0 | −99.5 | ||
| III | 0307-2 | 244 | 9.0 | −0.2 | −89.5 | |
| 0307-14 | 244 | 8.5 | −0.7 | −79.9 |
6 DISCUSSION
6.1 Source(s) of the ore-forming fluids
The H–O isotopes are commonly used to shed light on the source(s) of the mineralizing fluids (e.g., Cao et al., 2012; Shu & Liu, 2019; Wang, Wang, Xue, Liu, & Zhang, 2020; Zhang et al., 2016; Zheng & Liu, 2019). The quartz samples from the early barren quartz–K-feldspar–biotite±pyrite veins (Stage I) have relatively high and narrow variations in δ18Ofluid (6.0–6.6‰; Figure 11 and Table 2) and δDfluid (−84.4 to −79.5‰), which are similar to those of many porphyry deposits worldwide (e.g., Harris, Golding, & White, 2005; Seedorff & Einaudi, 2004a, 2004b; Wang, Zhang, & Li, 2017; Wang, Zhang, Liu, et al., 2018; Wang, Zhang, Liu, & Que, 2016; Zhang et al., 2016, 2018), representing a magmatic origin (Cooke, Deyell, Waters, Gonzales, & Zaw, 2011; Taylor, 1974; Taylor & Sheppard, 1986). The quartz–molybdenite±pyrite veins (Stage II) show slightly decreasing δ18Ofluid (3.5–4.0‰; Table 2) and lower δDfluid (−85.7 to −100.8‰) values than those of Stage I (Figure 11). Although these data are plotted between the magmatic and the meteoric fluid fields, H–O isotopic results are more close to the former, indicating that the ore-forming fluids in Stage II were still dominated by magmatic fluids. δDfluid in the Stage II quartz is low, which is probably attributed to the result of magmatic degassing (e.g., Hedenquist & Richards, 1998; Meinert, Hedenquist, Satoh, & Matsuhisa, 2003; Qiu et al., 2017; Zhang et al., 2018). The δ18Ofluid (−0.2 to −0.7‰; Table 2) and δDfluid (−79.9 to −89.5‰) isotopic compositions in the quartz polymetallic sulphide veins (Stage III) are significantly depleted than those from Stages I and II quartz, and these values are fixed at the middle location between the magmatic and the meteoric fluid lines, illustrating more involvement of meteoric water in this stage. The trend in H−O isotopic variations in the Yuku is consistent with other magmatic-hydrothermal deposits in the Luanchuan ore district, further implying that initial ore-forming fluids are a magmatic source, and more meteoric water was probably inputted during the late hydrothermal stages (Figure 11; Cao et al., 2015). Similar evolutionary progress of H–O isotopic compositions was reported within typical porphyry Mo deposits in the East Qinling–Dabie orogen (e.g., the Nannihu, Xiang et al., 2012; the Leimengou, Chen, Ye, & Wang, 2014; the Shapinggou, Ni et al., 2015; the Donggou, Yang et al., 2015) and worldwide (e.g., the Climax, Stein & Hannah, 1985; the Henderson, Seedorff & Einaudi, 2004a, 2004b; the Donggebi, Wang, Zhang, Liu, et al., 2018; the Wulandele, Zhang et al., 2018).
6.2 Evolution of the ore-forming fluids
Various types of FIs are present in the hydrothermal quartz veins that characterize the different stages of mineralization and provide insights into the evolution of the fluid system in the Yuku Mo deposit (Figure 12; Chen et al., 2017; Klemm et al., 2008; Roedder, 1984; Wang, Zhang, Liu, et al., 2018).
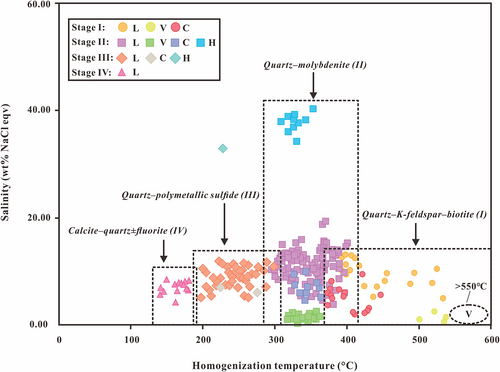
The mineralizing fluids in the quartz–K-feldspar–biotite Stage (I) are CO2 rich and characterized by low to intermediate salinities (0.53–13.18 wt% NaCl equiv.) and high homogenization temperatures of 392 to >550°C, similar to those in typical porphyry systems (e.g., Klemm, Pettke, Heinrich, & Campos, 2007; Seo, Guillong, & Heinrich, 2012; Wang, Zhang, Liu, et al., 2018; Zhang et al., 2018). Extremely limited sulphide contents imply relatively oxidizing conditions during this stage; the Yuku intrusion formed under a high oxygen fugacity (Du et al., 2019; Yang et al., 2020), supporting this inference. These originally intermediate salinity and density fluids were considered to have exsolved from the crystallizing magma at shallow levels in the Earth's crust (Meinert et al., 2003; Shu, Lai, Sun, Wang, & Meng, 2013; Wang, Zhang, Liu, et al., 2018). Coexisting lower salinity V-type inclusions (0.53–2.57 wt% NaCl equiv.) and higher salinity L-type inclusions (4.96–13.18 wt% NaCl equiv.; Table 1 and Figure 10) both formed at relatively high temperatures, indicating that they represent the products of initial fluid boiling (fluid phase separation) during Stage I (Meinert, Hefton, Mayes, & Tasiran, 1997; Soloviev et al., 2019; Wang et al., 2020; Wang, Zhang, Liu, et al., 2018; Zhu, Hu, Richards, Bi, & Zhong, 2015). As a consequence, the trapping pressure can be estimated via the temperature and salinity, based on the isobar equations from Driesner and Heinrich (2007). The results show that these FIs could have formed at pressures of 550–700 bar (Figure 13a), corresponding to lithostatic depths between 2.3 and 2.8 km. Thus, the exsolved initial (supercritical) magmatic fluids ascended from depths of 2.3–2.8 km and intersected the two-phase surface, resulting in fluid boiling that generated low-salinity vapour (V-type) and moderate-salinity liquid (L-type) FI assemblages (path 1 in Figure 14). Moreover, these early hydrothermal fluids could have filtered through and/or interacted with crystallizing porphyry rocks and surrounding host rocks, resulting in widespread potassic alteration to form K-feldspar, biotite, and quartz and the early barren quartz–K-feldspar–biotite ± pyrite veins (Figure 6a; Li, Chen, et al., 2012; Shi et al., 2019; Zhang et al., 2018).
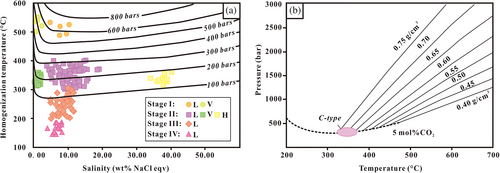
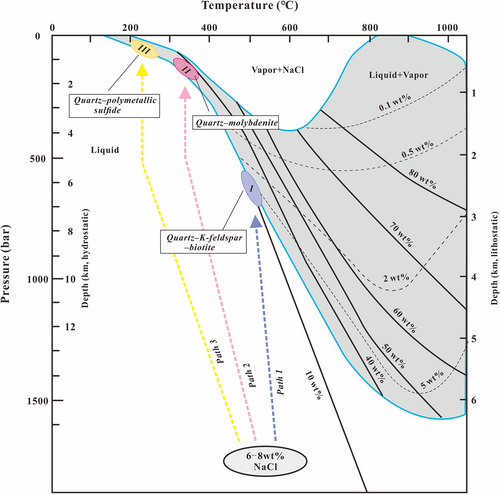
In the quartz–molybdenite Stage (II), FIs record cooler temperatures (297–400°C) and higher salinities (0.35–40.23 wt% NaCl equiv.) but are also inferred to have evolved through the exsolution of magmatic fluids, based on the H–O isotopic data (Figure 11; Sun et al., 2017). The absence of concurrent dikes and/or an overall lower fluid flux as the parent magma approached the final stages of crystallization (Meinert et al., 1997, 2003; Shinohara & Hedenquist, 1997), suggests the fluids cooled sufficiently and never intersected the solvus, which differs from the evolutionary path of Stage-I fluids (Meinert et al., 2003; Shu et al., 2013; Zhu et al., 2015). With the temperature decreasing continuously below 400°C, the system would have transformed from a lithostatic to a hydrostatic regime (Fournier, 1999), yielding a rapid drop in fluid pressure. Subsequently, the exsolved supercritical fluids intersected the two-phase surface and its solvus, leading to fluid boiling. Coexisting H-type (including HC-type) and V-type inclusions are developed in Stage II quartz (Figure 8d) and yield similar homogenization temperatures (309–360°C) but contrasting salinities (Table 1), supporting the occurrence of fluid boiling (Table 1 and Figure 10; Lu et al., 2004; Roedder & Bodnar, 1980). The trapping pressure of the Stage II fluids is estimated between 100 and 200 bar (Figure 13a), corresponding to a hydrostatic depth of 1.0–2.0 km (path 2 in Figure 14). However, the mineralizing fluids in Stage II also contained CO2 that was generally sourced from deep-seated and/or mafic magma (Baker & Lang, 2002; Lowenstern, 2001; Soloviev & Kryazhev, 2019). Additional CO2 in the fluids would have increased the trapping pressure (Bowers & Helgeson, 1983; Joyce & Holloway, 1993; Peng et al., 2016; Wang, Zhang, Liu, et al., 2018). According to the studies of Gehrig et al. (1986) and Rusk, Reed, and Dilles (2008), the addition of 5 mol% CO2 to a 4 wt% NaCl equiv. fluid would increase the pressure by ~100 bar at 600°C. The trapping pressure, therefore, should be <300 bar, consistent with the calculated pressure of C-type inclusions in Stage II, which is <500 bar on the basis of calculated isodense (Figure 13b).
In the quartz–polymetallic sulphide Stage (III), mineralization is associated with phyllic and propylitic alteration. Although the fluids involving polymetallic (Pb–Zn ± Cu) sulphide mineralization were regarded as having a magmatic origin (e.g., Harris & Golding, 2002; Soloviev & Kryazhev, 2018), an increased volume of meteoric water fed into the ore-forming system based on the H–O isotopic data from the Yuku deposit (Figure 11). Thus, the Stage III FIs reflect cooler (198–298°C) and less saline (5.11–11.81 wt% NaCl equiv.) mineralizing fluids. The metal and CO2 contents of the hydrothermal system were significantly reduced, given the scarcity or absence of molybdenite and C-type inclusions in this stage. Considering the absence of boiling assemblages and the dominance of L-type FIs in Stage III, the trapping pressure cannot be constrained, although minimum trapping pressures are estimated as being between 150 and <100 bar (Figure 13a), corresponding to a depth of <1.0 km in a hydrostatic system (path 3 in Figure 14).
In the calcite ± quartz ± fluorite Stage (IV), carbonatization is a typical post-ore signature in porphyry deposits (e.g., Li, Ulrich, et al., 2012; Ni et al., 2015; Wang, Zhang, Liu, et al., 2018; Zhang et al., 2016, 2018, 2019). L-type inclusions dominate fluids that have lower homogenization temperatures (149–188°C) and salinities (5.71–9.73 wt% NaCl equiv.; Table 1 and Figure 10).
6.3 Mechanisms of ore precipitation
The speciation of molybdenum in hydrothermal fluids has generally been considered as the Mo6+ state, including H2MoO4, KHMoO4, NaHMoO40, and their dissociation products HMoO4− and MoO42− (e.g., Minubayeva & Seward, 2010; Shang et al., 2020; Ulrich & Mavrogenes, 2008). The formation of molybdenite (MoS2) requires abundant Mo4+ in mineralizing fluids. Several physicochemical factors (T, fO2, acidity, and salinity) can change molybdenum speciation via multiple processes, including cooling, mixing (with meteoric waters), fluid–rock interactions, and boiling (immiscibility; e.g., Cao et al., 2017; Li, Ulrich, et al., 2012; Ni et al., 2015, 2017; Rempel, Williams-Jones, & Migdisov, 2009; Seo et al., 2012; Wang, Zhang, Liu, et al., 2018).
A decrease in temperature can affect Mo precipitation. Cooling results in a dramatic decrease in molybdenite solubility in the Questa porphyry Mo deposit (Klemm et al., 2008; Ulrich & Mavrogenes, 2008). However, both HMoO4− and NaHMoO40 are the dominant molybdenum species in NaCl-bearing aqueous solutions at elevated temperatures (250–350°C; Shang et al., 2020). Our microthermometric results show the temperature of molybdenite formation was 309–360°C, suggesting a simple decrease in temperature cannot have destabilized Mo6+ complexes to form Mo4+ in the Yuku porphyry Mo deposit.
The incursion of meteoric fluid can lead to a drop in both temperature and salinity, reducing Mo solubility, and such a process is considered to play a key role in Mo mineralization (Li et al., 2019; Shu & Lai, 2017). However, the H–O isotopic data (Figure 11) indicate that the ore-forming fluids in Stage II were dominated by magmatic fluids. Thus, mixing with meteoric water might have had little influence on the ore-forming process in the Yuku deposit, a conclusion that has been reached in other porphyry Mo deposits (e.g., Ni et al., 2015, 2017).
Intracontinental magmatic–hydrothermal systems are formed by fluids with elevated K/Na ratios (Chen et al., 2017; Yang et al., 2013, 2015). Ubiquitous and intensive potassic alteration in Stage I is indicative of K-rich fluids, in which the relatively low salinities (0.53–13.18 wt% NaCl equiv.) indicate that KHMoO4 might have been the major speciation state of molybdenum in the fluids. These fluids belong to the H2O–NaCl–CO2 system and are oxidizing, CO2-rich, and S2−-poor, which is consistent with the lack of sulphide minerals. Therefore, the Stage-I fluids were unfavourable for molybdenite formation (e.g., Wang, Zhang, Liu, et al., 2018; Zhang et al., 2018). However, potassic alteration consumes heat energy, alkali ions, and OH− (2 K+ + 2[OH] − = K2O + H2O; Zhang et al., 2016), such that the Stage-II fluids evolved to become more reduced and acidic with the increased activities of H+ and S2− (e.g., Li, Chen, et al., 2012; Ulrich & Mavrogenes, 2008; Wang, Zhang, Liu, et al., 2018), further destabilizing Mo complexes (e.g., KHMoO4) to cause large-scale precipitation of molybdenite (MoS2) (HMoO4− + H+ + H2 + 2H2S → MoS2 + 4H2O; Zhang et al., 2016). In addition, fluid boiling during Stage II generated distinct salinity variations (0.35–40.23 wt% NaCl equiv.). This process is an important mechanism for Mo enrichment (Audétat, Pettke, Heinrich, & Bodnar, 2008; Zajacz, Halter, Pettke, & Guillong, 2008), during which Mo preferentially enters the brine phase (Heinrich, Günther, Audétat, Ulrich, & Frischknecht, 1999; Williams-Jones & Heinrich, 2005). Shang et al. (2020) argued that the transport of Mo in hydrothermal fluids is strongly dependent on salinity. Ni et al. (2015, 2017) proposed that intense fluid boiling can result in a substantial change in the salinity of the mineralizing fluids, destabilizing Mo6+ complexes and leading to rapid precipitation of molybdenite. Thus, variations in salinity during Stage II could have controlled the precipitation of molybdenite.
Previous studies have revealed that the valency state of Mo (Mo6+ or Mo4+) is extremely sensitive to redox conditions (Bali, Keppler, & Audétat, 2012; Linnen & Williams-Jones, 1990; Rempel et al., 2009). A decrease of fO2 in ore-forming fluids is conducive to the transformation of Mo4+ and S2−, undoubtedly promoting the formation of molybdenite. Boiling during Stage II is a critical process that caused the escape of CO2 from fluids, as indicated by the decrease in abundance of C-type FIs (Figure 10). CO2 escape increased the activity of S2− in the fluids, leading to the reduction and destabilization of Mo6+ complexes to form molybdenite (e.g., Li, Ulrich, et al., 2012; Yang, Li, & Chen, 2012). Another process is the increase of acidity driven by potassic alteration, which also facilitated CO2 escape (H+ + HCO3− = H2O + CO2; Yang et al., 2015; Wang, Zhang, Liu, et al., 2018). The importance of CO2 immiscibility (boiling) in Mo precipitation has been discussed in previous studies. Li, Ulrich, et al. (2012) stated that the C-type inclusions contain detectable Mo contents and that decreasing CO2 contents result in decreasing Mo concentrations to precipitate molybdenite in the Yuchiling deposit. Yang et al. (2012, 2013, 2015) considered that the escape of CO2 can lead to a decrease in fO2, forming molybdenite. Li, Shao, Li, and Luo (2017) found that CO2 escaping due to immiscibility in the fluids facilitated the deposition of molybdenite in the Yaochong deposit. Sun et al. (2017) also stated that Mo precipitation would likely reflect CO2 immiscibility in the Baituyingzi deposit and inferred that CO2 could have formed important Mo complexes in the H2O–NaCl–CO2 system.
The above observations indicate that fluid boiling and fluid–rock interactions (intensive potassic alteration) are major processes in controlling the deposition of molybdenite in the Yuku Mo deposit, which would have changed the salinity and triggered CO2 escape, which decreased the fO2 and increased the acidity of the ore-forming fluids.
6.4 Genetic model
Numerous geochronological data have identified three periods of Late Triassic to Middle Cretaceous Mo mineralization in the East Qinling orogen (Li et al., 2013; Mao et al., 2008; Stein, Markey, Morgan, Du, & Sun, 1997; Wang et al., 2019). Molybdenite Re–Os geochronology in the Yuku deposit yields isochron ages of 147–144 Ma (Li et al., 2015), indicating that Mo mineralization was caused by the subduction of the Palaeo-Pacific Plate beneath the Eurasian continent (Mao et al., 2011). This subduction formed a Late Mesozoic tectonic regime characterized by a transition from post-collisional compression to extension (Li, Chen, Santosh, & Pirajno, 2018; Tang et al., 2019; Yang et al., 2019; Yang, Santosh, & Kim, 2018). Following slab break-off, asthenospheric upwelling triggered melting of the lower crust in the East Qinling orogen, which generated voluminous silicic magmatism (Mao et al., 2008). Extensive Mo-bearing magmatic–hydrothermal fluids exsolved from these magmas. An integrated genetic model for the Yuku deposit is shown in Figure 15.
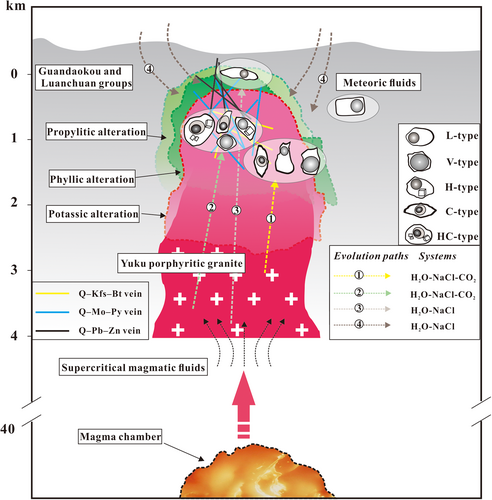
The released ore-forming fluids were characterized by high temperatures and pressures, medium to low salinities, and were K and CO2 rich, and relatively oxidizing. Such fluids reacted with the upper portions of the Yuku porphyritic granite, generating widespread potassic alteration and early barren quartz veins or stockworks. On further crystallization of the Yuku intrusion, the Stage-II fluids were released. As the temperature decreased below 400°C, the system transformed from a lithostatic to a hydrostatic regime, causing a rapid pressure drop that triggered fluid boiling. These processes led to significant variations in the salinity, fO2, and acidity of the fluids that destabilized Mo complexes, leading to molybdenite precipitation. The exsolved Stage-III fluids involved more meteoric fluids and thus were cooler and more dilute and related to Pb–Zn mineralization in the Yuku deposit. During Stage IV, the hydrothermal fluids were an open system, in which meteoric fluids were dominant, which is consistent with the lowest temperatures and salinities. These fluids were associated with the rapid precipitation of calcite, quartz, and fluorite, representing the termination of hydrothermal activity in the Yuku deposit.
7 CONCLUSIONS
- Quartz–K-feldspar–biotite stage: the coexistence of vapour-rich (V-type) and liquid-rich (L-type) FIs in Stage-I quartz indicates the occurrence of fluid boiling at 488–550°C and lithostatic depths of 2.3–2.8 km (550–700 bar).
- Quartz–molybdenite stage: coexistence of hypersaline (H-type) and low-salinity vapour (V-type) inclusions in Stage II quartz suggests fluid boiling developed at 309–361°C and hydrostatic depths of 1.0–2.0 km (100–200 bar).
- Quartz–polymetallic sulphide stage: Stage-III FIs reflect cooler (198–298°C) and more dilute (5.11–11.81 wt% NaCl equiv.) fluid conditions. The minimum trapping pressures are estimated between 150 and < 100 bar, corresponding to a depth of <1.0 km, assuming a hydrostatic pressure.
- Calcite ± quartz ± fluorite stage: this stage records a typical post-ore signature in porphyry deposits, in which the fluids have lower homogenization temperatures (149–188°C) and salinities (5.71–9.73 wt% NaCl equiv.) and were likely mostly of meteoric origin.
- Fluid boiling and fluid–rock interaction can change salinity and trigger CO2 escape, decreasing fO2 and increasing the acidity of ore-forming fluids. This process ultimately led to the development of molybdenite in the Yuku Mo deposit.
ACKNOWLEDGEMENTS
This research has been financially supported by the National Natural Science Foundation of China (Grant No. 41572318). The authors thank Xu Zheng, Xiaochao Shu, Kang Wang, Yuecheng Zhang, Shuo Zhang, and Weishi Chen for their kind helping during the FI microthermometric measurements and Raman spectroscopic analysis. The authors are very grateful to the editors and reviewers for constructive comments and improvement of the manuscript.
CONFLICT OF INTEREST
The authors declare there is no conflict of interest.
Open Research
DATA AVAILABILITY STATEMENT
Data available upon request.


