Eastern extension of the Solonker-Xar Moron-Changchun-Yanji Suture Zone: Constraints from thermochronology of sedimentary and mafic rocks in the Hunchun-Yanji area, Northeast China
Abstract
The Late Palaeozoic Solonker-Xar Moron-Changchun-Yanji Suture (SXCYS) is considered to mark the location of the final closure of the Paleo-Asian Ocean, which separated the North China Craton to the south and the amalgamated blocks to the north in Northeast China. There has always been controversy about its eastern extension in Northeast China and the final closure time of the Paleo-Asian Ocean. To explore this issue, we collected gabbro and quartz-diorite samples in the Hunchun area for the genesis of mafic magma and age dating, and five groups of Permian to Triassic sandstones belonging to both sides of the potential suture locations in the middle and east Jilin Province for the provenance analysis to discuss the final closure time of the Paleo-Asian Ocean and the possible positions of the eastward termination of the SXCYS. The gabbro reveals a Middle Permian concordia average age of 266.9 ± 5.2 Ma, and the quartz diorite reveals a Late Permian Concordia average age of 258.8 ± 4.8 Ma. Lithological and geochemical analysis reveal the two rock samples belong to low-K arc tholeiites from the oceanic island and calk-alkaline volcanics from the active continental margin, respectively, which implies that during the middle to late Permian, the SW margin of the Jiamusi–Khanka Block (JB) continuously experienced the subduction process from the Paleo-Asian Ocean Plate. The final closure time of the Paleo-Asian Ocean should be later than the Late Permian. Meanwhile, four groups of sandstone from the east Jilin reveal typically Jiamusi–Mongolia Block (JMB) provenance features, with age components of ~500 Ma, ~0.9–1.5 Ga implying that the Wangqing, Hunchun, Kaishantun area belongs to the northern part of the SXCYS from late Early Permian to Middle Triassic, with youngest age components of 288.2 ± 2.8, 275.5 ± 1.8, 250 ± 1.7, and 244.9 ± 1.7 Ma, respectively. The late Early Permian sandstone from the middle Jilin reveals the youngest age component of 273.8 ± 3.4 Ma and the age component of 487 ± 3 Ma also revealing JMB feature. Comparing to previous studies, we propose that the Paleo-Asian Ocean finally closed during Middle to Late Triassic. A possible ENE fault separates the eastern extension of SXCYS into two parts, which means the possible position of the eastward extension of the SXCYS should go along the Wangqing-Kaishantun with NNW direction in the west, Hunchun-Laoheishan with NW direction in the east.
1 INTRODUCTION
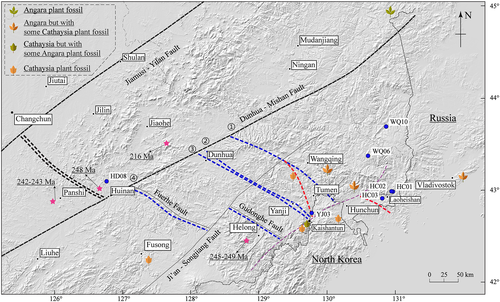
The Solonker-Xar Moron-Changchun-Yanji Suture (SXCYS), which is mainly located in South Mongolia, Inner Mongolia, and Jilin of China from west to east, was a major tectonic boundary in North Asia. It is believed to be the southern boundary between the Jiamusi–Mongolia Block (JMB) and the North China Craton (NCC) during the Late Palaeozoic to Early Mesozoic (Liu et al., 2017) and also represents the location where the Paleo-Asian Ocean finally closed. In the east part of the SXCYS, because of strong vegetation cover, evidence of this suture is rare. Outcrops are often scattered in this area and several NNE-trending strike-slip faults create strong offset (Figures 1, 2). The location of the eastern extension of the SXCYS is still controversial. Former researchers suggested four main possible suture zones (S.Z.): (a) Fuerhe–Gudonghe faults, which were discerned by their different tectonic evolution history (Bureau of Geology & Mineral Resources of Jilin Province, 1988; Zhao, Peng, Dang, Zhang, & Zhu, 1996); (b) Dunhua–Yanji S.Z., which was identified by sequence stratigraphy analysis (Zhang, 1997); (c) Dashanzui–Antu–Kaishantun S.Z., which was recognized by the evidence of the emplacement of syncollision granites and A-type granites (Jia et al., 2004); and (d) Wangqing–Hunchun S.Z., which was distinguished by the different plant-fossil material, between the Permian Cathaysia type and Angara type from each side (Chen et al., 2014; Li, Chen, Wang, Hou, & Liu, 2011; Sun, Li, Ge, Zhang, & Zhang, 2013).
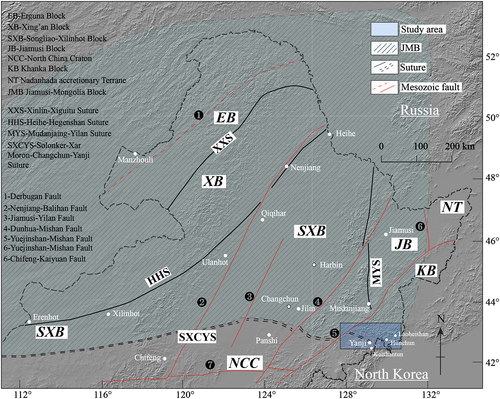
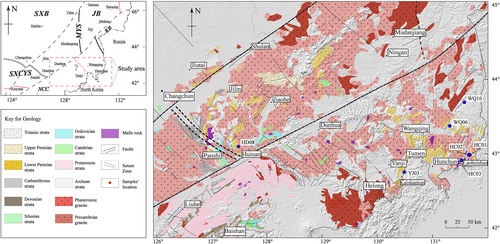
This manuscript mainly focuses on the eastward extension of the SXCYS in the Hunchun-Yanji area. Sedimentary provenance analysis refers to the reconstruction of source area geology, the type of source rock exposed and the processes that modify the sediment on their way from source to sink (Alván, von Eynatten, Dunkl, & Gerdes, 2015; Weltje & von Eynatten, 2004). As one of the most popular and efficient provenance analysis method, using detrital zircon U–Pb dating can help in determining a detrital provenance and in comparing the similarity among several groups of different sediment samples to try to discuss the possible suture zone. In this manuscript, five groups of sedimentary rock were collected and dated for detrital zircon U–Pb analysis from the Hunchun-Yanji area, with the comparison with former studies; they show a more detailed partition of the eastern extension of the SXCYS. The generation of magma is a concrete manifestation of the deep process of the lithosphere. The study of the thermochronology and geochemical characteristics of the mafic rock can reveal the tectonic environment during the occurrence of magma and further explore the deep process and evolution of the lithosphere where the possible suture zone is located. In this paper, two groups of gabbro and quartz diorite were collected from the Hunchun area (Figures 1 and 2). The geochronology and geochemistry analysis of these two groups of mafic rock, combining with stratigraphic data, we offer new evidence to constrain the final closure time of the Paleo-Asian Ocean and the position of an eastern continuation of the SXCYS.
2 GEOLOGICAL SETTING
Northeast China is located in the east part of Asia and also belongs to the eastern part of the Central Asia Orogenic Belt (CAOB), which is also named the Altaids (Sengör, Natal'In, & Burtman, 1993). The CAOB is the largest accretionary orogen and Phanerozoic juvenile crustal growth in the world (Jahn, Wu, & Chen, 2000; Kröner et al., 2007; Liu et al., 2017; Safonova et al., 2011; Windley, Alexeiev, Xiao, Kröner, & Badarch, 2007; Zonenshain, 1990). Inner Mongolia, Heilongjiang, and Jilin provinces in China and its adjacent area comprise the eastern segment of the CAOB, which is a key area for understanding the NE Asian tectonics and providing important evidence of the eastern CAOB evolution (Wang & Liu, 1981; Figure 1). According to the present view, from west to east, several microcontinents comprise the eastern segment of the CAOB, including the Jiamusi–Khanka Block (JB) which collided with the Songliao–Xilinhot Block (SXB) in the Early Palaeozoic, and the SXB Block collided with Xing'an Block (XB) after the Late Carboniferous. After late Early Carboniferous, the microblocks in Northeast China were gradually amalgamated together and became one united Jiamusi–Mongolia Block (JMB), and the SXCYS was believed to be the southern boundary between the JMB and the NCC during the Late Palaeozoic to Early Mesozoic (Liu et al., 2017). The eastern part of the SXCYS is mainly located in Jilin Province, China. It is the main Late Palaeozoic suture between the SXB in the west, the JB in the east with the North Margin of the NCC, and represents the final closure of the Paleo-Asian Ocean in this area (Liu et al., 2017; Figures 1 and 2). The central part of Jilin Province contains Permian to Triassic sediments including the following: the middle Permian Shoushangou Formation, Daheshen Formation, Fanjiatun Formation, the late Permian Yangjiagou Formation, and the early Triassic Lujiatun Formation (Figure 4). The Yanji area contains the early Permian Dasuangou Formation, middle Permian Sidonggou Formation, Guanmenzuizi Formation, Jiefangcun Formation, late Permian Kaishantun Formation, the early Triassic Kedao Formation, and the middle Triassic Luoquanzhan Formation (Figure 4). The Fanjiatun Formation occurs within the SXCYS Zone and is dominated by siltstone, sandstone, slate, and tuffaceous sandstone units. The Sidonggou Formation occurs in the north of the SXCYS and consists of siltstone and metamorphic quartz-sandstone units, and the Guanmenzuizi Formation also occurs in the north of the SXCYS and consists of siltstone, tuffaceous gritstone, and black slate units. The Kedao Formation occurs within the SXCYS and contains sandstone, siltstone, and tuffaceous sand units. Finally, the Luoquanzhan Formation occurs in the north of the SXCYS and consists of rhyolite breccia tuffaceous sand units (Figure 4). The stratigraphic division scheme in the study area involved the North China stratigraphic region, the Beijiang-Xing'an stratigraphic region, the Zhangguangcai-Wandashan stratigraphic region, and Khanka stratigraphic region (Bureau of Geology & Mineral Resources of Jilin Province, 1988). It experienced multistage orogenic effects of the Paleo-Asian Ocean tectonic domain and superimposed the reworking of the circum-Pacific tectonic domain. The geologic structure is extremely complicated. The late Palaeozoic to Cenozoic stratigraphic sequence in the Hunchun-Yanji area is controversial (Guo, Su, Chi, & Huang, 1992; Jia, Hu, Luo, & Qin, 2004; Sun, 1988; Sun et al., 2013; Tang, Yan, Zhang, & Qi, 1997). The late Carboniferous and Permian strata were considered as an ophiolite mélange, turbidity mélange, or accretion complex (Shao & Tang, 1995; Tang, Shao, Li, & Kang, 2004). While the recent studies gradually consider the late Carboniferous to Permian as a conformable succession stratum. The Lower Triassic unconformably overlies the Permian (Peng, Chen, Yin, & Li, 2005; Yin, Sun, Peng, Zhou, & Zhao, 2003; Zhou, 2009).
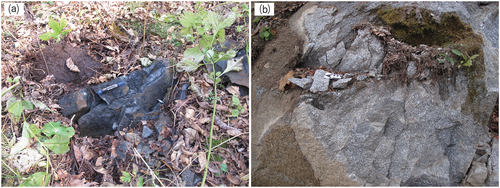
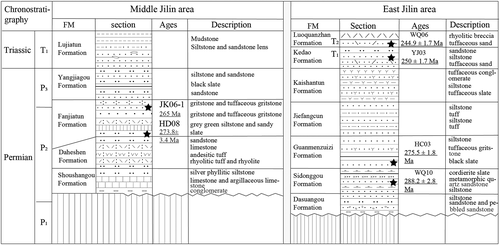
The samples for this study were collected from Hunchun, Wangqing, Yanji, Helong, and Huadian areas that crop out along the traditional SXCYS Zone from east to west including gabbro, quartz diorite, and sedimentary rocks. The locations of the samples are marked in Figures 1 and 2. In the Hunchun area, because of strong vegetation cover, outcrops are often scattered. The contact relationship between the gabbro and the quartz diorite is unclear (Figure 4), and the host rock of the gabbro and quartz-diorite samples in this paper is mainly the Late Permian granodiorite (Figure 2). Six groups of fresh, grey–black, coarse- to medium-grained gabbros were collected (coded HC01-1 to 6, GPS location, 43.0148417°N, 131.000115°E); four groups of fresh, greyish medium-grained quartz diorites (coded HC02-3, HC02-4, GPS location, 43.01715°N, 130.9780367°E); two groups of mafic microgranular enclave (MME; code HC02-1, HC02-2) quartz diorite were collected approximately 3 km west from the collection point at gabbro for geochemical dating. Approximately 5-kg gabbro (coded HC01) and quartz diorite (coded HC02) were used for LA-ICP-MS U–Pb dating, respectively. The sedimentary samples were collected from Wangqing (WQ06, sandstone, GPS location, 43.401805°N, 130.6294283°E; WQ10, sandstone, GPS location, 43.716525°N, 130.8982817°E), Hunchun (HC03, greywacke, GPS location, 42.9409183°N, 130.8415183°E), Yanji (YJ03, siltstone, 42.782085°N, 129.792305°E), and Huadian (HD08, sandstone, GPS location, 43.1259783°N, 126.7423517°E), respectively.
3 ANALYTICAL METHODS
Following the method of Osborne Hutton (1950) and Mange and Maurer (1992), the samples were crushed and sieved into <250 μm, dissolved the carbonate in 5% acetic acid, and then sorted the heavy minerals by using heavy-liquid separation and magnetic separation, respectively. After that, under the single polarizing microscope, zircons were picked out and mounted in epoxy resin, then grinded and diamond polished in five steps to decrease the zircons to 1 μm. In order to reveal these zircons internal structures, using a JEOL scanning electron microscope housed to obtain their cathodoluminescence images (CL images). CL images were obtained at the Beijing Geoanalysis Co. Ltd. Detailed experimental process is similar to those described by Song, Su, Li, Niu, and Zhang (2012). Laser ablation (LA)-ICP-MS zircon U–Pb geochronology dating for the collected samples were carried out at the Key laboratory of Mineral Resources Evaluation in Northeast Asia, Ministry of Land and Resources of China. The analytical data are presented on U–Pb concordia diagrams with 2σ errors. The mean ages are weighted means at 95% confidence levels (Ludwig, 2003). Single-grain zircon U–Pb age data is shown in Table S1. All the ages shown were selected by 206Pb/238U ages, which are smaller than 1.0 Ga and 207Pb/206Pb ages, which are bigger than 1.0 Ga, respectively. All the age diagrams are based on zircon ages within 90–110% concordance. The U–Pb concordia plots were calculated and plotted by TuffZirc algorithm (ISOPLOT software, Ludwig, 2003), and U–Pb kernel density plots and age components identification were plotted and identified by Density Plotter (Vermeesch, 2012).
Major element oxides of the pluton samples were determined by using the X-ray Fluorescence Spectroscopy (XRF) method at the ALS Chemex (Guangzhou) Co., Ltd. The analytical precision detecting limit is around 1–5%. Details of the analytical procedures were followed by Liu et al., 2008. The Inductively Coupled Plasma–Mass Spectroscopy (ICP– MS) is used to detect the trace elements ALS Chemex (Guangzhou) Co., Ltd. The detailed procedures for trace element analysis by ICP-MS were described by Li, 1997.
4 RESULTS
4.1 Major and trace elements
The major and trace elements geochemistry data of the Late Palaeozoic intrusive rocks from the Hunchun area are given in Table 1.
| Samples No. | Hunchun gabbro | MME from Hunchun quartz diorite | Hunchun quartz diorite | |||||||
|---|---|---|---|---|---|---|---|---|---|---|
| 15HC01–1 | 15HC01–2 | 15HC01–3 | 15HC01–4 | 15HC01–4 | 15HC01–4 | 15HC02–1 | 15HC02–2 | 15HC02–3 | 15HC02–4 | |
| SiO2 (wt.%) | 47.17 | 48.93 | 47.43 | 44.08 | 44.66 | 49.25 | 51.57 | 50.88 | 62.06 | 62.22 |
| TiO2 | 1.27 | 0.32 | 0.25 | 1.53 | 1.87 | 0.32 | 0.97 | 1.07 | 0.69 | 0.67 |
| Al2O3 | 15.71 | 16.05 | 17.80 | 17.33 | 18.49 | 16.21 | 19.76 | 17.50 | 17.31 | 17.25 |
| FeOt | 12.62 | 7.37 | 6.95 | 15.28 | 13.98 | 7.51 | 8.66 | 10.22 | 5.70 | 5.69 |
| FeO | 4.21 | 2.46 | 2.32 | 5.09 | 4.66 | 2.50 | 2.89 | 3.41 | 1.90 | 1.90 |
| Fe2O3 | 9.35 | 5.46 | 5.15 | 11.32 | 10.35 | 5.56 | 6.42 | 7.57 | 4.22 | 4.21 |
| MnO | 0.23 | 0.16 | 0.13 | 0.23 | 0.24 | 0.16 | 0.19 | 0.25 | 0.10 | 0.11 |
| MgO | 8.61 | 10.95 | 10.84 | 7.62 | 7.13 | 10.60 | 4.56 | 6.28 | 2.90 | 2.76 |
| CaO | 12.93 | 15.23 | 15.83 | 12.61 | 11.86 | 14.98 | 9.35 | 9.50 | 6.48 | 6.63 |
| Na2O | 1.13 | 0.81 | 0.66 | 1.15 | 1.52 | 0.80 | 4.24 | 3.50 | 3.54 | 3.61 |
| K2O | 0.31 | 0.16 | 0.11 | 0.11 | 0.24 | 0.16 | 0.58 | 0.66 | 1.10 | 0.91 |
| P2O5 | 0.02 | 0.01 | 0.01 | 0.04 | 0.02 | 0.01 | 0.12 | 0.13 | 0.13 | 0.14 |
| Mg# | 40.56 | 59.76 | 60.94 | 33.27 | 33.77 | 58.53 | 34.48 | 38.07 | 33.73 | 32.69 |
| Ba (ppm) | 38.50 | 23.60 | 28.70 | 30.20 | 39.30 | 23.80 | 84.00 | 136.00 | 281.00 | 256.00 |
| Rb | 4.40 | 3.70 | 2.40 | 1.90 | 3.40 | 4.00 | 9.10 | 14.00 | 29.10 | 23.30 |
| Th | 0.43 | 0.19 | 0.17 | 0.18 | 0.25 | 0.26 | 0.41 | 0.36 | 1.66 | 1.43 |
| U | 0.13 | 0.05 | 0.05 | 0.05 | 0.05 | 0.05 | 0.18 | 0.24 | 0.92 | 0.42 |
| Nb | 0.70 | 0.30 | 0.30 | 0.40 | 1.10 | 0.40 | 3.60 | 4.30 | 3.00 | 3.00 |
| Ta | 0.10 | 0.10 | 0.10 | 0.10 | 0.10 | 0.10 | 0.10 | 0.20 | 0.20 | 0.20 |
| La | 3.20 | 2.10 | 1.40 | 2.70 | 2.80 | 2.20 | 14.80 | 17.30 | 10.90 | 11.10 |
| Ce | 7.60 | 4.60 | 3.20 | 5.70 | 7.20 | 5.10 | 39.70 | 49.20 | 25.80 | 27.30 |
| Pr | 0.96 | 0.58 | 0.38 | 0.68 | 0.93 | 0.60 | 5.40 | 6.79 | 2.90 | 3.14 |
| Nd | 4.40 | 2.70 | 1.90 | 3.30 | 5.00 | 3.00 | 23.00 | 30.90 | 12.60 | 13.10 |
| Sm | 1.28 | 0.97 | 0.63 | 1.14 | 1.78 | 0.99 | 5.49 | 7.41 | 2.81 | 2.92 |
| Eu | 0.55 | 0.41 | 0.33 | 0.66 | 0.88 | 0.39 | 1.66 | 1.95 | 1.01 | 1.04 |
| Gd | 1.72 | 1.43 | 0.79 | 1.78 | 2.38 | 1.30 | 5.19 | 7.30 | 2.67 | 2.82 |
| Tb | 0.32 | 0.20 | 0.14 | 0.28 | 0.44 | 0.22 | 0.75 | 1.10 | 0.36 | 0.40 |
| Dy | 1.98 | 1.45 | 0.98 | 1.77 | 2.62 | 1.35 | 4.33 | 6.43 | 2.11 | 2.32 |
| Ho | 0.43 | 0.32 | 0.21 | 0.41 | 0.56 | 0.30 | 0.88 | 1.27 | 0.42 | 0.45 |
| Er | 1.26 | 0.85 | 0.58 | 1.17 | 1.65 | 0.89 | 2.42 | 3.72 | 1.15 | 1.29 |
| Tm | 0.18 | 0.12 | 0.09 | 0.17 | 0.24 | 0.13 | 0.34 | 0.52 | 0.16 | 0.18 |
| Yb | 1.17 | 0.79 | 0.62 | 1.03 | 1.52 | 0.88 | 2.15 | 3.42 | 1.05 | 1.15 |
| Lu | 0.18 | 0.12 | 0.10 | 0.16 | 0.23 | 0.14 | 0.33 | 0.49 | 0.17 | 0.19 |
| Y | 12.00 | 8.60 | 5.90 | 10.70 | 15.20 | 9.30 | 25.00 | 37.30 | 12.70 | 13.20 |
| Sr | 221.00 | 205.00 | 209.00 | 292.00 | 319.00 | 220.00 | 539.00 | 415.00 | 468.00 | 478.00 |
| Zr | 28.00 | 15.00 | 11.00 | 15.00 | 23.00 | 16.00 | 94.00 | 86.00 | 142.00 | 139.00 |
| Hf | 0.70 | 0.30 | 0.20 | 0.30 | 0.70 | 0.20 | 2.40 | 2.70 | 3.50 | 3.40 |
| Cr | 70.00 | 580.00 | 520.00 | 20.00 | 10.00 | 560.00 | 10.00 | 170.00 | 20.00 | 20.00 |
| Cs | 0.28 | 0.26 | 0.17 | 0.12 | 0.23 | 0.30 | 0.50 | 0.72 | 1.39 | 1.07 |
| Ga | 17.80 | 11.60 | 11.80 | 19.50 | 19.70 | 11.20 | 24.50 | 24.00 | 21.10 | 20.60 |
| Sn | 1.00 | 1.00 | 1.00 | 1.00 | 1.00 | 1.00 | 2.00 | 3.00 | 1.00 | 1.00 |
| V | 551.00 | 207.00 | 170.00 | 623.00 | 529.00 | 197.00 | 224.00 | 260.00 | 132.00 | 129.00 |
| W | 1.00 | 3.00 | 1.00 | 1.00 | 1.00 | 5.00 | 1.00 | 1.00 | 1.00 | 1.00 |
| Eu/Eu* | 1.13 | 1.06 | 1.43 | 1.42 | 1.31 | 1.05 | 0.95 | 0.81 | 1.13 | 1.11 |
| LaN/YbN | 1.84 | 1.79 | 1.52 | 1.77 | 1.24 | 1.69 | 4.64 | 3.41 | 7.00 | 6.51 |
| Sum_REE | 25.23 | 16.64 | 11.35 | 20.95 | 28.23 | 17.49 | 106.44 | 137.80 | 64.11 | 67.40 |
4.1.1 Major element compositions
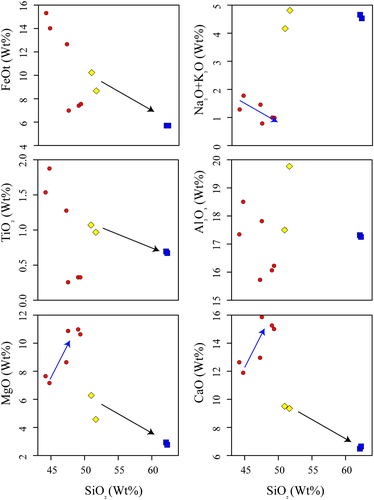
The Hunchun gabbro has low content of SiO2 (44.08–48.93%, average of 46.92%), TiO2 (0.25–1.87%, average of 0.93%), P2O5 (0.01–0.04%, average of 0.02%), Na2O (0.65–1.49%, average of 1.01%), K2O (0.11–0.30%, average of 0.18%), and consistent total alkali (Na2O + K2O = 0.76–1.72%, average of 1.20%). They also contain a high abundance of Al2O3 (15.46–18.12%, average of 16.93%), CaO (11.62–15.65%, average of 13.91%), and a continuous range of MgO (7.13–10.95%, average of 9.29%) and FeOtot (6.95–15.28%, average of 10.62%). The Mg# ranges from 33.27 to 60.94, with an average of 47.8, which is lower than the primary magma (Mg# = 0.68–0.75, Wilson, 1989) implying a higher crystallization differentiation. On the TAS intrusive rocks classification diagram (Middlemost, 1994; Figure 5a), they plot on the subalkaline gabbro and peridot gabbro zone. The AFM plot further divided the Hunchun gabbro into the tholeiite series and partly into the mafic-ultramafic cumulate (UMC) zone (Figure 5b). Major element geochemistry features of the six groups of the Hunchun gabbro reveal good positive or negative correlation on the Harker diagram (Figure 6), which implies a possibility of crystallization differentiation. The solidification index (SI in short) ranges from 29.33 to 56.84 (three of six SI < 40); comparing with the AFM plotting feature, the Hunchun gabbro in this paper reveals a simultaneously existence with the crystallization differentiation and cumulation.
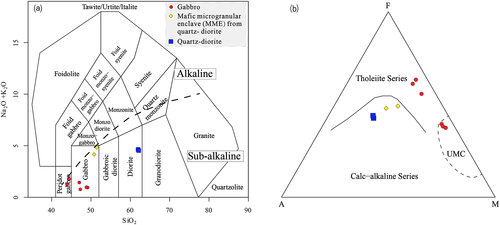
The Hunchun quartz diorite shows high SiO2 (62.06%, 62.22%, average of 62.14%), TiO2 (0.69%, 0.67%, average of 0.68%), P2O5 (0.13%, 0.14%, average of 0.14%), Na2O (3.54%, 3.61%, average of 3.58%), K2O (0.91%, 1.10%, average of 1.01%), consistent total alkali = 4.52%, 4.64%, average of 4.58%, Al2O3 (17.31%, 17.25%, average of 17.28%), relatively lower CaO (6.48%, 6.63%, average of 6.55%), MgO (2.76%, 2.90%, average of 2.83%), and FeOtot (5.70%, 5.69%, average of 5.69%). They reveal Mg# 33.73 and 33.69, with average of 33.21, implying a higher crystallization differentiation from the primary magma. On the TAS rock classification diagram (Figure 5a); they plot on the quartz-diorite zone. The AFM plot further divided the quartz diorite into the calc-alkaline series. CIPW norms of the sample reveal ~20.38% quartz, ~5.94% orthoclase, ~30.25% albite, and ~28.13% anorthite and also imply quartz-diorite nature.
Comparatively, the MME of the Hunchun quartz diorite in this paper contains higher SiO2 (51.57%, 50.88%, average of 51.23%), TiO2 (0.97%, 1.07%, average of 1.02%), P2O5 (0.12%, 0.13%, average of 0.13%), Na2O (3.50%, 4.24%, average of 3.87%), K2O (0.58%, 0.66%, average of 0.62%), and total alkali = 4.81%, 4.16%, with average of 4.49%. They also contain high abundance of Al2O3 (17.50%, 19.76%, average of 18.63%), CaO (9.35%, 9.50%, average of 9.42%), MgO (4.56%, 6.28%, average of 5.42%), and FeOtot (8.66%, 10.22%, average of 9.44%). The Mg# of the two samples comes to 34.48 and 38.07, with average of 36.28, implying a higher crystallization differentiation from the primary magma. On the TAS intrusive rocks classification diagram (Middlemost, 1994; Figure 5a), they plot on the gabbro zone (Figure 5a). The AFM plot further divided the MME into the calc-alkaline series (Figure 5b).
The MME and the quartz diorite show correlation on the Harker diagram. The mafic components of the rock FeOt, MgO reveal negative correlation implying the possible crystallization between the olivine and orthorhombic pyroxene; the content of CaO shows a decreasing trend by the increasing of SiO2, implying the possible crystallization or cumulation between clinopyroxene and plagioclase (Figure 6). The Harker diagram also implies a different magmatic evolution relationship between the gabbro and the quartz diorite (Figure 6).
4.1.2 Trace elements compositions
The Hunchun gabbros have low total REE concentrations ranging from 11.35 to 28.23 ppm with average of 19.98 ppm (Table 1) and are characterized by relatively flat chondrite-normalized REE patterns (LaN = 6.77 to 10.32, (La/Yb)N values of 1.24 to 1.84; Figure 7a) and positive Eu anomalies (Eu/Eu* = 1.05 to 1.43), which implies accumulation of plagioclase. The primitive mantle-normalized spidergrams reveal the relatively enrichment of the LILEs elements (Rb, Ba, K, Sr, and Eu) and depletion of HFS elements (Y, Hf, Zr, Nb, and Ta) implying a subduction magma rock feature (Kelemen, Hanghøj, & Greene, 2003; Figure 7b).
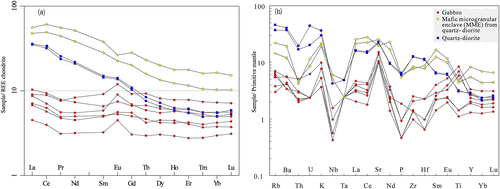
The MME of the Hunchun quartz diorite has total REE concentrations of 106.44 and 137.88 ppm, with average of 122.12 ppm (Table 1) and characterizing by right inclined-type chondrite-normalized REE patterns (Figure 7a) with LREE-enrichment—LaN = 47.74 and 55.81, (La/Yb)N values of 3.41 and 4.64—and insignificant negative Eu anomalies (Eu/Eu* = 0.81 and 0.95), which implies a weak accumulation of plagioclase. The primitive mantle-normalized spidergrams reveal the relatively enrichment of the LILEs elements (Rb, Ba, K, and Sr) and depletion of HFS elements (Ti, Hf, Nb, and Ta) also implying a subduction magma feature (Figure 7b).
The quartz diorite has total REE concentrations of 64.11 and 67.40 ppm, with average of 65.76 ppm (Table 1) and are characterized by right inclined-type chondrite-normalized REE patterns (Figure 7a) with LREE-enrichment (LaN = 35.16 and 35.81, (La/Yb)N values of 6.51 and 7.00) and weak positive Eu anomalies (Eu/Eu* = 1.11 and 1.13) implying a accumulation of plagioclase. The primitive mantle-normalized spidergrams also reveals the enrichment of the LILEs elements (Rb, Ba, K, Eu, and Sr) and depletion of HFS elements (Ti, Nb, and Ta) also implying a subduction magma feature (Figure 7b). The quartz diorite and its MME reveal a good linear relationship from the rare earth element ratio between La/Yb and Nd/Yb also implying a comagmatic evolution relationship but different with that of the gabbro.
The gabbro, quartz diorite, and MME in this paper reveal a relatively stable ratio of Ba/Rb but unstable ratio of Ba/Nb, which means the analysis result of the major and trace elements basically represents the primary magma (Zhang & O'Reilly, 1997).
4.2 Zircon U–Pb results
4.2.1 The Hunchun gabbro and quartz diorite
Twenty-five U–Pb isotope analyses were carried out on 25 zircon grains (Table S1) from the Hunchun gabbro (HC01) and quartz diorite (HC02) in this paper, respectively. The zircon grains of the gabbro typically contain clear oscillatory zones, euhedral, and prismatic or plank-shaped features. They both reveal high Th/U ratio (all >0.2, 8 of 25 are >1), and 20 of 25 within 90–110% concordia data yielding the weighted average 206Pb/238U age of 268.1 ± 3.5 Ma., MSWD = 0.63 (Figure 8a).
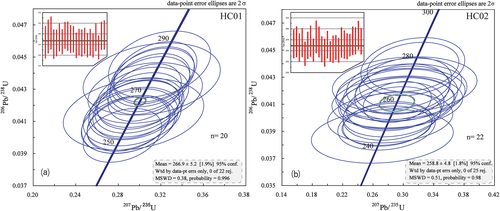
The HC02s zircon grains are typically colourless or transparent and having oscillatory zones and euhedral features. They also contain prismatic or plank-shaped features but partly show corrosion features. Twenty-four of 25 within 90–110% Concordia data reveals high Th/U ratio (0.276–0.525) and a weighted average 206Pb/238U age of 258.8 ± 4.8 Ma, MSWD = 0.51, probability = 0.98 (Figure 8b).
4.2.2 Early Permian Sidonggou Formation
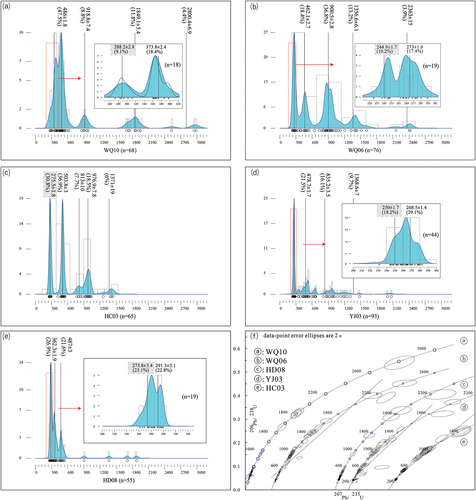
The zircons from the sandstone sample WQ10 are euhedral, prismatic or plank shaped with a size of ~100 μm, obtaining clear oscillatory zones, and the Th/U values range from 0.065 to 1.483 (Table S1), suggesting a magmatic origin. A total of 68 zircon grains yield concordant U–Pb age components of 288.2 ± 2.8 (9.1%), 373.8 ± 2.4 (18.4%), 486 ± 1.8 (47.5%), 918.8 ± 7.4 (8.8%), and 1,849.1 ± 5.4 Ma (11.8%). There are only three >2-Ga single grain zircons that reveal 207Pb/206Pb ages of 2,526.2 ± 10.2, 2,945.4 ± 18.95, and 2,983.2 ± 10.5 Ma, respectively (Figure 9a).
4.2.3 Late Triassic Luoquanzhan Formation
The sandstone sample WQ06 was collected from the Luoquanzhan Formation, Laoheishan, Wangqing area (Figure 2). The short columnar or columnar zircon grains are in the size of ~100 μm and show clear oscillatory zones, euhedral, and prismatic or plank-shaped features. Th/U values range from 0.118 to 1.369 (only three grains have lower ratio, they are 0.044, 0.08, and 0.09; Table S1), suggesting a magmatic origin. A total of 76 analyses yield age components of 244.9 ± 1.7 (10.2%), 273 ± 1.6 (17.4%), 462.1 ± 2.7 (18.4%), 900.5 ± 2.8 (36.8%), and 1,356.6 ± 6.1 Ma (13%), and 2,363 ± 15 (3.9%; Figure 9b).
4.2.4 Middle Permian Guanmenzuizi Formation
The greywacke sample HC03 was collected from the Guanmenzuizi Formation, Hunchun area (Figure 2). The short columnar or columnar zircon grains are in the size of ~80 to ~150 μm and show clear oscillatory zones, euhedral, and prismatic or plank-shaped. Th/U values range from 0.073 to 1.09 (Table S1), suggesting a magmatic origin. A total of 65 analyses yield age components of 275.5 ± 1.8 (30.8%), 503.8 ± 3 (36.9%), 813 ± 10 (7.7%), 976.9 ± 7.8 (18.5%), and 1,371 ± 19 Ma (6%; Figure 9c).
4.2.5 Early Triassic Kedao Formation
The siltstone sample YJ03, which was collected from the Kedao Formation, Yanji area contains of short columnar or columnar zircon grains in the size range of ~90 to ~150 μm and show clear oscillatory zones, euhedral, and prismatic or plank-shaped features. The Th/U values range from 0.027 to 2.076 (91% of all tested grains' Th/U ratio > 0.3; Table S1), suggesting a magmatic origin. A total of 93 analyses yield age components of 250 ± 1.7 (18.2%), 268.5 ± 1.4 (29.1%), 478.7 ± 1.7 (21.5%), 835.2 ± 3.5 (16.1%), and 1368.6 ± 7 Ma (9.7%). There are only three analyses that showed 207Pb/206Pb ages at 1,478.5 ± 20.1, 1,997.1 ± 26.4, and 2,068.6 ± 42.1 Ma, respectively (Figure 9d).
4.2.6 Middle Permian Fanjiatun Formation
The sandstone sample HD08, which was collected from the Miaoling Formation, Huadian area yielded abundant zircon grains (>1000 grains). The short columnar or columnar zircons are smaller than the former samples in the size range of ~40–100 μm and show clear oscillatory zones, euhedral, and prismatic or plank-shaped features. Partly of the grains are rounded and broken. The Th/U values range from 0.109 to 0.951 (Table S1), suggesting a magmatic origin. A total of 55 analyses reveal ages components of 273.8 ± 3.4 (23.1%), 291.3 ± 3.1 (22.8%), 356.4 ± 2.1 (26.9%), and 487 ± 3 Ma (20%). Only four analyses show the 207Pb/206Pb ages at 903.8 ± 16.35, 1,364.6 ± 25.05, 1,705.4 ± 37.15, and 1,877 ± 37.6 Ma, respectively (Figure 9e).
5 DISCUSSION
5.1 Timing of the final closure of the Paleo-Asian Ocean at Hunchun-Yanji area
As shown in the results, the typically clear oscillatory zones, euhedral, and prismatic or plank-shaped zircon grains and high Th/U ratio imply that the Hunchun gabbro's U–Pb weighted average age of 268.1 ± 3.5 Ma could represent their crystallization age in the Middle Permian. It is similar to the previous reported gabbro dyke of 270 ± 10 Ma (Zhao, Li, Li, & Chen, 2008) and metamorphic dacite of 274 ± 7 Ma (Yu et al., 2008) at Hunchun-Yanji area. The quartz diorite in this paper also shows typically magmatic zircon features. The quartz diorite reveals a weighted average U–Pb age at 258.8 ± 4.8 Ma represents the quartz diorite's crystallization age in the Late Permian. Comparing this 258.8 ± 4.8 Ma quartz diorite with the previous report of the 254 Ma quartz diorite at Fuxing, Wangqing area (Fang, 1992), 257.3-Ma tonalite at Fengli, Wangqing area (Zhang, Peng, & Ou, 2000); 256-Ma tonalite; and 252-Ma quartz diorite at Xiaoxinancha, Yanji area (Fu, 2009); and 255-Ma diorite at Madida, Hunchun area (Cao, 2010), the Hunchun area should show two periods of magmatic events, the late Early Permian to early Middle Permian and the Late Permian.
The Hunchun gabbro in this paper reveals a lower Rb/Sr ratio (0.007–0.020) than the average upper mantle (0.034), and the quartz diorite show a little higher Rb/Sr ratio (0.017–0.062), while they are both lower than the average crust (0.35; Taylor & McLennan, 1995) implying a mantle feature. The gabbro reveals low SiO2, relatively high Mg# (~47.80), Na enrichment (Na2O/K2O = 3.70–10.27), and enrichment of transition elements, implying its magma source area should be the upper mantle, while the quartz diorite with a lower MgO content (2.76–6.28%), Mg# (32.69–38.07) implying that it does not belong to the product from a partly fused mantle peridotite (Cox, 1980). Both the gabbro and quartz diorite reveal an enrichment of LREE, loss of HREE, and depleted HFS elements like Nb, Ta, and Hf features that imply two kinds of possible formation mechanisms, (a) strong crustal contamination and (b) effected by the fluid/melting's metasomatism in the subduction zone.
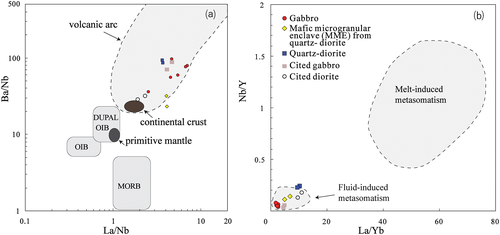
The ratio of (Th/Nb)N and Nb/La can be used to identify whether there was contamination from the crust or not (Xia, Xia, Xu, Li, & Ma, 2007). The Hunchun gabbro and quartz diorite both contain high (Th/Nb)N (gabbro at 1.91–5.46; quartz diorite at 0.70–4.63) and lower Nb/La (gabbro at 0.14–0.39; quartz diorite at 0.24–0.27), which mean a possible crustal contamination. While, the Hunchun gabbro in this paper contains very low SiO2 content but high Fe, Mg, and transitional elements, these features imply that it is not possible to contain large-scale crustal contamination at the early stage of the magma evolution. The flat chondrite-normalized REE patterns—(La/Yb) N values of 1.24 to 1.84—also prove a limited contribution from the continental crust. Nb/U, Ta/U can also be used to judge whether there has been contamination from the crust or not. Comparing with the mid-ocean ridge basalt (Nb/U = 47, Ta/U = 2.7; Hofmann, 1988; Yan, Chen, & Xu, 2008) and the continental crust (Nb/U = 12.1, Ta/U = 1.1; Taylor & McLennan, 1995; Yan et al., 2008), the Hunchun gabbro and quartz diorite from this paper reveal the average ratio of gabbro at average of Nb/U = 9.23, Ta/U = 1.79 and quartz diorite at average of Nb/U = 12.08, Ta/U = 0.52 excluding the crustal contamination option. Moreover, the gabbro and the quartz diorite in this paper contain much higher Ba/Nb, La/Nb ratio than the primitive mantle and the average continental crust and plots in the volcanic arc, which also proves the above opinion (Figure 10a); the nearby Hunchun gabbro and diorite also reveal the similar feature (Cao, 2010; Fu, 2009). Mafic or intermediate rock, which was formed by metasomatic melting, will reveal a Nb element enrichment feature and contain higher values of P2O5 and TiO2. It will also show positive or weak negative Nb anomalies in the primitive mantle-normalized spidergram (Yan et al., 2008). This is totally different with this paper's low contamination of Nb of the gabbro and quartz diorite and the obvious negative Nb anomalies in the primitive mantle-normalized spidergram. In the La/Yb-Nb/Y diagram, the gabbro and quartz diorite all plot in the fluid-induced metasomatism area, further proving that the gabbro and quartz diorite were both affected by metasomatic fluids from the subduction plate dehydration (Figure 10b). The slight crustal contamination feature might have been caused by the partial melting of the mantle wedge, which had undergone metasomatism induced by the subduction fluid.
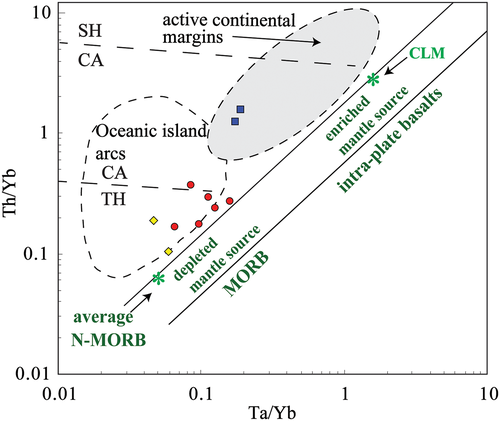
The above trace elements features reveal that the Hunchun Middle Permian gabbro and Late Permian quartz diorite both reflect a plate subduction related magma feature, which implies the formation of the two plutons has some connection with the subduction of the Paleo-Asian Ocean. The Ta/Yb-Th/Yb diagram is widely used to identify the forming environment of gabbroic rock. The Hunchun gabbro and quartz-diorite plot in the oceanic island arcs and active continental margins, respectively (Figure 11). The island-arc basalt source area mainly contains a defective wedge mantle, subduction fluid, and the continental source sediment, which was carried by the subducted oceanic crust (Li et al., 1994); combining with the above evidence, there is hardly any continental source sediment contribution. Linking to its low potassium arc tholeiitic basalt-like feature, we speculate that the forming position of the Hunchun gabbro in this paper will be close to an oceanic trench. Former researches have point out that the Jilin-Heilongjiang area belongs to an active continental margin with volcanic island chain in the late lower Permian (Wen, Zhang, Wang, Liu, & Yang, 1996). Tang and Zhao (2007) and Zhao, Li, Li, and Chen (2008) both believed that the SW margin of the JB belonged to an active continental margin and developing island arc activity in the Permian. In summary, until the late middle Permian, the Paleo-Asian Ocean Plate still continued to dive under the JB.
5.2 Constraints on sedimentary provenances in identifying the attribution of each side of the SXCYS
On the basis of the newly obtained age data of detrital zircon grains from the study area, we discuss their geological implications with specific focus on the following three aspects: (a) the youngest zircon age component, which constrains the maximum depositional age; (b) the older grains' age components used for provenance analysis; and (c) the comparison of each sediment samples' age components to find out the similarity and difference with each side of the SXCYS.
5.2.1 Maximum depositional age of each formation
In this study, we use the youngest zircon U–Pb age components but not the youngest U–Pb single-grain ages to reveal the sedimentation time, because they offer a statistically more meaningful way for determining the maximum age of deposition (Alván et al., 2015; Von Eynatten & Dunkl, 2012). The youngest age component of a grain-age distribution carries the cooling or crystallization ages in formation, which mark the maximum age of deposition, providing that burial temperature has not reached Tc, and gives fossil-poor continental deposits the only chronostratigraphic information (Leier, DeCelles, Kapp, & Gehrels, 2007; Meng et al., 2010; Najman, Pringle, Godin, & Oliver, 2001; Surpless, Graham, Covault, & Wooden, 2006; Von Eynatten & Dunkl, 2012).
From east to west (Figure 2), the youngest detrital zircon age component obtained for the Sidonggou Formation sample WQ10, Laoheishan County, Wangqing area indicate a deposition age younger than the Kungurian (with the youngest age component of 288.2 ± 2.8 Ma [9.1%]); that is, the maximum age of this formation is Late Early Permian. Compared with newest strata classification and lithologic features at this area, the Permian Kedao Formation has been demarcated to Early Triassic, the possible formation, which sample WQ10 belonged to, could be the Early Middle Permian Sidonggou Formation (Zhou et al., 2009). With the youngest age component of 244.9 ± 1.7 Ma (10.2%), the Luoquanzhan Formation sample WQ06, Xingzhen County, Wangqing area indicates a deposition age younger than the Anisian, that is, the maximum age of Luoquanzhan Formation is Middle Triassic. The youngest age components obtained for the Guanmenzuizi Formation (HC03), Hunchun area reveals a deposition age younger than the Kungurian (275.5 ± 1.8 Ma [30.8%]); that is, the maximum age of the Guanmenzuizi Formation is late Early Permian. When considered along with the youngest age component of 250 ± 1.7 Ma (18.2%) obtained for the Kedao Formation, Yanji area, these results suggest that the graywacke sample YJ03 within the Kedao Formation was deposited after the Olenekian. The maximum age of the Kedao Formation is late Early Triassic to early Middle Triassic. The youngest age components obtained for the Fanjiatun Formation (HD08), Xishantun County, Huadian area suggests a deposition age younger than the Kungurian. The maximum age of the Fanjiatun Formation is Middle Permian.
5.2.2 The older grains' age components used for provenance analysis
The study area mainly located in between the JMB and NCC (Figure 1), the possible provenance supplier could come from the JB and the NCC. Former studies have shown that the distribution of relative probability U–Pb detrital zircon ages from the Pre-Mesozoic strata in the NCC ranges of 2.65–2.29 Ga, 2.19–1.52 Ga, and 474–255 Ma (Cope, Ritts, Darby, Fildani, & Graham, 2005; He et al., 2017; Li et al., 2009; Li, Peng, Xu, Han, & Zhai, 2009; Luo et al., 2008; Sun et al., 2013; Yang, Xia, & Yang, 2006); and the distribution of relative probability U–Pb detrital zircon ages from the Pre-Mesozoic strata in the JB ranges of 2.62–2.36 Ga, 1.98–1.68 Ga, 995–745 Ma, and 572–262 Ma (Guo, Zhou, Zhang, & Qiu, 2011; Li, Sun, & Zhao, 2011; Meng et al., 2010) (Figure 12).
Provenance of the Sidonggou Formation
Sample WQ10 of the Sidonggou Formation contains five age components, that is, 288.2 ± 2.8 (9.1%), 373.8 ± 2.4 (18.4%), 486 ± 1.8 (47.5%), 918.8 ± 7.4 (8.8%), and 1,849.1 ± 5.4 Ma (11.8%) and three single grain ages, 2,526.2 ± 10.2, 2,945.4 ± 18.95, and 2,983.2 ± 10.5 Ma. Comparing with the age distribution kernel density plot of the JMB and the NCC (Figure 12g–j), sample WQ10 shows two characteristic JMB age components (ca. 900 and 500 Ma), implying that the Sidonggou Formation was likely receiving sedimentary input from the JMB during the Early Permian (Figure 12c).

Provenance of the Luoquanzhan Formation
As described above, the Luoquanzhan Formation sample WQ06 contains age components of 462.1 ± 2.7 (18.4%) and 900.5 ± 2.8 Ma (36.8%), which show the characteristic age components of the JMB. The absence of characteristic age component of ca. 1,800 Ma implies that the Luoquanzhan Formation was unlikely receiving sedimentary input from the NCC during the Middle Triassic (Figure 12e).
Provenance of the Guanmenzuizi Formation
Age distribution of all detrital zircons from the sample HC03, Guanmenzuizi Formation is shown in Figure 12a. The age components of 503.8 ± 3 (36.9%) and 813 ± 10 Ma (7.7%) showed the characteristic age components of the JB (Zhou, Yin, & Peng, 2009). The absence of a Pre-Paleoproterozoic age component implies that the Guanmenzuizi Formation was unlikely receiving sedimentary input from the NCC during the Middle Permian.
Detrital provenance of the Kedao Formation
Sample YJ03 of the Kedao Formation contains five age components, that is, 250 ± 1.7 (18.2%), 268.5 ± 1.4 (29.1%), 406.2 ± 2 (11.8%), 546.8 ± 2.2 (19.4%), 929.6 ± 4.1 (14%), and 1,443.4 ± 8 Ma (7.5%). Comparing with the age distribution kernel density plot of the JB and the NCC (Figure 12g–j), sample YJ03 shows two characteristic Jiamusi-Mongolia Block age components (ca. 900 and 500 Ma), implying that the Kedao Formation was likely receiving sedimentary input from the JB during the Middle Triassic (Figure 12f).
Detrital provenance of the Fanjiatun Formation
Sample HD08 of the Fanjiatun Formation contains five age components, that is, 273.8 ± 3.4 (23.1%), 291.3 ± 3.1 (22.8%), 356.4 ± 2.1 (26.9%), and 487 ± 3 Ma (20%). Only four grains showed the ages of 903.8 ± 16.35, 1,364.6 ± 25.05, 1,705.4 ± 37.15, and 1,877 ± 37.6 Ma (Figure 8). Comparing with the age distribution kernel density plot of the JMB and the NCC (Figure 12h–j), sample HD08 reveals the Jiamusi–Mongolia Block characteristics (Figure 12d). The nearby detrital zircon U–Pb distribution reported (Shoushangou Formation sandstone JK6–1, Wang, 2016) the same feature (Figure 12b). Both groups of sandstone samples imply that the northern part of Huadian area belongs to the northern part of the SXCYS in the late Early Permian, and the Paleo-Asian Ocean had not closed in the late Early Permian in the Huadian area.
5.2.3 Tectonic correlation of the Late Palaeozoic sequences in between the NCC and JMB at Hunchun-Yanji area
Former researchers have found that the blocks (E. B., X. B., S. X. B., J. B., and J. B.) in Northeast China contain the same ~500 Ma Pan-African metamorphic crystal basement (Ge, Sui, Wu, & Zhang, 2007; Liu et al., 2008; Wu et al., 2005; Wu et al., 2011; Zhou, Yin, & Peng, 2009; Zhou et al., 2010a, 2010b, c; Zhou et al., 2011, Zhou et al., 2011), which could be the typical marked difference with the NCC and the Huannan Block (Zhou, Wilde, Zhang, Ren, & Zheng, 2011). In addition, comparing with the NCC, 0.9–1.5 Ga also represents a typical feature of JMB (Chen et al., 2014; Rojas-Agramonte et al., 2011; Xu, Wang, & Meng, 2012; Zhang, Zhou, Chi, Wang, & Hu, 2008). All five groups of sediment samples show apparent ~500-Ma age component (Figure 12), meanwhile sample WQ06, WQ10, HC03, and YJ03 also reveal age components of ~900 Ma and series of ~1.0 to 1.5 Ga single zircon U–Pb ages, which represent a XMOB feature. Traditionally, the ~2.5- and 1.8-Ga combination represent the typical magmatic-thermal events of the NCC (Chen, Jahn, & Tian, 2009; Guo, Sun, Chen, & Zhai, 2005; Ma & Wu, 1981; Miao et al., 2007; Shi et al., 2003; Zhao, Wilde, Cawood, & Sun, 2001) and SC (Jahn, Windley, Natal'in, & Dobretsov, 2004; Kelty, Yin, Dash, Gehrels, & Ribeiro, 2008; Rojas-Agramonte et al., 2006; Zonenshain, 1990), which means the likely source of the older grains coming from the SC in the North or the NCC in the south, while, in recent years, a wide spread of detrital zircons U–Pb ages from the sandstone at the JMB were found numerous ~1.8- and 2.5-Ga age groups (Meng et al., 2010), which were believed to have been derived from a local source. Other evidences, for instance, a report of metamorphosed clastic rocks of the Xinghuadukou Group, which were believed to be derived from the Precambrian metamorphic basement of the Xing'an and the Erguna blocks (Li, 1998; Ye, 1994; Zhang & Sklyarov, 1992; Zhao et al., 1996) containing abundant ~1.8 Ga and a small group of ~2.5-Ga detrital zircons (Miao et al., 2007); granites with ~1.7-Ga Hf Model ages were reported from the northern Da Xing'an Range (Ge et al., 2007); gneisses sample of the Mendulihe Group from the Erguna Block recording a magmatic thermal event at ~2,450 Ma (Luo, Wang, & Zhou, 1997; Zhang et al., 2000) also supported a local resource hypothesis. These findings raise the possibility of widely distributed Neoproterozoic basement of the JMB (Meng et al., 2011). Taking the upper evidences and the euhedral zircon grains, it is hard to use the ~ 1.8- and 2.5-Ga combination to distinguish the NCC and the JMB.
In summary, we believe that all of the five groups of sediment samples are derived from a local source from the Jiamusi–Mongolia Block, which means all the sediment samples were coming from the north of the SXCYS.
5.2.4 The possible position of the eastward extension of SXCYS
Former studies have clearly indicated that the closure of the Paleo-Asian Ocean went through a long history (through the whole Palaeozoic and Early Mesozoic) and experienced a scissors-like closure of the Paleo-Asian Ocean from west to east (Liu et al., 2017; Xin, Ren, Peng, & Sun, 2011). Sun, Wu, Zhang, and Gao (2004) reported a late Permian (248 Ma) age but not the Caledonian Orogeny, as formerly suggested high-potassium calc-alkaline I-type granite with syncollisional feature from the Dayushan pluton in northwest Huadian, Jilin Province. In Sandaohe, Dunhua, Jilin Province, Sun, Wu, Gao, and Lu (2005) reported syn-orogenic granite with a zircon U–Pb age of 216 Ma. In SW Helong, a Triassic (249–245 Ma) syn-collisional monzogranite was recognized and explained as the evidence of the collision of the CAOB orogenic collage with the NCC and the final closure of the Paleo-Asian Ocean (Zhang et al., 2004). These evidences comprised a syn-orogenic granitic belt along the Changchun–Yanji Belt and the final collision time between the NCC and the SXB as Late Permian–Early Triassic (Li, Gao, Guan, & Li, 2006; Qin, Li, Huang, Cai, & Ren, 2013; Xin et al., 2011; Xu, Charvet, Chen, Zhao, & Shi, 2013; Zhang, Yuan, Xue, Yan, & Mao, 2015).
The report of the Bailiping's Triassic (249–245 Ma) syn-collisional monzogranites, which was believed to represent the collision of the CAOB orogenic belt and the NCC, the final closure of the Paleo-Asian Ocean and the similar Sr-Nd isotope with the Phanerozoic granitic rock of the CAOB, suggests that the SW 50 km to the Fuerhe–Gudonghe Fault should be the suture zone (Zhang, Wu, Zhai, & lu, 2005). Considering the extensive Permian plant and animal fossils in the region, Li, Chen, et al. (2011) reported Cathaysia-type late early Permian Hesheng plant fossils, implying a dividing line between Cathaysia and Angara following the Wangqing–Hunchun and further predicting it as the eastward extension of the SXCYS. While except these Permian Cathaysia-type plant fossils from the Hesheng Group at Wangqing and Early Permian Dasuangou Cathaysia plant fossils at South Kaishantun, there is no flora of a pure composition of the Middle to Late Permian Cathaysian or the Angara floras in the area between the vicinities of Kaishantun and Vladivostok (Huang, 1997; Kon'no, 1968; Peng, 1997; Figure 13). The relation in the distribution of these two major floras appears to be quite discontinuous in this area. In this paper, considering the Early Triassic Kedao Formation reveals typical JMB provenance feature at the Kaishantun area, we believe that the possible suture zone should lie partly in between the Wangqing-Kaishantun area. Comparing with the 268-Ma oceanic island-type gabbro, 258-Ma active continental margin-type quartz diorite at Laoheishan area and the sediment sample HC03, which reveals a typical JMB provenance feature, this area should also belong to a part of the SXCYS. Due to some ENE-trending faults feature both in Yanji and Hunchun area, we suggest a possible ENE fault separates the eastern extension of SXCYS into two parts. The partly possible position of the eastward extension of the SXCYS should go along the Wangqing–Kaishantun in the west, Hunchun–Laoheishan at NW direction in the east (Figure 13).
6 CONCLUSIONS
- The Hunchun gabbro formed in the middle Permian (266.9 ± 5.2 Ma), and the nearby quartz diorite formed in the late Permian (259.8 ± 4.8 Ma). The Hunchun gabbro shows low-K arc tholeiite geochemistry feature, and its magma originated from the mantle wedge, which was affected by dehydration metasomatism of the subducted slab. The quartz diorite reveals a geochemistry feature of an active continental margin, its magma also originated from the mantle wedge, which was affected by dehydration metasomatism of the subducted slab.
- Until the late Middle Permian, the SW margin of the JB continuously experienced the subduction process from the Paleo-Asian Ocean Plate. The final closure time of the Paleo-Asian Ocean should be later than the late Middle Permian in Hunchun-Yanji area.
- All of the sedimentary samples from the Wangqing, Yanji area reveal the SXB source nature, implying that the Wangqing, Yanji area was located to the north of the SXCYS. The youngest age component (250 Ma) of the Kedao Formation implies the final closure of the Paleo-Asian Ocean should be no earlier than Early Triassic.
- A possible ENE fault separates the eastern extension of SXCYS into two parts, which means the partly possible position of the eastward extension of the SXCYS should go along the Wangqing–Kaishantun with NNW direction in the west, Hunchun–Laoheishan with NW direction in the east. But further studies of the complete suture zone of the eastward extension of the SXCYS still need to be performed.
ACKNOWLEDGEMENTS
We thank Dr. Istvan Dunkl for his insight and advice for providing and processing U–Pb zircon data. We are indebted to Min Xu, Binqiang Liu, Duozi Li and Jing Li for their enthusiastic help in LA ICP-MS zircon U–Pb dating. Funding for this study were jointly granted by the National Key R&D Program of China, Ministry of Science and Technology of the People's Republic of China (Grant No. 2017YFC0601300-01), The Scientific and Technological Innovation Project Financially Supported by Qingdao National Laboratory for Marine Science and Technology (No. 2015ASKJ01) and the financial support from China Scholarship Council.


