Depositional facies controls on the diagenesis and reservoir quality of the Messinian Qawasim and Abu Madi formations, onshore Nile Delta, Egypt
Abstract
The Messinian Qawasim and Abu Madi formations are the main hydrocarbon exploration targets in the onshore Nile Delta. Qawasim Formation constitutes prograditional deltaic system from prodelta and distal delta-front (distal deltaic facies) to proximal delta-front and delta-plain (proximal deltaic facies). Abu Madi sediments on the other hand change upward from continental subaerial gravity-flow and fluvial facies to marginal-marine estuarine facies. The seismic attribute (RMS amplitude) and petrophysical analyses revealed that solely the Qawasim proximal deltaic and Abu Madi fluvial facies define the potential reservoir targets. The reservoir quality of the Qawasim distal deltaic and the Abu Madi estuarine facies was completely deteriorated during eodiagenesis by calcite and glauconite cementation (mean > 7.3% and 4.5%, respectively). Conversely, the depositional setting of the Qawasim proximal deltaic and Abu Madi fluvial facies favoured a precipitation of scattered eodiagenetic calcite (mean < 2.5%), which supported the facies framework against mechanical compaction and preserved the intergranular volume (IGV). Chemical compaction, smectite infiltration, quartz cementation, and clay minerals authigenesis were more pronounced in the relatively deeper Abu Madi fluvial facies. These burial attributes caused a large-scale reservoir heterogeneity. Therefore, the relatively shallower Qawasim proximal deltaic facies presents the best reservoir target in the Messinian sequence of the Nile Delta. This study reveals that in analogous systems, the depositional environment largely controls the diagenetic pathways and, hence, the reservoir quality.
1 INTRODUCTION
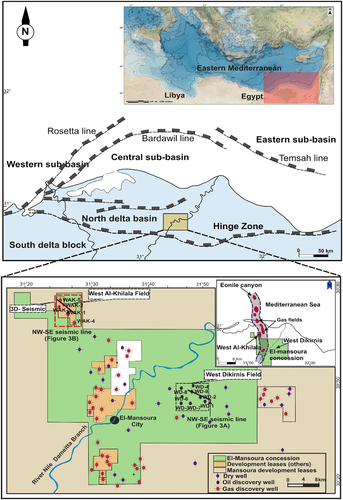
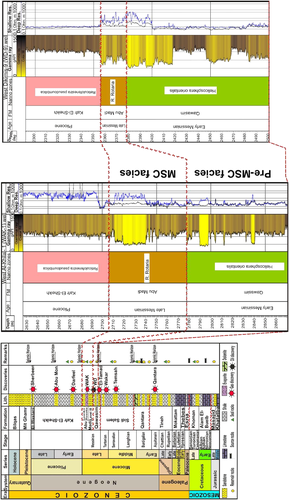
Porosity (phi) and permeability (k) represent key parameters for any subsurface energy exploration, production, and management project. Their magnitude and spatial distribution control the producibility of a reservoir and thus the economic viability of the project (e.g., Hammer, Mørk, & Naess, 2010; Morad, Ketzer, & De Ros, 2000; Moscariello, 2016). Therefore, recognition of spatio-temporal diagenetic changes and their controls on the porosity/permeability presents major challenges to be addressed (e.g., Morad et al., 2000). The accurate prediction of reservoir characteristics is mostly dependent on understanding the link between initial depositional conditions and burial diagenesis (Hammer et al., 2010; Kim & Lee, 2004; Kim, Yong, & Hisada, 2007; Morad et al., 2000; Xi et al., 2015). The present study aims to understand this link by investigating the Messinian sequence, which hosts potential reservoir targets in the onshore Nile Delta region (Figure 1). These reservoirs were formed prior to and during the Messinian Salinity Crisis (MSC) and a sea-level fall and rise, which resulted in the formation of large fluvial incisions (e.g., the Eonile Canyon; Dolson et al., 2001). The main Messinian reservoirs are the pre-MSC Qawasim and the MSC Abu Madi formations (Figure 2). Few studies concerning the reservoir quality of these Messinian sediments in the Nile Delta have been published (e.g., Leila, Kora, Ahmed, & Ghanem, 2016; Salem, Ketzer, Mora, Rizk, & Al-Aasm, 2005), leading to uncertainties regarding the depositional and burial controls on their porosity/permeability. The Qawasim Formation is penetrated by boreholes in the West Dikirnis (WD) Field (Figure 1) at a relatively shallow depth (~2,300 m), whereas the Abu Madi Formation is comparatively deeper (~2,700 m) in West Al-Khilala (WAK) Field (Figure 1). These formations comprise sediments deposited in different settings, ranging from the prodelta to delta-plain Qawasim Formation and from continental (subaerial gravity-flow and fluvial facies) to coastal marine (estuarine facies) environments in the Abu Madi Formation (Leila & Moscariello, 2016; Leila & Moscariello, 2017). The aims of this study may be defined as threefold: (1) investigation of the impacts of the depositional setting and sediment composition on the diagenetic pathways and facies seismic signature; (2) demonstration of the influence of diagenetic and depositional attributes on the reservoir quality; and (3) identification of the best reservoir quality facies using a petrophysical rock typing subdivision for the entire Messinian sequence.
2 GEOLOGICAL SETTING
The Nile Delta is located in the slightly deformed northern margin of the African Plate (Said, 1990; Sarhan & Hemdan, 1994). An E–W flexure zone of NW–SE normal faults (Hinge Zone) subdivides the Nile Delta into two main structural sedimentary provinces (North Nile Delta Basin and South Nile Delta Block; Figure 1). The Hinge Zone represents an Upper Cretaceous carbonate shelf edge, along which Cretaceous–Eocene mixed carbonate–siliciclastic sediments aggrade (Abdel Aal, Price, Vital, & Sharallow, 1994; Kamel, Eita, & Sarhan, 1998; Ross & Uchupi, 1977; Sarhan & Hemdan, 1994). Continuous subsidence along the Hinge Zone caused rapid thickening of Neogene sediments in the North Nile Delta Basin (Sestini, 1995). The Neogene Temsah and Rosetta faults (Figure 1) subdivided the North Nile Delta Basin into three sub-basins (eastern, western, and central: Kerdany & Cherif, 1990; Kamel et al., 1998). The study area is located in the North Nile Delta Basin (Figure 1), where the Neogene facies host the most potential source rocks and reservoir units (Abdel Aal et al., 1994). The trapped hydrocarbons in the Qawasim and Abu Madi reservoirs were charged from the Upper Cretaceous–Lower Palaeogene source rocks and migrated through the deep-seated faults parallel to the Hinge Zone (Leila & Moscariello, 2017).
In the study area, Upper Jurassic shallow marine carbonates are the oldest sedimentary rocks penetrated by drilling (Abdel Aal et al., 1994; Figure 2). These are followed by shallow marine Lower Cretaceous carbonates and Upper Cretaceous alternating marine and alluvial deposits (Guiraud & Bosworth, 1999; Said, 1990). The Palaeocene–Eocene interval is very thin due to Syrian Arc Folding and is followed by coarse-grained terrigenous fluvial Oligocene facies (Harms & Wray, 1990; Said, 1990). Above this interval, two main unconformities are recorded in the Miocene and Pliocene successions of the North Nile Delta Basin (Barber, 1981; Said, 1990; Figure 2). The first unconformity separates Middle from Upper Miocene strata (Tortonian unconformity), and the second documents the MSC event, which separates the pre-MSC (Qawasim) from the syn- and post-MSC strata (Abu Madi and Kafr El-Sheikh; Barber, 1981; Said, 1990). Regional marine transgression took place during Early Pliocene times (Zanclean flooding; Garcia-Castellanos et al., 2009), and the whole Messinian sequence in the Nile Delta is now covered by marine shales (Kafr El-Sheikh; Figure 2; Ross & Uchupi, 1977; Said, 1990).
3 MATERIALS AND METHODS
3.1 Seismic interpretation
The available seismic dataset includes 17 2D reflection seismic profiles passing through the WD Field area and covers an area of approximately 40 km2. The WAK Field is covered by a 60-km2 3D seismic survey. The seismic features and attributes were identified and interpreted using Schlumberger Petrel 2016 software.
3.2 Textural and compositional analysis: Grain size, petrography, and mineralogy
Conventional core samples from five wells (WD-2,-1,-9 and WAK-2,-5; Figure 1) were used in this study. Grain-size analysis was carried out on a total of 125 samples at Corex laboratories, Egypt, following the procedure described by Folk and Ward (1957). Carbonate-rich samples were treated with 10% HCl to remove the carbonate cements. Petrographic examinations of all 125 thin sections were performed using conventional petrographic microscope under plane polarized light and scanning electron microscopy (SEM). Thin section preparation involved blue-dye vacuum impregnation for porosity visualization and staining with mixed Alizarin Red-S and potassium ferricyanide for carbonate recognition, whereas sodium cobaltnitrate solution was used to recognize feldspars. Samples for modal composition were obtained by counting 400 points (Dickinson, 1970; Gazzi, 1966). For SEM, samples were mounted on standard aluminium stubs prior to coating with gold. Complementary cathodoluminescence microscopy (CL) was conducted on 15 carbon-coated polished thin sections at the Department of Earth Sciences, University of Geneva. X-ray diffraction (XRD) including whole-rock and clay fraction (<2 μm) analyses was performed at the University of Geneva following the procedure described by Šegvić, Benvenuti, and Moscariello (2016). Separation of clay fractions was carried out by centrifugation, and oriented mounts were prepared using millipore membrane filters for the qualitative and semi-quantitative measurements of clays (Moore & Reynolds, 1997).
3.3 Petrophysics
Conventional core plug analyses were conducted on 123 samples for the quantitative measurement of porosity, permeability, and grain density. The analyses were performed at Corex laboratories, Egypt, using helium gas expansion porosimeter and nitrogen permeameter. Water saturation was also measured using Dean-Stark distillation extraction method (Dean & Stark, 1920).
4 RESULTS
4.1 Seismic stratigraphy and sedimentary facies of the Messinian sequence
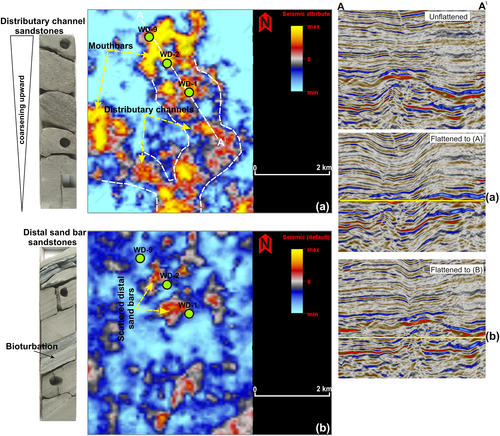
In the WD Field, pre-MSC Qawasim facies are separated from the overlying post-MSC (Kafr El-Sheikh Formation) by a continuous, high-amplitude, and irregular seismic unconformity (Figure 3a). This unconformity maybe the margin erosion surface (MES), as described by Lofi, Deverchere, et al. (2011) and Lofi, Sage, et al. (2011). The pre-MSC seismic facies are subdivided into two distinct seismic–stratigraphic units. The lower comprises low-amplitude, semi-chaotic, and discontinuous reflectors, whereas the upper unit comprises high-amplitude, continuous, parallel, and thickening south-eastward seismic reflectors (Figure 3a). The seismic facies variation from the lower to the upper unit is associated with an upward decrease in gamma ray log values, suggesting a succession with less clay (and/or K-feldspars/heavy minerals). Sedimentary facies analysis indicates that the lower unit comprises fine-grained sandstones and mudstones of the distal deltaic facies, whereas the upper unit constitutes coarse-grained massive and cross-stratified sandstones of the proximal deltaic facies (Figure 3a; Leila & Moscariello, 2016).
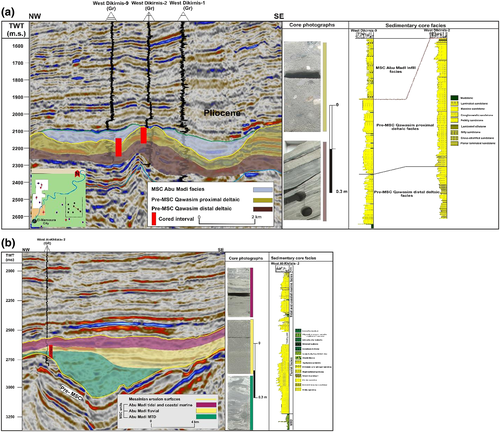
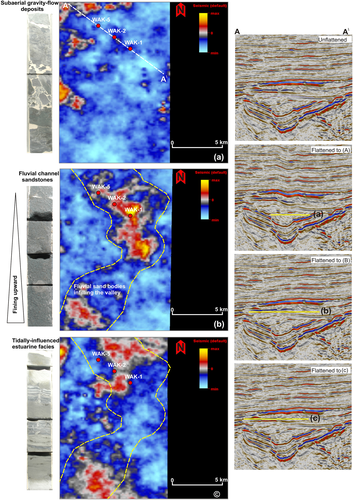
In WAK Field area, a prominent seismic unconformity of high-amplitude and concave reflection characteristics defines the base of the MSC Abu Madi Formation and displays a wide depression and a canyon-like feature (the Eonile Canyon; Figure 3b). This unconformity separates the MSC from the underlying pre-MSC facies and corresponds to the basal erosion surface (BES; Lofi, Deverchere, et al., 2011; Lofi, Sage, et al., 2011). The MSC Abu Madi facies consists of three seismic–stratigraphic units onlapping the BES and infilling the Eonile Canyon. The lower unit comprises chaotic, semi-transparent, irregular, discontinuous, and low-amplitude seismic reflectors possibly corresponding to subaerial gravity-flow deposits that accumulated contemporaneously to canyon incision during the onset of the MSC. The middle unit consists of continuous, parallel, and high-amplitude seismic reflectors (Figure 3b). The upper unit shows low-amplitude, low-frequency, and slightly chaotic seismic reflectors. The middle unit may represent coarse-grained aggradational–prograditional fluvial channel-fill sandstones, whereas the fine-grained laminated sandstones and mudstones of the upper unit may correspond to retrograding, tidally-influenced estuarine facies (Figure 3b; Leila & Moscariello, 2016). The seismic facies of the Messinian units are heterogeneous. A possible explanation is the range of depositional settings that influenced facies composition, diagenetic pathways, and hence reservoir quality. Therefore, further petrographical and petrophysical investigations are performed here in order to demonstrate the impacts on diagenesis, reservoir quality, and hence seismic response of the syn- and post-depositional processes.
4.2 Sedimentary facies petrology
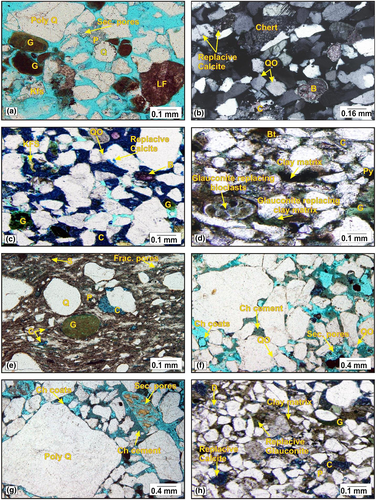
The Qawasim proximal deltaic facies is dominated by sublithic arenite sandstone microfacies with average compositions ranging from Q80F7L13 to Q83F7L10 (quartz, feldspars, and lithics; Pettijohn, Potter, & Siever, 1987). Conversely, the Qawasim distal deltaic facies is mainly a subarkose arenite sandstone microfacies (Q89F7L4). The Abu Madi fluvial facies contains abundant sublithic arenite (Q81F8L11), whereas the estuarine facies is dominated by quartz arenite and quartz wacke (Q92F5L3). On the other hand, the subaerial gravity-flow sandstones are mainly matrix-supported quartz wacke. Quartz contents (mainly monocrystalline; Figure 4) increase up-sequence from the Qawasim distal (mean = 56%) to proximal deltaic facies (mean = 61%) and decrease from the Abu Madi fluvial (mean = 64%) to estuarine facies (mean = 41%; Table 1). The average feldspar content is greater in the Qawasim proximal than in the distal deltaic facies and is relatively similar in the Abu Madi facies (Table 1). Feldspars are well preserved in the fine-grained facies (Figure 4c) and partly dissolved in the coarser sediments (Figures 4g). Their content decreases with depth (Figure 5), likely mirroring diagenetic dissolution. Lithic fragments are only common in the Qawasim proximal deltaic and Abu Madi fluvial facies (Table 1): They are mainly sedimentary (e.g., carbonates and chert; Figure 4a,b). Mica minerals are abundant in the Qawasim distal deltaic and Abu Madi estuarine facies (Table 1) and comprise ductile flakes of muscovite and biotite (Figure 4d). Matrices mostly comprise very fine-grained argillaceous materials and preferentially accumulated in loose and massive aggregates lining and filling the intergranular pores, as well as clay lamellas parallel to the detrital grains (clay cutans; Moraes & De Ros, 1992; Figure 4d,h). The argillaceous matrix is mainly kaolinitic in the Qawasim (Figure 6e) and smectitic in the Abu Madi facies (Figure 6g). Glauconite ranges from detrital spheroidal and ovoidal pellets (Figure 4a,e) to authigenic pigmentary components (Figure 4d,h). The latter occur as grain coatings, pore-filling cements, and grain-replacive components (Figure 4d). The Qawasim proximal deltaic and Abu Madi fluvial facies only contain detrital glauconite with different maturity colours indicating their extraformational origin (e.g., Amorosi, 1995; Kelly & Webb, 1999). Glauconite is more common in the Qawasim distal deltaic and Abu Madi estuarine facies (Table 1; Figure 5). Fossils and detrital biogenic debris (bioclasts; Figures 4b,d and 6a,d) are more common in the Qawasim distal deltaic and Abu Madi estuarine facies (Table 1), likely reflecting their proximity to marine conditions.
| Components | Qawasim proximal deltaic facies | Qawasim distal deltaic facies | Abu Madi subaerial gravity-flow facies | Abu Madi fluvial facies | Abu Madi estuarine facies | |||||||||||
|---|---|---|---|---|---|---|---|---|---|---|---|---|---|---|---|---|
| Detrital | Quartz (%) | Max. | Min. | Mean | Max. | Min. | Mean | Max. | Min. | Mean | Max. | Min. | Mean | Max. | Min. | Mean |
| 66.5 | 55.5 | 61.0 | 60.5 | 48.0 | 55.6 | 38.0 | 29.0 | 36.0 | 72.0 | 59.0 | 64.0 | 54.0 | 36.0 | 41.0 | ||
| Feldspar (%) | 9.0 | 3.0 | 4.5 | 7.5 | 2.5 | 3.2 | 3.0 | 0.5 | 1.35 | 8.0 | 1.0 | 3.0 | 6.5 | 2.0 | 3.1 | |
| Lithics (%) | 21.0 | 6.5 | 8.0 | 9.0 | 3.0 | 3.5 | 7.0 | 2.0 | 4.50 | 14.0 | 4.0 | 6.5 | 4.0 | 1.0 | 2.4 | |
| Glauconite (%) | 5.0 | 0.5 | 1.5 | 3.5 | 1.0 | 1.5 | 5.0 | 2.0 | 2.00 | 4.5 | 1.0 | 1.5 | 4.0 | 1.5 | 2.5 | |
| Matrix (%) | 6.0 | 1.0 | 3.3 | 19.0 | 4.0 | 10.3 | 50.0 | 41.0 | 43.10 | 18.5 | 2.4 | 10.5 | 21.2 | 4.7 | 12.6 | |
| Bioclasts (%) | 2.0 | 0.2 | 1.4 | 3.5 | 0.5 | 2.1 | 1.5 | 0.3 | 0.10 | 0.5 | 0.1 | 0.1 | 4.5 | 0.1 | 2.5 | |
| Mica (%) | 1.5 | 0.1 | 0.4 | 3.5 | 0.5 | 1.5 | 1.0 | 0.2 | 0.08 | 2.0 | 0.2 | 0.6 | 4.0 | 0.2 | 1.5 | |
| Authigenic | Quartz (%) | 1.5 | 0.2 | 0.3 | 1.0 | 0.1 | 0.1 | 1.5 | 0.4 | 0.6 | 3.0 | 0.5 | 2.25 | 1.0 | 0.1 | 0.55 |
| Calcite (%) | 4.0 | 0.5 | 1.3 | 15.0 | 1.5 | 7.3 | 4.5 | 1.5 | 2.0 | 6.0 | 0.5 | 2.5 | 22.0 | 2.0 | 13.80 | |
| Glauconite (%) | 0.0 | 0.0 | 0.0 | 4.5 | 1.0 | 3.0 | 0.0 | 0.0 | 0.0 | 0.0 | 0.0 | 0.0 | 7.0 | 2.5 | 5.00 | |
| Dolomite (%) | 5.0 | 0.5 | 2.5 | 13.0 | 3.0 | 4.2 | 3.5 | 1.5 | 1.96 | 4.5 | 1.0 | 1.5 | 12.0 | 3.2 | 4.70 | |
| Siderite (%) | 0.6 | 0.0 | 0.08 | 2.4 | 0.0 | 0.1 | 26.0 | 1.0 | 7.25 | 0.8 | 0.0 | 0.1 | 2.7 | 0.0 | 1.20 | |
| Pyrite | 1.0 | 0.2 | 0.2 | 1.0 | 0.3 | 0.3 | 3.0 | 1.0 | 2.01 | 2.5 | 0.5 | 0.7 | 5.0 | 1.5 | 2.00 | |
| Kaolinite (%) | 3.0 | 0.2 | 1.5 | 3.0 | 0.2 | 1.3 | 1.5 | 0.5 | 0.89 | 4.5 | 0.5 | 1.5 | 3.0 | 0.2 | 1.00 | |
| Chlorite (%) | 1.0 | 0.1 | 0.2 | 1.0 | 0.1 | 0.2 | 0.7 | 0.2 | 0.35 | 4.0 | 0.5 | 2.21 | 1.5 | 0.1 | 0.62 | |
| Illite (%) | 1.0 | 0.1 | 0.65 | 1.0 | 0.1 | 0.2 | 0.3 | 0.1 | 0.16 | 1.0 | 0.1 | 0.72 | 0.7 | 0.1 | 0.43 | |
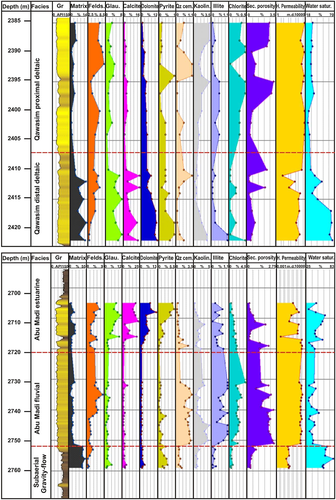
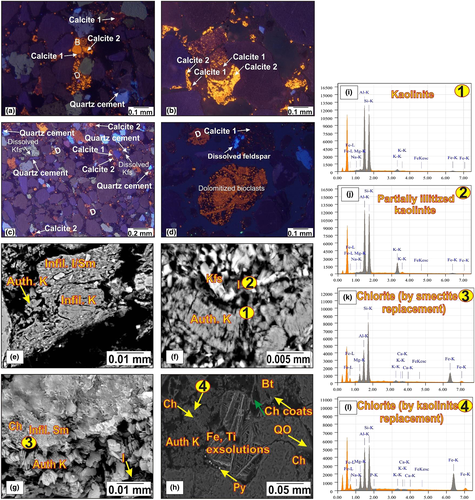
Quartz cements occur as quartz overgrowths (Figure 4b,f) and amorphous pore-filling authigenic components (Figure 6c). They are rare (mean < 0.3%) in the Qawasim facies and only common in Abu Madi fluvial facies (mean = 2.25%; Table 1). Authigenic calcite (Figure 4b,c) is more abundant in the Qawasim distal deltaic (mean = 7.3%) and Abu Madi estuarine facies (mean = 13.8%; Table 1). CL images show two calcite morphotypes (Calcite 1 and Calcite 2). Calcite 1 represents the dark brown luminescent pore-filling cements, whereas Calcite 2 constitutes bright orange luminescent crystals engulfing Calcite 1 (Figure 6a,b). Authigenic dolomite is more common in the Qawasim distal deltaic and Abu Madi estuarine facies (Table 1; Figure 5). It occurs as pore-filling cements (Figure 6a) and grain-replacive component (Figure 6d). The CL images illustrate different generations of dolomite with multiple growth zones (Figure 6a,d), reflecting continuous nucleation.
Authigenic clays comprise kaolinite, illite, and chlorite, whereas smectite is only recorded in detrital aggregates. Authigenic kaolinite occurs as pore-filling booklets (Figure 6f) and replacive pseudomorphs of feldspars. Kaolinite content decreases with depth in the Qawasim proximal deltaic and increases in Abu Madi fluvial facies (Figure 5). Fibrous, hairy-, and needle-shaped illite crystals partly and completely replace authigenic kaolinite and detrital feldspars (Figure 6f,g). Illite content is a function of depth rather than facies depositional setting (Figure 5). Chlorite is only significant in Abu Madi fluvial facies (Table 1). It occurs as a pore-filling cement (Figures 4f,g) and a replacive component growing on kaolinite (Figure 6g) and smectite (Figure 6h). Minor authigenic phases are represented by siderite and pyrite cements. Siderite is only common in the Abu Madi subaerial gravity-flow deposits (Table 1; Figures 4e). Pyrite cement is more abundant in the Qawasim distal deltaic and Abu Madi estuarine facies (Table 1; Figure 5). It occurs in two morphotypes comprising framboidal and euhedral crystals (Figures 4d and 6h).
4.3 Petrophysical characteristics
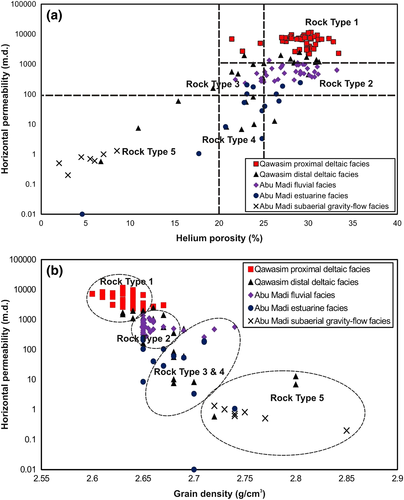
Primary intergranular macro-sized pore spaces (>50 μm) and secondary intragranular pore spaces are only significant in the coarse-grained Qawasim proximal deltaic and Abu Madi fluvial facies (Figure 4a,g; Table 2). Helium porosity values increase upward from the Qawasim distal to proximal deltaic facies and decrease from the Abu Madi fluvial to estuarine facies (Table 2). Nitrogen horizontal permeability measures highest in the Qawasim proximal deltaic (mean = 6114 m.d.) and lowest in the Abu Madi subaerial gravity-flow deposits (mean = 0.72 m.d.; Table 2). Similarly, vertical permeability records the highest and lowest values in the Qawasim proximal deltaic and Abu Madi subaerial gravity-flow deposits, respectively (Table 2). The permeability/porosity cross-plot subdivides the Messinian facies into five rock types of descending reservoir quality (Figure 7a). It highlights the excellent reservoir quality of the Qawasim proximal deltaic facies (rock Type 1) and the poor quality of the Abu Madi subaerial gravity-flow deposits (rock Type 5). It also reveals a good reservoir quality for the Abu Madi fluvial facies (rock Type 2); however, a permeability separation between the Qawasim proximal deltaic and Abu Madi fluvial facies is observed despite their similar porosity values (Figure 7a). Horizontal permeability displays robust negative correlation with grain density (Figure 7b). Type 1 facies has grain density values comparable with those of quartz (2.648 g/cm3; Schön, 1996), revealing minimal content of pore-occluding matrix and/or cement components. Permeability decreases progressively with increasing grain density values from rock Type 1 to rock Type 5 facies. The plot illustrates that the abovementioned permeability separation is associated with an increase in the grain density values reflecting a greater impact of pore-occluding components in the Abu Madi fluvial facies. The average water saturation records the highest value in the Abu Madi subaerial gravity-flow deposits and the lowest in the Qawasim proximal deltaic facies (Table 2), consistent with the permeability drop from Type 1 to Type 5 facies.
| Petrophysical properties | Qawasim proximal deltaic facies | Qawasim distal deltaic facies | Abu Madi subaerial gravity-flow facies | Abu Madi fluvial facies | Abu Madi estuarine facies | ||||||||||
|---|---|---|---|---|---|---|---|---|---|---|---|---|---|---|---|
| Max. | Min. | Mean | Max. | Min. | Mean | Max. | Min. | Mean | Max. | Min. | Mean | Max. | Min. | Mean | |
| Primary porosity (%) | 31.5 | 15.5 | 23.0 | 24.0 | 8.0 | 14.0 | 5.5 | 0.25 | 1.0 | 26.0 | 16.0 | 19.0 | 13.0 | 4.0 | 8.0 |
| Sec. porosity (%) | 3.0 | 0.1 | 1.3 | 2.0 | 0.1 | 0.6 | 0.75 | 0.2 | 0.35 | 2.5 | 0.1 | 1.4 | 1.6 | 0.1 | 0.4 |
| Helium porosity (%) | 33.4 | 21.4 | 29.1 | 31.2 | 6.7 | 24.2 | 8.57 | 2.0 | 5.21 | 33.2 | 21.8 | 27.75 | 29.1 | 4.6 | 22.8 |
| Hor. permeability (m.d.) | 11,399 | 2,192 | 6,114 | 2,453 | 0.5 | 750 | 1.30 | 0.2 | 0.72 | 1,342 | 236 | 596 | 245 | 0.01 | 87.0 |
| Ver. permeability (m.d.) | 10,220 | 1,553 | 5,222 | 4,085 | 0.1 | 500 | 13.6 | 0.1 | 2.91 | 1,136 | 13.4 | 438 | 170 | 0.01 | 62.0 |
| Grain density (g/cm3) | 2.67 | 2.6 | 2.64 | 2.8 | 2.6 | 2.67 | 2.85 | 2.72 | 2.75 | 2.74 | 2.64 | 2.66 | 2.74 | 2.6 | 2.68 |
| Water saturation (%) | 48.6 | 20.1 | 28.2 | 63.5 | 29.9 | 41.7 | 78.0 | 57.0 | 63.5 | 50.0 | 30.1 | 38.5 | 62.0 | 42.5 | 47.9 |
5 DISCUSSION
5.1 Diagenesis and diagenetic sequence
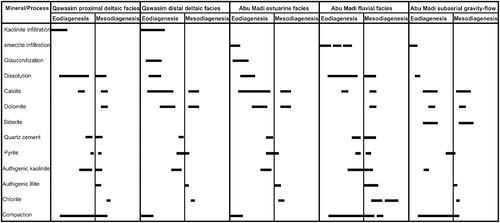
Textural relationships between the different authigenic components define the diagenetic history of the studied Messinian sedimentary facies (Figure 8). The final framework composition and reservoir quality of the Messinian facies are controlled by interplay between the diagenetic alterations both occurred near-surface (eodiagenesis) and during progressive burial (mesodiagenesis).
5.1.1 Eodiagenesis
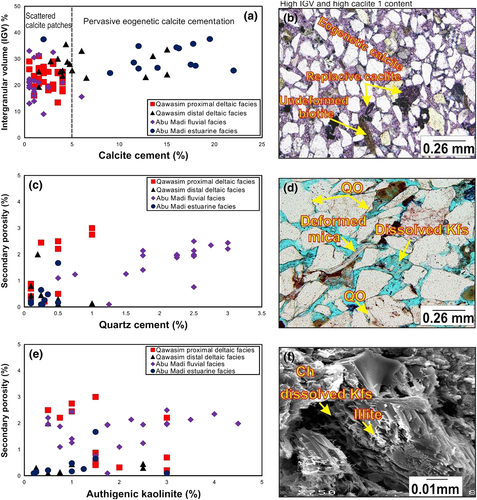
Mechanical clay infiltration is the first eodiagenetic process in the studied Messinian facies (Figure 8). Climatic oscillations in northern Africa during the Messinian (Griffin, 2002) influenced the infiltrated clay composition from kaolinitic in the pre-MSC Qawasim to smectitic aggregates in the MSC Abu Madi facies (e.g., Weaver, 1989). Evidence for mechanical infiltration includes (1) clay morphology in compacted loose and massive aggregates between the detrital grains (e.g., Moraes & De Ros, 1992) and (2) detachment of infiltrated smectite coatings during burial chloritization (Figure 6h, green arrow). Eodiagenetic glauconitization in the Qawasim distal deltaic and Abu Madi estuarine facies (Figure 8) is due to elevated iron supply with proximity to marine conditions (e.g., McRae, 1972; Odin & Matter, 1981). Glauconite authigenesis occurred after clay infiltration and prior to compaction (Figures 8 and 4d,h). Eodiagenetic precompactional calcite (Calcite 1) is also more pervasive in the Qawasim distal deltaic and Abu Madi estuarine facies due to relative availability of ions needed for carbonate cementation. The dark luminescence of Calcite 1 reflects its Fe-rich composition and formation in reducing geochemical conditions (e.g., Gonzalez- Acebrón et al., 2012). Evidence for Calcite 1 precompactional origin includes (1) loose packing and high intergranular volume (IGV) values (30–40%) in the Calcite 1-cemented facies (Figure 9a,b) and (2) presence of undeformed ductile grains in these facies (Figure 9b). Dolomite also has Fe-rich composition (Figure 6D), reflecting reducing geochemical conditions and a genetic relationship with the Fe-rich Calcite 1 (e.g., Berner, 1981). Siderite precipitation as a minor eodiagenetic phase in Abu Madi subaerial gravity-flow deposits is related to widespread weathering and erosion subsequent to their subaerial exposure during the onset of the MSC (e.g., Bensing, Mozley, & Dunbar, 2005).
Mechanical compaction occurred shortly after Calcite 1 precipitation (Figure 5). The Qawasim facies are poorly compacted with abundant point grain contacts (Figure 4a). On the other hand, sutured and concavo-convex contacts in Abu Madi fluvial facies indicate compaction (Figure 4f). Eodiagenetic dissolution of feldspars (Figures 4a,g and 6d,f), bioclasts (Figure 6a), and rock fragments (Figure 6d) occurred subsequent to mechanical compaction (Figure 8). Dissolution secondary pore spaces are prominent in the coarse-grained Qawasim proximal deltaic and Abu Madi fluvial facies (Table 2). In contrast, better preservation of unstable components (e.g., feldspars; Figure 4c) and low secondary porosity (Table 2) in the other facies are due to their fine-grained size and early eodiagenetic carbonate cementation, hampered sediment-meteoric water interaction. Pyrite cementation is mainly dependent on depositional facies rather than burial depth (Figure 5). Framboidal pyrite is mostly associated with infiltrated clays indicating its eodiagenetic authigenesis, whereas the euhedral morphotype often infills the dissolution pores (Figure 6h) reflecting its comparatively later authigenesis and likely monitoring FeS2 enrichment with enhanced burial (e.g., Taylor & Macquaker, 2000).
5.1.2 Mesodiagenesis
Mesodiagenetic chemical compaction is only recorded in the MSC Abu Madi fluvial facies, resulting in pervasive intergranular quartz dissolution and cementation (mean = 2.25; Table 1). In this facies, quartz cement content increases with depth (Figure 5), confirming a burial control. Pressure solution and dissolution of feldspars provided the silica for quartz cementation in the Abu Madi fluvial facies, as observed from the positive correlation between secondary porosity and quartz cement (Figure 9c) and pervasive quartz overgrowth in the compacted samples with deformed ductile mica (Figure 9d). Replacive calcite (Calcite 2) engulfs Calcite 1 (Figure 6a,b), replaces the detrital quartz grains, and partly infills secondary pore spaces (Figures 4b,h). Dissolution of bioclasts, their replacement by glauconite, and dissolution of calcitic fragments provided the ions for Calcite 2 precipitation (e.g., Carvalho, De Ros, & Gomes, 1995). Dolomite rhombs displaying multiple syntaxial overgrowths (Figure 6d) indicate continuous aggrading neomorphism from eodiagenesis to mesodiagenesis (Figure 8).
Kaolinite authigenesis occurred after eodiagenetic feldspar dissolution. Authigenic kaolinite content displays a similar trend with depth to secondary porosity (Figures 5 and 9e). Therefore, kaolinite authigenesis is mostly controlled by the incursion of meteoric water, which facilitated feldspar alteration and dissolution (Figure 6f,i;e.g., Morad, Marfil, & De la Pena, 1989). Incomplete illitization is recorded in the Qawasim facies resulting in formation of mesodiagenetic K-rich kaolinite as an intermediate phase between illite and kaolinite (Figure 6f,j). On the other hand, complete illitization is observed in the Abu Madi facies (Figure 6g). K-feldspar dissolution provided potassium ions for illite authigenesis (Figure 6g;e.g., Bjørkum & Gjelsvik, 1988). Preferential chlorite authigenesis in the Abu Madi fluvial facies seems to indicate both depositional and burial controls. The textural relationships between chlorite and kaolinite on the one hand (Figure 6g,h) and chlorite and infiltrated smectite on the other (Figure 6g,h) suggest the chloritization and formation of two different chlorite morphotypes (Figure 6k,l;e.g., Ehrenberg, 1993). These contain Si/Al ratios very similar to their precursors (Figure 6k,l). Chloritization of kaolinite occurs at burial temperatures around 110°C in iron-rich systems (Curtis, Hughes, Whiteman, & Whittle, 1985). Therefore, it is more common in the comparatively deeper Abu Madi facies (Table 1). A triggering factor for chloritization in the Abu Madi fluvial facies is the local presence of detrital iron exsolutions in pyroxenes (Figure 6h) in the vicinity of the chloritized kaolinite, which provided the iron ions for chlorite authigenesis.
5.2 Depositional and petrophysical controls on seismic response
Seismic facies parameters (e.g., configuration, amplitude, frequency, and continuity) are mainly functions of sediment composition and depositional environment (e.g., Cooke, Sena, O'Donnell, Muryanto, & Ball, 1999). The root mean square (RMS) amplitude seismic attribute is frequently used as an important seismic indicator for tracking lithological changes and reservoir quality variations (e.g., Chen & Sidney, 1997; Radovich & Oliveros, 1998). The RMS seismic amplitude map of the Qawasim proximal deltaic units clearly illustrates high-amplitude anomalies oriented in the distributary channel-fill and mouthbar facies (Figure 10a). On the other hand, the map of the distal deltaic facies highlights small scattered high-amplitude anomalies embedded in a low-amplitude background. These represent the distal sand bars emplaced in the distal parts of the delta-front (Figure 10b). Accordingly, the notable variation in seismic amplitude is virtually controlled by deltaic progradation as well as the upward coarsening and increasing in reservoir quality (porosity and permeability). In the MSC Abu Madi facies, the subaerial gravity-flow deposits have very low-amplitude characteristics reflecting their heterolithic sandy muddy composition with very low reservoir quality (Figure 11a). In contrast, the middle-infill unit constitutes high-amplitude facies confined to the canyon–thalweg, corresponding to the fluvial channel bar complexes (Figure 11b). The upper unit contains scattered bodies generating comparatively lower amplitude reflections (Figure 11c), however still confined to the canyon. These represent tidal sand bars and estuarine channel-fill sandstones in the upper infill estuarine unit (Leila & Moscariello, 2016).
5.3 Depositional and burial implications on reservoir quality
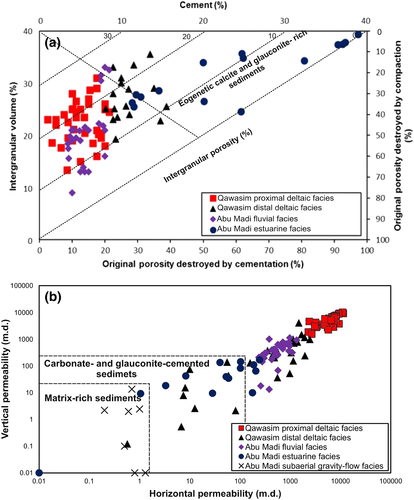
Depositional attributes (grain size and matrix content) induce major influences on facies permeability (Ramm, 1992). Indeed, the coarse-grained facies with minimal matrix content have the higher permeability (Figure 12a,b). Low matrix contents in the Qawasim proximal deltaic facies aided preservation of its IGV. Conversely, elevated matrix contents (mainly smectite) in the Abu Madi fluvial facies reduced the IGV and the overall permeability (Figure 12b). The different depositional setting controlled the Messinian facies diagenetic pathways. Among these are the eodiagenetic glauconite and calcite authigenesis in the Qawasim distal deltaic and Abu Madi estuarine facies, which deteriorated their permeability values (Figure 12c,d). Despite the beneficial impact of precompactional Calcite 1 in supporting the facies framework against mechanical compaction and hence increasing the IGV values, pervasive precipitation of Calcite 1 blocked the intergranular pore spaces. Therefore, the reservoir quality of these facies was completely obliterated during eodiagenesis (Figure 12d). Accordingly, the best reservoir quality facies within the Nile Delta Messinian sequence are those containing few scattered patches of Calcite 1, which preserved the IGV (Figure 12d).
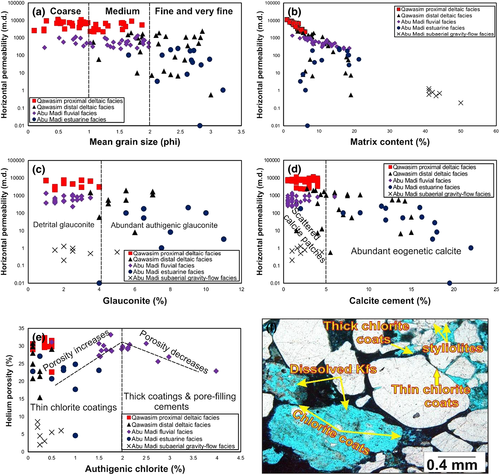
Permeability separation between the Qawasim proximal deltaic and Abu Madi fluvial facies (despite their similar porosity [Figure 7a] and mean size: see Figure 12a) highlights the impacts of diagenetic attributes on reservoir quality. In the Qawasim proximal deltaic facies, no permeability-depth trend is observed, whereas a decreasing trend is recorded in Abu Madi fluvial facies. This is due to the enhanced mesodiagenetic processes (e.g., quartz cementation, chemical compaction, illitization, and chloritization) in the Abu Madi fluvial facies. Smectite infiltration in the Abu Madi fluvial facies promoted intergranular quartz dissolution and chemical compaction (e.g., Tournier, Pagel, Portier, Wazir, & Fiet, 2010). Therefore, smectite chloritization was beneficial to reservoir quality in the Abu Madi fluvial facies (e.g., Pittman, Larese, & Heald, 1992). However, two opposite impacts of authigenic chlorite on reservoir quality were observed (Figure 12e,f). Porosity increases with chlorite content up to 2% and then abruptly decreases (Figure 12e). Thus, chlorite coatings are beneficial at a content of 2%; otherwise, they tend to obstruct the pore throats and reduce the porosity values (Figure 12f). Other detrimental burial attributes are mechanical and chemical compaction/reduction in pore space (Figure 13a). Accordingly, the moderately compacted and loosely cemented (cement content <10%) of the pre-MSC Qawasim proximal deltaic sediments corresponds to the best reservoir quality facies (Figure 13a). Moreover, abundant chlorite coatings, which occupy a small volume of the pore spaces, obstruct the pore throats and hence decrease permeability (e.g., Loucks et al., 1984) and thus explain the permeability separation between the Qawasim proximal deltaic and Abu Madi fluvial facies. The robust correlation between horizontal and vertical permeability (Figure 13b) reflects low permeability anisotropy of the Qawasim proximal deltaic and the heterogeneity of the Abu Madi fluvial facies. This heterogeneity is mostly related to its deeper burial and relative abundance of chlorite with its detrimental and beneficial impacts.
6 CONCLUSIONS
- Spatio-temporal distributions of diagenetic processes are controlled by depositional setting. The Messinian facies with proximity to marine conditions lost their reservoir quality during eodiagenesis by glauconite and calcite authigenesis.
- High seismic RMS amplitude anomalies are restricted to the coarse-grained, porous, and permeable facies, and therefore, this attribute provides an excellent indicator for reservoir quality.
- The reservoir quality of the continental sediments is very sensitive to climatic conditions, which controlled the composition of infiltrated clays. Arid climates during the MSC facilitated multiple-cycle infiltration of smectite, which enhanced quartz dissolution and cementation (mean = 2.25%) in the Abu Madi fluvial facies.
- Mesodiagenetic chloritization of smectite in Abu Madi fluvial facies hampered its detrimental impact. However, chlorite cements (>2%) and thick coatings are detrimental to facies permeability.
- In the continental and marginal marine depositional systems, the best reservoir quality facies were those that accumulated in high-energy depositional settings with limited marine influence, hindering pervasive eodiagenetic glauconite and calcite authigenesis.
- The integrated approach used in this study revealed a successful method for predicting reservoir quality and thus reducing the uncertainties in hydrocarbon exploration and production activities in the Nile Delta and similar reservoir analogues in mixed continental and coastal marine systems.
ACKNOWLEDGEMENTS
The authors would like to thank the Egyptian General Petroleum Corporation (EGPC) and Mansoura Petroleum Company, Egypt, for providing the required data and materials. Also, we wish to thank the Egyptian Ministry of Higher Education and Scientific Research for funding this study. We want to acknowledge the anonymous reviewers, the Geological Journal editorial board, and Dr Alastair Ruffell for their constructive comments and editorial handling, which highly improved the quality of this paper.


