Micropalaeontological and isotopic analyses of the middle Palaeocene succession at Gebel Nezzi (Luxor, Egypt): Implications for eustatic changes
Abstract
Gebel Nezzi (Upper Nile Valley, Egypt) was chosen to study the middle Palaeocene planktonic foraminiferans, nannoplankton contents, benthic foraminiferans, and stable isotopes to provide additional information into sea-level changes. Two negative excursions are recorded that are associated with a sharp change in palaeoenvironmental conditions, representing significant global palaeoceanographic, palaeoclimatic, and eustatic events observed at other sites around the world. They are characterized by a drop in total foraminiferal abundance associated with a drop in the type, species richness, frequency, and diversity of foraminifers. The first negative excursion of −0.6‰ δ13C and −0.5 δ18O occurs during the Late Danian Event (LDE) almost near the upper part of the planktonic foraminiferal P3a Subzone and within the calcareous nannofossil NTp8A Subzone at the top of the lower third of Chron C26r. It is dominated by shallow-water benthic foraminiferans of the Neoeponides duwi biofacies. The Danian-Selandian boundary lies directly above the LDE within the top of the nannofossil Zone NP4, and within the planktonic foraminiferal Subzone P3b with significant increases in angular morozovellids associated with the earliest Cenozoic hyperthermals. The second negative excursion of −0.6‰ δ13C and −2.2 δ18O occurs near the top of the Dakhla Formation and is dominated by the benthic foraminiferal Bulimina farafraensis biofacies within the upper part of the calcareous nannofossil NTp9 Subzone and upper part of the planktonic foraminiferal P4a Subzone. These negative excursions associated with a well-known falling sea level and are an important tool for regional correlation. Fluctuations in the foraminiferal population, benthic biofacies, δ 13C and δ18O isotopes and carbonate content reflect three fourth-order transgressive–regressive (T–R) sequences response to eustatic changes in the Egyptian stable tectonic shelf.
1 INTRODUCTION
The Danian/Selandian (D/S) transition is one of the most interesting and intensively investigated time intervals due to major changes that occurred in the global climate and carbon cycle associated with the earliest Cenozoic hyperthermals (e.g., Bornemann et al., 2009; Kennett & Stott, 1990; Miller, Fairbanks, & Mountain, 1987; Speijer, 2003; Sprong et al., 2013; Westerhold et al., 2008; Zachos, Lohmann, Walker, & Wise, 1993). A large amount of previous stratigraphic and palaeontological studies have been presented on sections in the Upper Nile Valley of Egypt, especially after the assignment of the global stratotype section and point (GSSP) for the base Eocene in Egypt (e.g., Aubry et al., 2007; Berggren et al., 2012; Dupuis & Knox, 2013; El-Naggar, 1966; King, 2013; Speijer & Schmitz, 1998; Youssef, 2009).
However, a reliable correlation of the microplanktonic bioevents is characterized by many discrepancies and is still a matter of debate at different palaeolatitudes (Faris & Farouk, 2012; Farouk & Faris, 2013; Farouk, 2016) even after the GSSP for the Danian/Selandian boundary was defined in the Zumaia section (northern Spain), using various criteria (Schmitz et al., 2011). According to the GSSP, the base of the Selandian occurs in the Zumaia section within the lower part of nannofossil Subzone NTp8b marked by the end of the acme of the nannofossil family Braarudosphaeraceae and within the planktonic foraminifera P3a Subzone (Schmitz et al., 2011). In Egypt, the Braarudosphaeraceae acme is not applicable to the Tethyan sections, while the base Selandian occurs within the planktonic foraminifera P3b Subzone (Bernaola, Martin-Rubio, & Baceta, 2009; Faris & Farouk, 2012, 2013; Farouk, 2016; Sprong et al., 2012; Youssef, 2009). In the Shatsky Rise (Pacific Ocean), the Igorina albeari marker of P3b Subzone is reported below the base of the Selandian (Jehle, Bornemann, Deprez, & Speijer, 2015). These variations are attributed by some authors to taxonomically different concepts (Arenillas, 2011; Orue-Etxebarria, Apellaniz, & Caballero, 2007) or to the recording of these bioevents from different palaeolatitudes reflecting different palaeoclimatology and palaeoenvironments that consequently show considerable variations in age (Farouk & Faris, 2013). Farouk (2016) noted that the discrepancies in global correlation may, in part, be due to differences in bioevents and biozonation schemes, which need in the future to be resolved by a new, high-resolution calibration of biostratigraphic, sequence stratigraphic, and carbon-isotope investigations.
Ruban, Zorina, Conrad, and Afanasieva (2012) mentioned that the Danian–Selandian sea-level fluctuations remain a debated subject and that relative sea-level trends should be distinguished from the shoreline shifts and/or tectonic activity. They reviewed previously synthesized data of the transgressive–regressive curve from seven tectonically “stable” regions, namely, the eastern Russian Platform, northwestern Europe, northeastern Africa, northwestern Africa, the Arabian Platform, the northern Gulf of Mexico, and southern Australia, with the conclusion that there are no common patterns between such data. The regional correlation at different palaeolatitudes with different concepts of integrated biostratigraphy calibrated with global climate and carbon cycle changes, as well as the opportunity to place them in a high-resolution chronologic framework may be the main reason for the debates.
In this paper, a new δ13C and δ18O stable-isotope profile calibrated with an integrated microplanktonic biostratigraphy and sea-level curve for a hemipelagic section at Gebel Nezzi is correlated with previously published results. It is argued that major shifts in δ13C profiles are related to changes in eustatic sea level, and as a consequence provide robust chronostratigraphic trends that offer potential for intercontinental correlation independent of biostratigraphy (Jarvis, Mabrouk, Moody, & DE Cabrera, 2002).
The present study aims to (a) recalibrate the calcareous nannofossil and planktonic foraminiferal bioevents across the Danian–Selandian transition using a new δ13C record from Gebel Nezzi section and then correlating these globally with other palaeolatitude provinces; (b) provide qualitative and quantitative data of foraminiferal assemblages to detect palaeoenvironmental changes and hence interpret the relative sea-level variations; and (c) correlate the relative sea level with the local and global cycle charts to distinguish the eustatic signatures from tectonic events.
2 MATERIALS AND METHODS
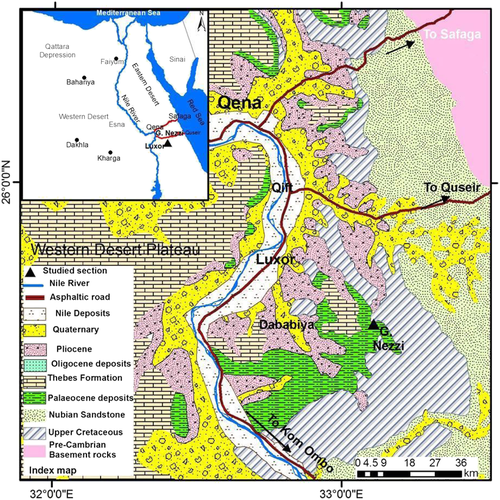
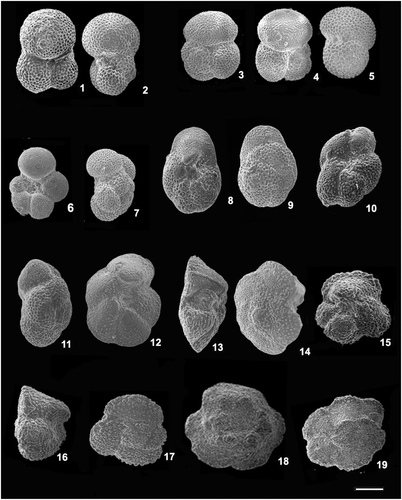
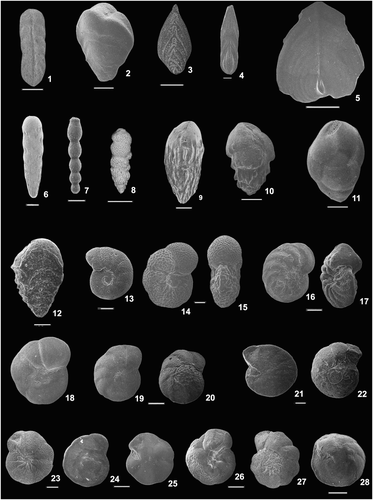
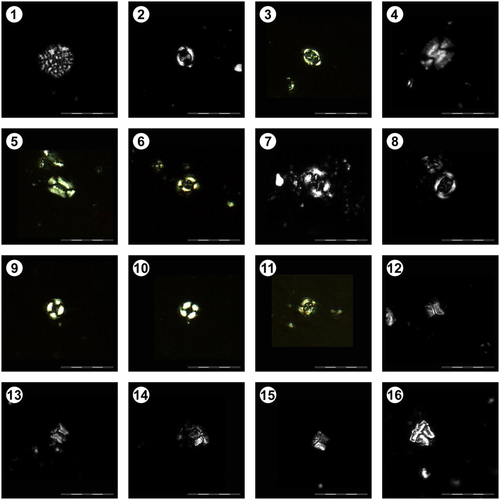
Forty-five samples collected from about 17 m thickness at Gebel Nezzi, southeast Luxor (31°02′17″N; 35°34′55″E; Figure 1), sampled at intervals from 0.25 to 0.5 m. These samples were examined for their calcareous nannofossil and foraminiferal taxa (planktonic and benthonic). To separate the foraminiferal tests, samples were soaked in a Na2CO3 solution, washed over 125 and 63 μm sieves, and then dried in a stove at 60°C. The 125–63 μm fraction was investigated qualitatively and quantitatively under a binocular zoom stereomicroscope to determine the foraminiferal assemblage and to reconstruct the palaeobathymetry and palaeoenvironments. Benthic foraminiferal assemblages were analysed quantitatively to interpret the sea-level fluctuations and depositional environments. The major and important benthic foraminiferal quantitative frequency data (more than 5‰) is subjected to Q-mode factor analysis. The factors obtained were rotated using a Varimax Factor rotation using Systat 5.2.1. The most important benthic foraminifers were photographed using scanning electron microscopy at South Valley University (Figures 2 and 3). The calcareous nannofossils were studied following the method of Geisen, Bollmann, Herrle, Mutterlose, and Young (1999). The slides were examined and photographed (Figure 4) using a light microscope (Leica DM 2700) at 1,000× or 1,600× magnification.
The total carbon (TC) and total organic carbon (TOC) content was measured by a carbon analyser (LECO SC632 device) after the removal of carbonates by 10% hydrochloric acid in the Egyptian Petroleum Institute central laboratory. CaCO3 content (Table 1) was calculated from these measurements through: CaCO3 = 8.3333*(Ctot−TOC).
| Sample number | Total foraminiferal number per gram | Number benthic foraminifera | Number planktonic foraminifera | Calcareous test % | Planktonic % | Epifaunal | Inifaunal | Epifaunal % | Species benthic richness | Heterogeneity Shannon-Weaver H(S) | Fisher's α | δ13C VPDB | δ18O VPDB | %TC Wt | %TOC Wt | %CaCo3 |
|---|---|---|---|---|---|---|---|---|---|---|---|---|---|---|---|---|
| 75 | 153 | 64 | 88 | 93 | 58 | 153 | 48 | 76 | 41 | 3.263 | 12.1 | 1.39 | −2.8 | 10.8 | 0.25 | 88.1 |
| 74 | 9 | 9 | 2 | 92 | 44 | 173 | 47 | 79 | 41 | 3.357 | 14.9 | 1.16 | −3.1 | 12 | 0.22 | 98.3 |
| 73 | 45 | 21 | 24 | 93 | 55 | 214 | 54 | 80 | 47 | 3.363 | 16.5 | 1.08 | −3.3 | 12.2 | 0.22 | 99.6 |
| 72 | 6 | 2 | 3 | 100 | 55 | 100 | 18 | 85 | 28 | 2.813 | 11.6 | 1.36 | −2.1 | 12.3 | 0.22 | 100 |
| 71 | 128 | 35 | 94 | 90 | 74 | 157 | 59 | 73 | 41 | 3.279 | 15.1 | 1.36 | −2.1 | 12.1 | 0.22 | 98.8 |
| 70 | 97 | 34 | 63 | 90 | 66 | 111 | 99 | 53 | 37 | 3.201 | 13 | 0.25 | −5 | 12.3 | 0.22 | 100 |
| 69 | 536 | 133 | 403 | 88 | 75 | 104 | 104 | 50 | 41 | 3.282 | 15.3 | 0.11 | −4.8 | 11.2 | 0.32 | 90.8 |
| 68 | 281 | 65 | 216 | 89 | 76 | 141 | 61 | 70 | 31 | 3.191 | 10.2 | 0.37 | −3.3 | 9.1 | 0.11 | 74.9 |
| 67 | 136 | 42 | 94 | 91 | 65 | 123 | 140 | 47 | 38 | 2.895 | 12.1 | 0.2 | −3.4 | 10.2 | 0.1 | 83.9 |
| 66 | 60 | 40 | 20 | 85 | 36 | 125 | 123 | 50 | 40 | 2.946 | 13.5 | −0.4 | −5.4 | 9.5 | 0.11 | 78.3 |
| 65 | 29 | 23 | 6 | 75 | 19 | 160 | 133 | 55 | 44 | 3.197 | 14.6 | 0.25 | −3.2 | 10.2 | 0.11 | 83.8 |
| 64 | 193 | 67 | 127 | 93 | 59 | 110 | 98 | 53 | 29 | 2.721 | 9.16 | 0.26 | −3.7 | 9.17 | 0.11 | 75.5 |
| 63 | 63 | 20 | 43 | 88 | 69 | 139 | 107 | 57 | 42 | 3.254 | 14.6 | 0.52 | −2.9 | 9.17 | 0.11 | 75.5 |
| 62 | 82 | 33 | 49 | 82 | 60 | 132 | 72 | 65 | 39 | 3.234 | 14.3 | 0.26 | −2.8 | 10.2 | 0.11 | 83.8 |
| 61 | 79 | 50 | 29 | 84 | 37 | 148 | 167 | 47 | 50 | 3.243 | 16.7 | −0.2 | −3.3 | 10.1 | 0.11 | 83.3 |
| 60 | 129 | 34 | 95 | 91 | 72 | 82 | 129 | 39 | 39 | 2.882 | 14.1 | −0.2 | −4 | 10.2 | 0.11 | 83.8 |
| 59 | 213 | 65 | 148 | 94 | 61 | 166 | 38 | 81 | 31 | 3.111 | 10.2 | −0.3 | −2.9 | 5.91 | 0.09 | 48.5 |
| 58 | 112 | 32 | 80 | 85 | 70 | 147 | 54 | 73 | 41 | 3.329 | 15.6 | −0.4 | −3 | 5.89 | 0.35 | 46.1 |
| 57 | 220 | 65 | 155 | 97 | 64 | 145 | 57 | 72 | 40 | 3.2 | 15 | −0.3 | −3.9 | 6.19 | 0.07 | 51 |
| 56 | 533 | 64 | 469 | 89 | 82 | 147 | 54 | 73 | 37 | 3.166 | 13.3 | −0.3 | −3.7 | 5.17 | 0.19 | 41.5 |
| 55 | 168 | 38 | 130 | 88 | 74 | 153 | 86 | 64 | 42 | 3.334 | 14.8 | −0.9 | −3.9 | 6.07 | 0.19 | 49 |
| 54 | 412 | 68 | 345 | 90 | 80 | 141 | 71 | 67 | 35 | 3.147 | 11.9 | −0.6 | −4.1 | 5.77 | 0.23 | 46.2 |
| 53 | 210 | 64 | 145 | 90 | 70 | 103 | 98 | 51 | 39 | 2.848 | 14.4 | −0.8 | −3.8 | 5.77 | 0.23 | 46.2 |
| 52 | 435 | 130 | 305 | 87 | 73 | 122 | 81 | 60 | 31 | 2.968 | 10.2 | −0.5 | −3.7 | 5.77 | 0.23 | 46.2 |
| 51 | 25 | 8 | 16 | 85 | 62 | 133 | 71 | 65 | 47 | 3.321 | 19.1 | −0.5 | −2.9 | 5.77 | 0.23 | 46.2 |
| 50 | 37 | 11 | 26 | 86 | 63 | 192 | 76 | 72 | 43 | 3.109 | 14.5 | −0.5 | −2.5 | 5.28 | 0.12 | 43 |
| 49 | 164 | 11 | 153 | 91 | 61 | 241 | 45 | 84 | 41 | 3.166 | 13.1 | −1.3 | −3.5 | 10.6 | 0.06 | 88.1 |
| 48 | 64 | 11 | 53 | 90 | 75 | 237 | 45 | 84 | 43 | 3.138 | 14.1 | −0.5 | −2.2 | 2.84 | 0.1 | 22.8 |
| 47 | 434 | 84 | 349 | 94 | 73 | 223 | 41 | 84 | 39 | 2.79 | 12.6 | −1.2 | −3.2 | 2.04 | 0.21 | 15.2 |
| 46 | 2 | 1 | 1 | 38 | 11 | 4 | 49 | 8 | 6 | 1.234 | 1.74 | −1.2 | −3.8 | 0.7 | 0.1 | 4.99 |
| 45 | 104 | 93 | 11 | 100 | 10 | 251 | 39 | 87 | 14 | 0.6073 | 3.07 | −1.2 | −3.8 | 1.25 | 0.13 | 9.35 |
| 44 | 0 | 0 | 0 | 46 | 0 | 4 | 9 | 31 | 7 | 1.778 | 6.18 | −0.6 | −3.8 | 2 | 0.27 | 14.4 |
| 43 | 42 | 21 | 21 | 91 | 48 | 214 | 53 | 80 | 40 | 3.187 | 13 | −0.6 | −3.8 | 2.16 | 0.27 | 15.8 |
| 42 | 26 | 19 | 7 | 92 | 25 | 189 | 43 | 81 | 39 | 3.127 | 13.4 | −1.1 | −4.4 | 2.26 | 0.15 | 17.6 |
| 41 | 269 | 69 | 199 | 88 | 73 | 181 | 36 | 83 | 42 | 3.165 | 15.5 | −0.8 | −3.6 | 2.26 | 0.15 | 17.6 |
| 40 | 348 | 85 | 263 | 86 | 74 | 216 | 50 | 81 | 38 | 3.157 | 12.1 | −1.4 | −4 | 2.26 | 0.15 | 17.6 |
| 39 | 116 | 36 | 80 | 88 | 59 | 167 | 58 | 74 | 39 | 3.353 | 13.6 | −1 | −3.6 | 2.26 | 0.15 | 17.6 |
| 38 | 421 | 68 | 354 | 87 | 82 | 166 | 45 | 79 | 39 | 3.215 | 14.1 | −0.5 | −2.6 | 3.42 | 0.14 | 27.3 |
| 37 | 712 | 161 | 552 | 41 | 66 | 158 | 93 | 63 | 37 | 3.055 | 12 | −0.9 | −3.3 | 3.42 | 0.14 | 27.3 |
| 36 | 6 | 5 | 0 | 53 | 3 | 112 | 159 | 41 | 37 | 2.844 | 11.6 | −1.2 | −1.6 | 3.42 | 0.14 | 27.3 |
| 35 | 42 | 9 | 34 | 84 | 73 | 158 | 62 | 72 | 38 | 3.265 | 13.3 | −0.4 | −1.7 | 3.3 | 0.17 | 26.1 |
| 34 | 57 | 26 | 32 | 42 | 54 | 241 | 82 | 75 | 40 | 3.233 | 12 | −0.2 | −2.8 | 3.3 | 0.17 | 26.1 |
| 33 | 405 | 33 | 372 | 91 | 76 | 131 | 77 | 63 | 41 | 3.275 | 15.3 | −0.8 | −3.8 | 3.3 | 0.17 | 26.1 |
| 32 | 66 | 18 | 48 | 77 | 58 | 157 | 68 | 70 | 42 | 3.199 | 15.2 | −0.5 | −3.7 | 1.43 | 0.16 | 10.6 |
| 31 | 1220 | 129 | 1091 | 88 | 87 | 138 | 64 | 68 | 42 | 3.363 | 16.1 | −1 | −4.9 | 3.3 | 0.17 | 26.1 |
| 30 | 461 | 32 | 429 | 86 | 93 | 132 | 70 | 65 | 39 | 3.136 | 14.4 | −0.8 | −4 | 3.3 | 0.16 | 26.2 |
| 29 | 514 | 71 | 444 | 85 | 85 | 152 | 69 | 69 | 35 | 3.163 | 11.7 | −0.7 | −3.5 | 3.3 | 0.17 | 26.1 |
Stable isotope analyses of δ13C and δ18O were performed on well-preserved specimens of the Cibicidoides and Neoeponides duwi benthic foraminifers in the Environmental Isotope Laboratory, Department of Geosciences, University of Arizona using an automated carbonate preparation device (KIEL-III) coupled to a gas-ratio mass spectrometer (Finnigan MAT 252). Foraminiferal parameters such as the total foraminiferal number (planktonic and benthic) in 1 g of dry sediment, planktonic/benthic ratio (P/B), agglutinated/calcareous benthic ratio, and benthic foraminiferal biofacies and their species richness and diversity index are used in the present study for determining the palaeo-water depth (e.g., El Deeb, 1995; Farouk, Elamri, & El-Sorogy, 2016; Speijer, 2003).
3 LITHOSTRATIGRAPHY
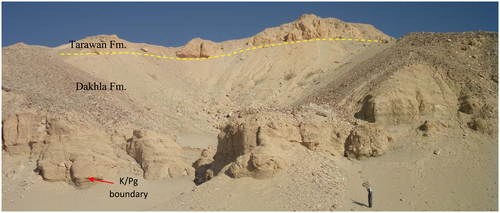
The Palaeocene succession at Gebel Nezzi was deposited on a passive margin at the southern edge of the Tethys (Neotethys) Ocean, on a tectonic stable shelf of Egypt. The exposed succession in Gebel Nezzi comprises the Dakhla (Maastrichtian–Palaeocene), Tarawan (Thanetian), Esna Shale (Thanetian–Ypresian), and Thebes Limestone (Ypresian) formations. The Dakhla Formation in the Nile Valley. It unconformably overlies the Campanian Duwi Formation by a sharp lithological break and, in turn, is unconformably overlain by the Tarawan Formation. The Dakhla Formation in central and southern Egypt can be easily subdivided into three formal members (e.g., Awad & Ghobrial, 1965; El-Naggar, 1966; Farouk, 2015). Dupuis and Knox (2013) mentioned that the subdivisions and terminology of the Dakhla Formation in the Western Desert cannot been applied to the exposures in the Eastern Desert or Nile Valley areas, and they subdivided it into three members: Member A, Member B, and Member C, in ascending order. The Danian–Selandian (D/S) boundary occurs within Member C, which consists mainly of grey fissile shale grading upward to yellowish grey marl with worm tubes, and dark to medium grey calcareous claystone. The base Tarawan Formation is marked by bioturbation and irregular surface associated with vertical facies change near the Dakhla/Tarawan formational boundaries (Figure 5). It is composed of chalky limestone with chert nodules grading upward to argillaceous limestone (Figure 5).
4 BIOSTRATIGRAPHY
4.1 Calcareous nannofossils
The quantitative calcareous nannofossil study was performed for the whole interval (Figure 7). Medium to well-preserved calcareous nannofossil assemblages were recorded. The absolute abundance of the calcareous nannofossil is (0.001–0.7*109/gm sediment; Figure 7). The studied interval extends from Zone NP4 to Zone NP6 according to Martini (1971). The calcareous nannofossil zonation of Varol (1989) has proved to be an excellent tool for subdividing Martini's scheme (Martini, 1971), which classified the standard nannofossil Zone NP4 into three zones (NTp6, NTp7, and NTp8) and five subzones (NTp7A, NTp7B, NTp8A, NTp8B, and NTp8C) and NTp9 of NP5 which have been accurately identified in the southern Tethys (Farouk & Faris, 2013; Guasti, Speijer, Brinkhuis, Smit, & Steurbaut, 2006; Steurbaut, Dupuis, Arenillas, Molina, & Matmati, 2000; Van Itterbeeck, Sprong, Dupuis, Speijer, & Steurbaut, 2007; Youssef, 2009).
The boundaries of these zones are marked by the highest occurrence (HO) of Neochiastozygus eosaepes (NTp6/NTp7A), and the lowest occurrence (LO) of Chiasmolithus dentulus (NTp7A/NTp7B) and Sphenolithus primus (NTp7B/NTp8A), Lithoptychius billii/ulii (NTp8A/NTp8B), and Fasciculithus janii/pileatus (NTp8B/NTp8C), respectively (Figures 6 and 7). The D/S boundary occurs at the NTp8B/ NTp8C subzonal boundary. It is marked by LOs of the second radiation Lithoptychius (L. billii and L. ulii), which represents the best event for global correlation (Farouk & Faris, 2013; Schmitz et al., 2011).
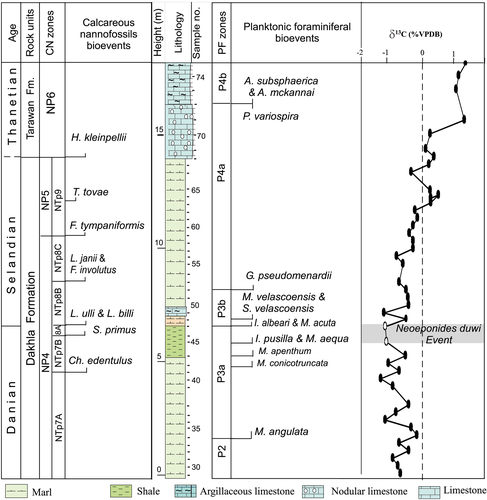
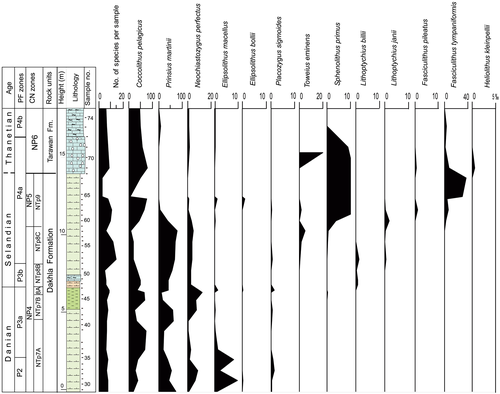
The NP5/NP6 boundary is delineated by the lowest occurrence of Heliolithus kleinpellii at the Dakhla/Tarawan formational boundary. The marker species is rarely recorded; only in Sample 69 (Figure 7).
4.2 Planktonic foraminiferans
Planktonic foraminiferans are extremely varied in their preservation, abundance, species richness, and diversity. The studied interval extends from the Zone P2 to the P4 according to the zonal scheme of Berggren and Pearson (2005) and Wade, Pearson, Berggren, and Pälike (2011). The Praemurica uncinata (P2) Zone is represented at a biostratigraphic interval from the LO of P. uncinata to the LO of Morozovella angulata. It is recorded in the lower part of the studied section (Samples 29 to 35). The recorded dominant planktonic foraminiferal species in Zone P2 are P. uncinata, P. inconstans, and Parasubbotina pseudobulloides. The Morozovella angulata (P3) Zone is defined as a biostratigraphic interval between the LO of M. angulata and the LO of Globanomalina pseudomenardii (Figures 6 and 8). Zone P3 is subdivided into two subzones: the Igorina pusilla Subzone (P3a) and the I. albeari Subzone (P3b). The boundary between them are marked by the LO of I. albeari.
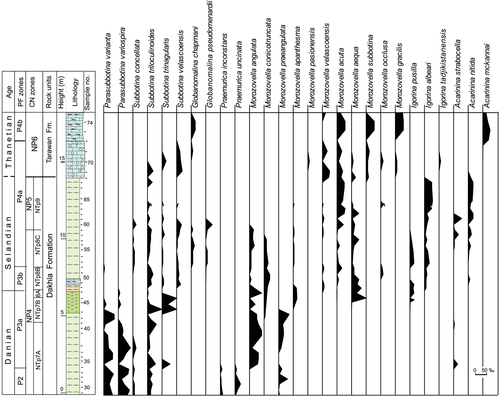
The LO of Igorina pusilla, Morozovella aequa, and M. acuta are recorded in the present study in the upper part of Subzone P3a (Figures 6, 8, and 9). They are reported in the Middle East and Spain by Guasti et al. (2006), Arenillas (2011), and in Egypt by Farouk and Faris (2013) in the P3b Subzone. In the present study, the LO of Morozovella aequa is recognized within the uppermost part of Subzone P3a correlating with the upper part of calcareous nannofossil Subzone NTp7B (Figures 6, 8, and 9).
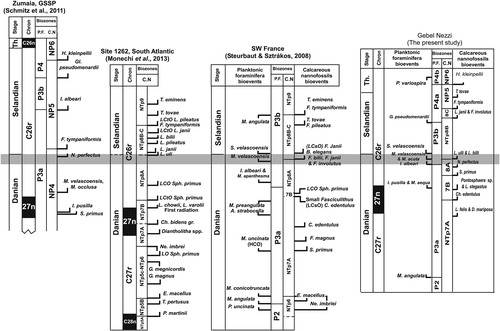
Planktonic assemblages of the Subzone P3b (Samples 47 to 52) are dominated by morozovellids with angular conical chambers and, in addition to marker species, many new species are recorded in this subzone, which are from older to younger: M. conicotruncata, M. apanthesma, M. velascoensis, M. occulusa, and Subbotina velascoensis. The D/S boundary in the present study is suggested at the P3a/P3b boundary close to calcareous nannofossil NTp8A/NTp8B boundary as recorded by several previous authors in Egypt (e.g., Berggren et al., 2012; Sprong et al., 2012; Steurbaut & Sztrakos, 2008).
The G. pseudomenardii (P4) Zone (Samples 53 to 74) is classified into three subzones, P4a, P4b, and P4c. The zonation relies on the following markers: the LO of G. pseudomenardii identifies the base of Subzone P4a, the HO of Parasubbotina variospira identifies the base of Subzone P4b, and the LO of Acarinina soldadoensis identifies the base of Subzone P4c. The P3b/P4 Zonal boundary occurs in the upper part of the Dakhla Formation just below the base of the Tarawan Formation (Farouk, 2016).
The dominant species in the P4a Subzone are Morozovella acuta, M. aequa, M. velascoensis, M. lacerti, Acarinina mckannai, Subbotina velascoensis, S. compressaformis, and Parasubbotina variospira. Traditionally, the LO of G. pseudomenardii is approximately simultaneous within upper most part of the calcareous nannofossil Zone NP5 (e.g., Baceta, Pujalte, Serra-Kiel, Robador, & Orue- Etxebarria, 2004; Berggren & Pearson, 2005; Dinarès-Turell, Baceta, Bernaola, Orue-Etxebarria, & Pujalte, 2007; Schmitz et al., 2011). On the other hand, Farouk and Faris (2013) noted that small specimens (<125 μm) of G. pseudomenardii have been found within the topmost part of calcareous nannofossil Zone NP4 (NTp8B) slightly above the LO of Morozovella velascoensis, which is confirmed in the present study (Figures 6, 8, and 9). A similar occurrence was also reported by Sprong, Speijer, and Steurbaut (2009) in the southern Tethys.
5 CARBON AND OXYGEN ISOTOPE RESULTS
Diagenetic alteration can easily affect δ18O and δ13C values. Well-preserved foraminiferal tests tend to be partially recrystallized with up to 50% diagenetic calcite (Jehle et al., 2015; Keller, 2002; Pearson et al., 2001; Stap, Lourens, van Dijk, Schouten, & Thomas, 2010). Cibicidoides spp. is an epibenthic foraminiferal species of great importance in stable isotopic palaeoceanographic studies and less affected by diagenesis (Keller, 2002; Mackensen & Licari, 2003; Zahn, Winn, & Sarnthein, 1986). Cibicidoides spp. is well preserved and abundant in all the studied intervals at Gebel Nezzi, except in the upper Danian (Samples 46 and 47), where Neoeponides duwi dominates. δ18O records are even more susceptible to diagenesis, although trends and amplitude of changes are largely preserved (Pearson et al., 2001; Sexton, Wilson, & Pearson, 2006). However, carbon isotope differentiation between species tends to occur during diagenesis (Keller, 2002). Therefore, we consider δ13C to be largely unaltered and suitable for regional correlation (Figures 6 and 10).
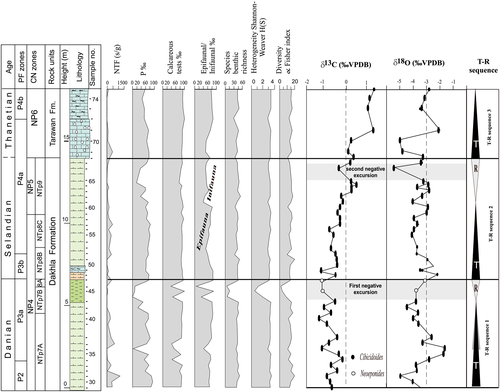
δ13C and δ18O values in well-preserved Cibicidoides spp. and Neoeponides duwi benthic foraminifera at Gebel Nezzi regularly alternate between −1.3‰ to 1.36‰ and −4.98 to −1.62, respectively (Figures 6 and 10). The δ13C curve starts with −0.71‰ and decreases gradually upward to −0.97‰, while δ18O starts with −3.45‰ and also decreases upward to −4.94‰, correlating with the upper part of planktonic foraminifera P2 Zone and within NTp7A Subzone (Figure 6). A slight increase of δ13C with oscillations from −0.75‰ to −0.37‰, and also an increase in the δ18O from −3.78‰ to −1.70‰ are observed in the upper part of planktonic foraminifera P3a Subzone (Figures 6 and 10). An observed decrease in δ13C values is observed upward with regularly alternating from −0.45‰ to −1.22‰ with δ18O, ranging from −1.62‰ to −4.44‰.
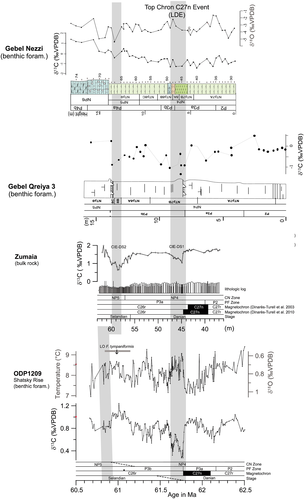
The sudden decrease in δ13C and δ18O from −0.56‰ to −1.66‰, with δ18O reach to −4.15‰ characterizes the Late Danian Event (LDE) at the Chron C27n/C26r boundary and the planktic foraminiferal P3a/P3b subzonal boundary. Above the negative excursion in δ13C and δ18O, the observed gradual increase in δ13C reaches 0.25‰ and δ18O oscillated from −2.17% to −4.09%. Abrupt short-lived, negative excursions in δ13C and δ18O are observed within the planktonic foraminiferal P4a and the upper part of the calcareous nannofossil NP5 Zone to reach −0.37‰ and −5.42‰, respectively. This event clearly corresponds to the second negative excursions in δ13C and δ18O of Bornemann et al. (2009) in Egypt, Arenillas, Molina, Ortiz, and Schmitz (2008) at Zumaia, as well as ODP Site 1209 in the Central Pacific (Westerhold, Röhl, Donner, McCarren, & Zachos, 2011; Figure 10). An increase upward again in δ13C and δ18O data which reach 1.39‰ and −2.8‰, respectively, are noted during the upper part of the Selandian at calcareous nannofossil Zone NP6 and their equivalent P4a-b planktonic foraminiferal Zone.
5.1 TC, TOC, and CaCO3
TC% ranges from 12.3 to 0.7 wt.%, while the TOC values are low, less than 0.35 wt.%, and show no systematic stratigraphic trends. CaCO3% ranges from 4.99 near the late Danian to 100‰ near the Tarawan Formation (Figure 12 and Table 1).
6 FORAMINIFERAL PALAEOBATHYMETRY
6.1 Total foraminiferal number (TFN)
In the Gebel Nezzi section (Figure 11), the total foraminiferal number (TFN) varies from 1 to 1220 specimens per gram (s/g). It starts in the basal part of the studied section with 461 s/g and increases to reach a maximum value of 1220 s/g in Sample 31. TFN oscillate upward from 0 to 712 (s/g). The minimum value is recorded near the Late Danian Event (LDE). Above, the LDE it gradually increases from 64 s/g to become 533 (s/g) in Sample 56 and is followed upward by oscillating decreasing trends towards the upper part of the Dakhla Formation ranging from 280 s/g to 29. The TFN increases again to reach 536 in the basal Tarawan Formation (Sample 69), followed upward by an oscillating decrease ranging from 152 to 5 (s/g).
6.2 Planktonic/benthic (P/B) foraminiferal ratio
P/B ‰ ratios in Samples 29–31 (P2 Zone) are very high ranging from 85.0‰ to 92.5‰ (Figure 11), decreasing upward to 2.59‰ in Sample 36. In Subzone P3a, the P/B ‰ drops and oscillates again (65.5–58.9‰) in Samples 37–39. The P/B ratio varies in Subzone P3b in Samples 40–64 (10.11–82.3‰) but drops in Sample 44‰ to 0‰. In Subzone P4a P/B ratios in Samples 65–72 reaches a maximum (75.8‰) in Sample 68 and then oscillates again. P/B ratios in P4b Zone are less than 60‰ (Table 1 and Figure 11).
6.3 Species richness (S) and diversity index
Species richness of benthic foraminiferal tests in the Nezzi section ranges from 6 to 47 species per sample (Table 1 and Figure 11). Diversity measures (Shannon-Weaver information function, Shannon H), oscillate between 0.6 to 3.5 and Fisher's alpha (α) oscillates between 1.7 to 16.5 according to the concept of Murray (2001) as estimated in the present study. The species diversity and richness reaching a minimum value in Sample 46 during the Late Danian Event are followed by an observed irregular increase directly above this drop.
6.4 Epifaunal/infaunal ratio
The relationship between the different microhabitats of benthic foraminiferans (epifaunal/infaunal ratio) could indicate changes in the ecological environment controlling benthic foraminiferal assemblages (Supplementary Table 2). The benthic foraminiferal diversity and assemblage composition reflects an environment in mesotrophic conditions (as suggested by the mixed infaunal and epifaunal morphogroups) and well-oxygenated bottom waters. Epifaunal/infaunal ratios in the Nezzi section vary from 65.3‰ to 86.5‰ and indicate mesotrophic conditions (Figure 11). In Sample 46, a decrease in epifaunal ‰ to 7.5‰ supports the interpretation of eutrophic and low oxygen conditions at the seafloor followed upward by an irregular increase to reach a maximum 84.7‰ in Sample 72, suggesting a deeper palaeo-water condition with increased palaeoproductivity.
6.5 Agglutinated/calcareous (A/C) benthic foraminiferal ratio
The A/C benthonic foraminiferal ratio of the Gebel Nezzi section is illustrated in Figure 11. The calcareous foraminiferal tests are dominant ranging from 30.7‰ to 100‰.
6.6 Benthic foraminiferal biofacies
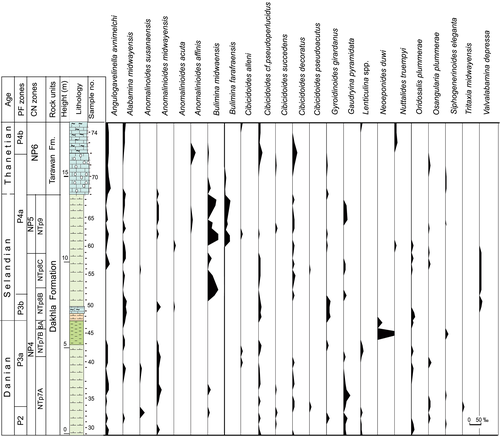
A total of 152 species belonging to 66 genera were recovered from the investigated interval (Supplementary Table 3). Eight main benthic foraminiferal biofacies are distinguished (Figure 12). The name of each biofacies derives from the dominant depth-significant taxon of the constituent associations as follows.
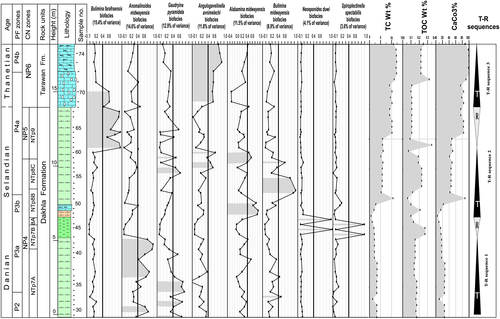
6.6.1 Anomalinoides midwayensis biofacies
It is represented in Factor 2 and explains 15.6% of total faunal variance (Figure 12). It is characterized by heterogeneous and diverse assemblages with mixed epifaunal and infaunal morphogroups (Figures 12 and 13). Among the taxa are Anomalinoides midwayensis (9.8 score), Angulogavelinella avnimelechi (3.2 score), Oridorsalis plummerae (2.7 score), Anomalinoides acuta (0.99 score), Anomalina grandis (2.5 score), Cibicidoides alleni (1.7 score), Cibicidoides rigidus (0.95 score), and Gaudryina pyramidata. This biofacies contains abundant representatives of the Midway-type fauna reflects middle to outer shelf settings (Berggren & Aubert, 1975).
6.6.2 Bulimina farafraensis biofacies
It is represented in Factor 1 and explains 15.4% of total faunal variance, which is recorded mainly in the upper part of the Dakhla Formation (Samples 60 and 70; Figure 12). Bulimina farafraensis (11.4 score), Angulogavelinella avnimelchi (2.2 score), Cibicidoides alleni (1.04 score), Gaudryina pyramidata (1.2 score), and Anomalinoides affinis (1.3 score). Buliminids, indicates either reduced oxygen concentrations, or an abundant food supply (e.g., Alegret & Ortiz, 2013). This biofacies is accompanied by decreased TNF, P/B ‰, and changes in the type, diversity, and frequency of foraminifera that indicate a shallowing trend in a middle neritic environment.
6.6.3 Angulogavelinella avnimelechi biofacies
It is represented in Factor 3 and explains 13% of the total faunal variance (Figure 12). It is recorded near the upper part of the Dakhla Formation (Samples 56 and 59) and the Tarawan Formation (Samples 70–75). Angulogavelinella avnimelechi, Alabamina midwayensis, Anomalinoides midwayensis, Cibicidoides decorates, C. rigidus, Nuttalides truempyi (5.9–10.8‰), Oridorsalis plummerae (5.4–8.9‰), and Osangularia plummerae (5.3–10.5‰), Tritaxia midwayensis (5.1–6.9‰) are the dominant taxa in this biofacies. It represents the deepest Palaeocene biofacies. It is indicated by the presence of a deeper-water Velasco-type fauna such as Nuttalides truempyi and Osangularia plummerae with high planktic/benthic ratios (up to 90‰) with a low abundance and diversity of benthic foraminifera, suggesting outer neritic to upper bathyal environments.
6.6.4 Gaudryina pyramidata biofacies
It is represented in Factor 4, which describes 11.6% of the total faunal variation (Figure 12). Factor 4 is dominated by Gaudryina pyramidata (9.5 score), Cibicidoides decorates (4.3 score), Spiroplectinella dentate (3.6 score), Gyroidinoides girardanus (1.5 score), and Tritaxia midwayensis (1.3 score), and Cibicidoides rigidus (1.1 score), and C. succedens (1.2 score). Also present is a deeper marine agglutinated Velasco-type fauna such as Gaudryina pyramidata (Sprong et al., 2012).
6.6.5 Alabamina midwayensis biofacies
It is represented in Factor 5 and explains 11.2% of the total faunal variance. Factor 5 includes Samples 39, 48–51, and 58 (Figure 12). It is comprised of Alabamina midwayensis (6.6 score), Gyroidinoides girardanus (5.7 score), Oridorsalis plummerae (3.8 score), Cibicidoides rigidus (3.1 score), Valvalabamina depressa (1.6 score), Anomalinoides acuta (1.2 score), Spiroplectinella dentata (score 1.2), and Anomalinoides susanaensis (1.04 score). It is characterized by heterogeneous and diverse assemblages with mixed infaunal/epifaunal morphogroups representative of the Midway-type benthic foraminiferal middle to outer shelf fauna (Berggren & Aubert, 1975; Speijer & Schmitz, 1998).
6.6.6 Bulimina midwayensis biofacies
It is represented in Factor 6 and explains 8.7% of the total faunal variance (Figure 12). Factor 5 includes Samples 52–54 and 57. Bulimina midwayensis (11 score), Valvalabamina depressa (2.4 score), Anomalinoides susanaensis (1.9 score), Cibicidoides decoratus (1.4 score), and Alabamina midwayensis (1.2 score) are the dominant taxa in this biofacies. This biofacies is similar to the Bulimina farafraensis Biofacies but slightly deeper as indicated by a high planktic/benthic abundance with a diversity of benthic foraminiferans that reflects a middle to outer neritic environment.
6.6.7 Neoeponides duwi Biofacies
It is defined by Factor 7 and explains 4.1% of total faunal variance (Figure 12). Diversity and heterogeneity values of this assemblage are very low, consisting mainly of Neoeponides duwi reaching up to a score of 11.8 and Siphogenerinoides eleganta ranging from 3.8‰ to 9.4‰ (Figure 12). This assemblage reflects significantly shallower water depths ranging from inner to middle shelf environments related to a sea-level fall (e.g., Alegret & Ortiz, 2013; Farouk, 2016; Hewaidy, 1997; Speijer, 2003).
6.6.8 Spiroplectinella spectabilis biofacies
It is represented in Factor 8, which describes 3.6% of the total faunal variation. Spiroplectinella spectabilis (10.8 score), Allomorphina trigona (3.3 score), Ammodiscus cretaceous (2.2 score), and Bathysiphon arenaceus (1.5 score) dominate this assemblage. This biofacies fluctuates with the Neoeponides duwi Biofacies and is found in samples number 44 and 46. Diversity and heterogeneity values of this assemblage with total foraminiferal number per gram, planktonic foraminiferal percentage, and calcareous tests % are low, which reflects an inner shelf setting (Figure 11).
7 TRANSGRESSIVE–REGRESSIVE (T–R) SEQUENCES
Three well-known sea level drops are identified within the Danian, Danian/Selandian transition, and at the Selandian/Thanetian (S/Th) boundary based on foraminiferal palaeobathymetry, δ13C and δ18O isotope trends, and carbonate content from the Danian-Selandian succession at Gebel Nezzi (Figures 10-13). These define a series of three T–R sequences, each bounded by a maximum regressive surface as follows.
7.1 T–R sequence 1
This sequence occurs within the upper part of the planktic foraminiferal P2 Zone and P3a Subzone and the equivalent upper part of NTp7A and lower part of calcareous nannofossil NTp7B Subzones (samples from 29 to 46; Figure 11).
7.1.1 T cycle
The transgressive phase of sequence 1 is characterized by a total foraminiferal number ranging from 1220 to 6 s/g and a P‰ of up to 90. The Anomalinoides midwayensis biofacies dominates, with low to medium species richness of approximately 38–41 benthic species per sample and Fisher's α ranging from 19.9 to 11.6, indicating outer neritic to upper bathyal environments (Figures 11 and 12). A minor fluctuation in foraminiferal parameters is observed near the P2/P3 zonal boundary where a decrease in P% from 90 to 60 is associated with an increase in the shallower Gaudryina pyramidata biofacies from ~20% to ~40% and a total foraminiferal number fluctuated from 1220 to 66 s/g.
7.1.2 R cycle
The LDE is associated with a major distinct benthic foraminiferal turnover with an abrupt negative shift in the δ13C and d18O isotope trend, supporting a falling relative sea level. Changes in the abundance of indicative taxonomic groups give information on changes in the bathymetry. A major turnover in benthic foraminiferal faunas occurs in the LDE and is characterized by Neoeponides duwi and Spiroplectinella spectabilis biofacies. It is found in a short interval and covers up to 80‰ of the microfauna (Figures 12 and 13). In this R cycle, an observed drop in total foraminiferal abundance to only two specimens per 1 gm of dry rock with P‰ ranging from 48‰ to 0‰, is associated with changes in the type, frequency of foraminifera and diversity. Near the lowest part of this shallowing trend (Sample 46), a highly oxidized reworked foraminiferal fauna is present, with an increase of Bathysiphon arenaceous, where the infaunal foraminiferal tests declines to a minimum value of 7‰. Decreases of the deeper dwelling Palaeocene taxa such as Nuttallides truempyi, Pullenia coryelli, and Angulogavelinella avnimelechi associated with an observed decrease in TC and CaCO3% suggests that the regressive phase was not deeper than 100 m during the upper part of Subzone P3a (Figures 12 and 13 and Table 1). It may well correspond with regressive cycle 2 noted in Gebel Duwi of Egypt by Farouk and Faris (2013) and the highstand system tract of DS Da6 (Farouk, 2016).
7.1.3 T–R sequence 2
This sequence occurs within the upper part of the planktonic foraminiferal P3b and lower part of the P4a Subzones and their equivalent NTp8B until NTp9 calcareous nannofossil subzones (Samples 47 to 66; Figure 11).
7.1.4 T cycle
The base of the Selandian, which falls at the NTP8A/NTP8B calcareous nannofossil subzonal boundary and the P3a/P3b subzonal boundary, is characterized by a well-known transgression documented from a major lithological change where clay below is replaced by calcareous clay and clayey marl, and where the TC, TOC, CaCO3, and δ13C increase culminates in the lower part of Selandian succession (Figure 12 and Table 1). It is coupled with increased TNF and P/B ‰ changes in the type, diversity, and frequency of foraminifera (Figures 11-13 and Table 1). This transgressive phase is characterized by TNF ranging from 64 to 533 s/g, a P/B ratio ranging from 60‰ to 82‰; a dominant Angulogavelinella avnimelechi, Alabamina midwayensis, Gaudryina pyramidata, Bulimina midwayensis biofacies (Figure 12), with a medium to high species richness of approximately 43–33 foraminiferal species per sample, indicating middle to deep outer neritic environment.
7.1.5 R cycle
A shallowing-upward trend in the upper part of the Dakhla Formation falls within the lower part of P4a Subzone and the equivalent NP5 calcareous nannofossil subzone. The second negative excursion is associated with a second sea-level fall in the upper part of the Dakhla Formation. A major unconformity surface occurs at the Dakhla/Tarawan formational boundary in Egypt resulting in subaerial exposure and the absence or much reduced calcareous nannofossil zones NP5 (Tantawy et al., 2001) or NP6 (Faris & Farouk, 2012; Farouk, 2016; King, 2013). The scarce or disappearance appearance of deeper-water benthic foraminifera (Gavelinella rubiginosus and Angulogavelinella avnimelechi) and increasing dominance of Bulimina farafraensis biofacies coupled with decreased TNF, P/B ‰, highly oxidized reworked foraminiferal fauna, and changes in the type, diversity and frequency of foraminifers indicate a shallowing trend (Figures 11 and 12). It may be correlated to the MPBE with observed decrease in both the proportion of the calcareous nanofossil species richness and planktonic foraminifera relative to the P/B % and the total foraminiferal assemblage (planktonic + benthic).
7.1.6 T–R Sequence 3
A rapid upward change in lithology occurs dominated by carbonate sedimentation with the presence of a high-diversity foraminiferal assemblage rich in calcareous taxa and an increase in δ13C and δ18O content with maximum values of TC ranges from 9.1 to 12.3 wt.% fits with less amount of TOC ranges from 0.22 to 0.25 wt.% and high percentage of CaCO3 ranges from 74.9% to 100% reflecting a new T cycle (Figure 12 and Table 1). It is interpreted as a retrogradational parasequence characterized by the deposition of bioturbation hemipelagic chalky limestone in the lower Tarawan Formation. It is characterized by a high total foraminiferal numbers of about 700 to 1000 (s/g) and low species benthic richness from 10 to 16 with P‰ ranging 75‰ to 44‰ (Figures 11 and 12; Table 1). Angulogavelinella avnimelechi biofacies with increase of the deeper dwelling Palaeocene taxa such as Nuttalides truempyi (5.9–10.8‰) indicate deposition in an outer to upper bathyal depth environment, marking a rise in relative sea level (Figure 13).
8 DISCUSSIONS
The southern part of Egypt including the study area was lying in a tectonically quiescent region and less deformation during the Palaeocene time. The sea-level curves described herein are, therefore, likely to be ascribed to global eustatic sea-level changes and regional tectonic controls.
An acme peak of the benthic foraminifera Neoeponides duwi is well known from the southern Tethyan region in the Late Danian Event (“Neo-duwi Event” of Speijer, 2003) associated with well-known negative δ13C and δ18O excursions, and organic-rich claystones reflecting a brief sea-level fall (e.g., Bornemann et al., 2009; Farouk & El-Sorogy, 2015; Farouk, 2015; Sprong et al., 2009; Sprong et al., 2012).
The broad negative excursion associated with the decrease in carbonate content, a highly oxidized reworked fauna and a drop in foraminiferal content during sea level fall, reflect a eustatic origin rather than local processes during the LDE. This negative δ13C shift coincides with decreasing δ18O values of the foraminiferal shells, which reflects an exceptional perturbation of the carbon cycle and sea level fall (Jarvis et al., 2002), indicating a warming of bottom and surface waters of up to 2 °C of the deep ocean during the early Palaeocene global warming episode (Westerhold et al., 2011). It represents the earliest Cenozoic hyperthermal event, as the precursor event of the Palaeocene-Eocene Thermal Maximum transition below the D/S boundary (Bornemann et al., 2009; Guasti et al., 2006; Speijer, 2003; Sprong et al., 2009; Sprong et al., 2012; Sprong et al., 2013; Westerhold et al., 2011; Figure 10). This warming event coincides with an observed increase of the angular morozovellid assemblage. Liberation of methane preceding this event might have resulted from various processes including increased bottom temperatures, sea-level fall or submarine slope failure (Arenillas et al., 2008; Bornemann et al., 2009; Kvenvolden, 1998; Sluijs et al., 2008).
The GSSP-defined Selandian/Thanetian boundary approximately occurs within the upper part of the nannofossil Zone NP6 above the base of the Mid-Palaeocene Biotic Event (MPBE). The MPBE is characterized by important foraminiferal assemblage and calcareous nannofossil changes and is one of the best global correlation tool (Schmitz et al., 2011).
In Egypt, the Selandian/Thanetian transition is defined by either a pervasive bored hardground or a thin conglomerate bed and/or a faunal break (Farouk, 2016). Zone NP6 is usually missing or recorded in short intervals in several localities of Egypt (Faris & Farouk, 2012; Farouk, 2016) suggesting a major unconformity at the NP5/NP6 zonal boundary at the base of the Tarawan Formation. The Egyptian Thanetian succession is characterized also by a significant changes in the patterns of sedimentation and thickness due to interaction of global sea level changes and regional tectonics marked by tectonically uplift of the Mediterranean coast, with erosion and emergence of several increased subsidence in the internal depocenters and positive structures (the so-called “Velascoensis Event” by Farouk, 2016; Strougo, 1986). In most cases, eustatic sea-level change should be simultaneous with the global tectonic effect, where it effect on the shape and/or the areal extent of the ocean basins (e,g., Clemmensen & Thomsen, 2005; Kominz et al., 2008; Ruban et al., 2012).
In order to evaluate whether the inferred depositional sequences and their boundaries in the present study are the result of global sea-level changes, regional tectonic activity, or both, they are compared with coeval sea-level curves recorded from in and outside of Egypt. Late Danian and Selandian/Thanetian sea-level drops are reported from widely separated locations, with different depositional environments and tectonic settings that reflects eustatic origin (e.g., Baceta et al., 2004; Clemmensen & Thomsen, 2005; Farouk, 2015, 2016; Harris et al., 2010; Schmitz et al., 2011; Sprong et al., 2012). Comparison with the Arabian Chart of Haq and Al-Qahtani (2005) do not correspondences with the Palaeocene sequences in Egypt (e.g., Farouk, 2016; Lüning, Marzouk, & Kuss, 1998) because the Arabian Platform Chart were based on mega-sequences, and these areas has experienced a complex tectonic history with long-term unconformity between the Cretaceous/Palaeogene (K/Pg) transition (Farouk, 2015).
9 CONCLUSIONS
- Three fourth-order T–R sequences reflect fluctuations in the foraminiferal population, benthic biofacies (Bulimina farafraensis, Anomalinoides midwayensis, Gaudryina pyramidata, Angulogavelinella avnimelechi, Bulimina midwayensis, Alabamina midwayensis, Neoeponides duwi, and Spiroplectinella spectabilis), δ13C and δ18O isotopes, and carbonate content. There is considerable evidence for a relationship between δ13C and δ18O isotopes, foraminiferal palaeobathymetry, and sea-level changes. During regressive cycle, a clear drop in foraminiferal parameters, along with a decrease in δ13C and δ18O isotopes and carbonate content, are observed.
- Two negative excursions in δ13C and δ18O are recorded at Gebel Nezzi near the Late Danian and at the Selandian/Thanetian boundary. These are associated with hyperthermal events and a decrease in carbonate contact, with a highly oxidized reworked fauna associated with a drop in foraminiferal abundance and an observed benthic turnover during sea-level fall.
- The isotope correlation plotted against the microplanktonic bioevents confirms previous variations in the stratigraphic range across the Danian/Selandian boundary, where it occurs near the base of calcareous nannofossil Subzone NTp8B and planktonic foraminifera Subzone P3b directly above the FO of Morozovella aequa and below the FO of Morozovella occulsa, M. acuta, M. velascoensis, and Subbotina velascoensis.
- The Selandian/Thanetian boundary occurs at the Dakhla/Tarawan formational boundary near the NP5/NP6 zonal boundary and within Subzone P4a. This interval characterized in Egypt by a wide unconformity that is reflected in a reduced thickness or complete absence of NP6 related to the well-known “Velascoensis Event.”
- Correlation of these two negative excursions associated with broad sea-level drops is interpreted as eustatic in origin rather than the result of local processes. They provide a good useful tool for correlation between the Tethyan and Boreal biogeographic provinces that is independent of biostratigraphy.
ACKNOWLEDGEMENTS
The authors gratefully thank Prof. Sherwood W. Wise, anonymous reviewer, and the Chief-Editor Prof. Ian Somerville for their valuable comments and suggestions. The authors would like to extend their sincere appreciation to the Deanship of Scientific Research at King Saud University for funding this research group no. (RG-1435-033).


