Petroleum generation and expulsion in middle Permian Lucaogou Formation, Jimusar Sag, Junggar Basin, northwest China: assessment of shale oil resource potential
Abstract
Shale oil exploration of the Permian Lucaogou Formation (P2l) has greatly advanced in the Jimusar Sag in the Junggar Basin. However, despite the strong exploration prospects of shale oil resources, the potential of shale oil resources in the Junggar Basin has been insufficiently assessed. This study performs systematical evaluation of P2l source rocks in the Jimusar Sag and proposes an improved hydrocarbon generation potential method to assess the hydrocarbon generation and expulsion characteristics and evaluates the shale oil resource potential of the P2l source rocks in the Jimusar Sag. The results show that the P2l source rocks are thick (up to 200 m) and are distributed over a wide area (up to 1200 km2) in the study region. It contains high TOC (2%–5%), characterized by dominantly type I and type II kerogen. The source rocks are in the low mature–mature stage, and possess good conditions for generation of hydrocarbons. The P2l source rocks reached the hydrocarbon expulsion threshold at a thermal maturity of 0.8% vitrinite reflectance. The efficiency of hydrocarbon expulsion of the source rock is 34%. The amounts of hydrocarbons generated and expelled were 65 × 108 t. Based on the above information, the shale oil resources potential is calculated to be 43 × 108 t, indicating very good shale oil resource prospect in the P2l source rocks of the Jimusar Sag. Copyright © 2017 John Wiley & Sons, Ltd.
1 Introduction
The significant success of the North American shale gas revolution has greatly changed the global energy scenario (Bowker, 2007; Jarvie et al., 2007; Ross and Bustin, 2008; Zou et al., 2010; Brian and Schulz, 2012). Inspired by the successful experience of shale gas exploration and subsequent lowering of natural gas prices, new technologies and theories that were successfully applied in shale gas exploration and development have also been introduced into the shale oil field (Kinley et al., 2008; Jarvie, 2012a, 2012b; Kuhn et al., 2012; Kirschbaum and Mercier, 2013). By 2010, the daily yield of Bakken shale oil reached 44.5 million barrels, and by 2011, the daily yield of Eagle Ford shale oil reached 7.4 million barrels (Energy Information Administration (EIA), 2011), indicating that shale oil has become a key aspect of future exploration and development of unconventional resources (Sonnenberg and Pramudito, 2009; Mullen et al., 2010). Shale oil is the term used for crude oil accumulations that have been generated and retained in fine-grained, organic-rich shale, and often occur in adsorbed and free states in nanoscale pore-throats, microfractures and thin interbedded layers. In contrast to conventional hydrocarbon accumulations, shale oil deposits have remained in shale or mudstone itself without migration into a reservoir rock. Naturally, there is no production capacities from single wells, but commercial yields can be obtained using technologies such as acid fracturing, horizontal wells and multilateral wells (Li and Zhang, 2011; Ma et al., 2012; Zhang et al., 2012; Zou et al., 2013). Shale oil will become an important and potential field in global unconventional oil development (Luo and Zhou, 2013; Zhang et al., 2014a, 2014b).
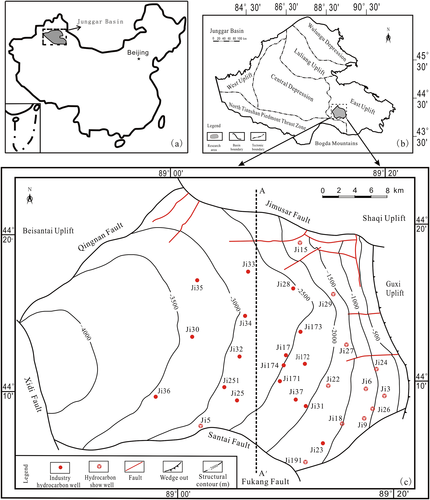
There are several sets of continental shales in China that have large gross thickness and a high abundance of organic matter. These formations have enormous potential for shale oil (Li and Zhang, 2011; Jia et al., 2012; Kang, 2012; Ma et al., 2012; Wu et al., 2013). The technically recoverable resources of shale oil in 41 countries around the world are up to 354 billion barrels, and China possesses the third largest amount of resources, 32 billion barrels (EIA, 2014). The middle Permian Jimusar Sag represents a saline lacustrine basin after the residual sea had closed (Kuang et al., 2012). In this setting, a sequence of alternating fine beds of deep-lake mudstone and dolomitic rock was deposited. Prior to 2010, the P2l was mainly considered to be a co-exploration layer for conventional oil and gas. Although oil and gas shows in P2l were discovered in some of the exploration wells, further investigation was impeded by the limited geological understanding and development technologies at that time. With successive advancements, Xinjiang Oilfield conducted a series of fracturing operations and oil testing on wells Ji25, Ji171 and Ji172 (Fig. 1c) in 2011, all of which yielded oil flows. For example, acid fracturing of well Ji25 (Fig. 1c) provided a daily industrial oil flow of 18.25 t from the 3403–3425 m interval of P2l. In 2012, 6 out of the 11 drilled wells targeting the P2l in the Jimusar Sag yielded industrial oil flows including Ji173, Ji174 and Ji30 (Zhou, 2014). These exploration achievements confirm that the middle P2l in the Jimusar Sag is rich in shale oil (Jia et al., 2012; Kuang et al., 2012; Zou et al., 2013). Evaluation of the shale oil resources of the P2l will be beneficial for identification of new exploration and development areas in the Jimusar Sag, thus promoting the rapid development of relay exploration domains.
The existing evaluation methods for shale oil resources in North America have been divided into static and dynamic methods (Schmoker, 1999, 2002; Pollastro, 2007). Static methods mainly utilize several static parameters of shale rocks to calculate the petroleum resources, such as chloroform bitumen ‘A’, the Rock-Eval pyrolysis parameters S1 and total organic carbon (TOC), and are subdivided into volumetric, analogy and statistical methods. Dynamic methods use dynamic data from the development process of shale oil to calculate the petroleum potential. Examples of these methods are production profile analysis and single well dynamic reserve estimation. The Chinese shale oil and development research is in initial stages, and as a result, the data for mature shale oil development areas and production are lacking; therefore, the volumetric method is the most common method applied in calculation of shale oil resources (Dong et al., 2009; Zhu et al., 2009; Li et al., 2011; Lu et al., 2012; Zhang et al., 2012; Liu et al., 2013; Song et al., 2013). However, Chinese terrestrial shale and mudstone rocks are strongly heterogeneous; consequently, the parameters required for the accurate calculation of shale oil potential are difficult to obtain, limiting the practicality of the volumetric method. As suggested in previous studies, correctly estimating the generation and expulsion characteristics and the expulsion efficiency of source rocks is essential for assessing the accumulation potential of shale oil, which constitutes a type of residual petroleum resource, in source rocks (Cooles et al., 1986; Guan et al., 2012; Jiang et al., 2013; Li et al., 2015). In this study, on the basis of a systematic evaluation of middle P2l source rocks, an improved hydrocarbon generation potential method is applied to study the generation and expulsion characteristics and calculate the generated and expelled hydrocarbon quantities of P2l source rocks. Finally, the shale oil resource potential in the P2l is assessed, paving the way for further exploration and development of unconventional resources in Jimusar Sag.
2 Geological Setting
The Junggar Basin is one of the most prolific petroliferous basins in northwest China. The basin is a triangular intracontinental superimposed basin and has an exploration area of 13 × 104 km2. Structurally, the basin consists of six first-order structural units: the West Uplift, East Uplift, Luliang Uplift, North Tianshan Piedmont Thrust Zone, Central Depression and Wulungu Depression (Yang et al., 2004). The study area, located in the southwest margin of the East Uplift and covering 1200 km2, is a half-graben sag with faulting in the west and overlap in the east (Fig. 1a, 1b). In general, the structural framework of the Jimusar Sag is relatively simple, with a gentle monoclinic tilt to the west and low-amplitude platform, fault nose. Structural contours can be derived from seismic profiles, and the depth of Lucaogou Formation is between 500–4500 m (Fig. 1c).
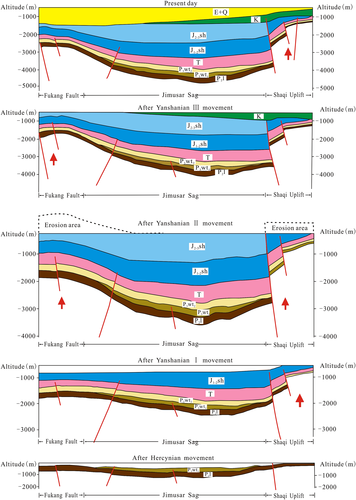
The present-day structural characteristics of the Jimusar Sag are the result of multiple stages of tectonic movement, influenced by the Hercynian, Indosinian, Yanshanian and Himalayan orogenies (Yang et al., 2004). The Junggar Basin was formed during Hercynian movements when the remnants of the Bogda trough in the south of the basin started to close, orogenesis beginning in the late Permian (Fig. 2). Prior to this, a half-graben-like depression developed within the foreland region during the early Middle-Permian. By the late Middle-Permian, the Jimusar Sag had become a relatively isolated basin, giving rise to deposition of the lacustrine Lucaogou Formation that is now the sag's main source rock (Fig. 2). During the late Triassic, the Indosinian tectonic movement mainly influenced the Qitai Uplift in the eastern Jimusar Sag, resulting in an obvious structural dip of the entire sag, and varying degrees of slope erosion in the eastern sag, especially of the Triassic and Permian strata. ‘Yanshanian stage’ was the main period of structural development within the Jimusar Sag and neighbouring tectonic elements. Yanshanian movements initiated during the early Jurassic period across a wide area, but the tectonic intensity was the lowest among the three movements. Subsequent Yanshanian movements took place during the late Jurassic, rejuvenating the Qitai Uplift again, and resulting in displacement along the Jimusar Fault in the northern part of the sag, causing deep erosion of the Jurassic strata (Fig. 2). Yanshanian movements occurred a third time during the Cretaceous period, which led to differential uplift in the southern part of the basin, and the gradually disappearing independent structural units in the sag. It also subjected the Cretaceous strata to a certain degree of erosion (Fig. 2). Himalayan movements occurred from the Neogene to the Quaternary period. During this period, the north-south compression made the Tianshan Mountains rise rapidly and advance towards the basin centre. At the same time, the Guxi Uplift to the east of the sag rose gradually. Neogene and Quaternary sediments deposited at this time form a wedge-shaped unit along the entire sag, characterized by gradual thinning of the strata from west to east (Fig. 2) (Fang et al., 2007; Yang, 2014).
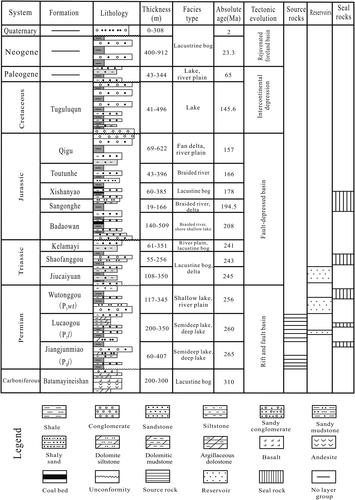
The basement comprises middle Carboniferous, covered by Permian to Quaternary sedimentary sequences (Wang et al., 2013). There are two major source rocks in the sag, the middle P2l and the lower Permian Jiangjunmiao Formation (Fig. 3). The main exploration targets in the study area are the P2l, the Permian Wutonggou Formation and the Triassic Jiucaiyuan Formation. The latter two are conventional oil and gas exploration targets, whereas the P2l is a major unconventional exploration target. There are three regional seal rocks: the thick mudstones of the P2l, the Jurassic Sangonghe Formation and the lower Xishanyao Formation (Fig. 3). In addition to these, local seal rocks are developed in the Permian Jiangjunmiao and Wutonggou Formations and the Triassic Shaofanggou Formation (Fig. 3) (Fang et al., 2005; Zhou, 2014).
3 Data and Methods
3.1 Data
Throughout this study, more than 285 samples from eight wells were collected and submitted for source-rock analysis. The well names and Rock-Eval pyrolysis data are listed in a Supplementary table. In general, our database includes 285 sets of pyrolysis analysis data, 168 sets of chloroform bitumen ‘A’ data, 170 sets of kerogen organic carbon isotope analysis data and 74 sets of vitrinite reflectance (VR) data.
3.2 Methods
In this study, we have used the hydrocarbon generation potential method proposed by Pang et al. (2005), modified by restoring the initial hydrocarbon generation potential to discuss the hydrocarbon generation and expulsion characteristics of source rocks (Fig. 4).
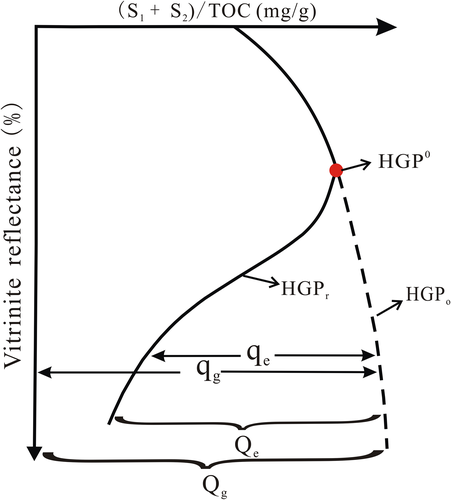
In Rock-Eval pyrolysis parameters, S1 represents the free, volatile hydrocarbons that are thermally liberated below 300 °C, and S2 represents the kerogen-cracking hydrocarbons that are generated during progressive heating from 300 °C to 600 °C (Espitalié and Bordenave, 1993). Zhou and Pang (2002) defined the [(S1 + S2)/TOC] × 100 ratio as the hydrocarbon generation potential index (HGP). During the processes of source rock burial and thermal evolution, hydrocarbons generated from organic matter first undergo adsorption, water dissolution and capillary saturation and are subsequently expelled from the source rocks in the free phase (Pang et al., 2005). Pang et al. (2005) identified the thermal condition at which hydrocarbons begin to be expelled as the expulsion threshold. At the expulsion threshold, the hydrocarbon generation potential index, the envelope curve of data points of [(S1 + S2)/TOC] × 100 in Figure 4, reaches its maximum value. When source rocks are buried deeper than the expulsion threshold, hydrocarbons are expelled from source rocks, and the hydrocarbon generation potential index decreases; the remaining potential is defined as the remaining hydrocarbon generation potential index (HGPr). However, HGPr can only represent the hydrocarbon generation potential that is still present, but not the initial potential. Thus, it is necessary to restore the initial hydrocarbon generation potential index (HGPo).
 (1)
(1) (2)
(2)With hydrocarbon expulsion from source rocks, the HGPr decreases. The difference between the HGPo and HGPr is the expulsion capacity (qe), which is the amount of hydrocarbons expelled per unit of organic carbon (unit: mg HC/g TOC) (Fig. 4). The generation capacity, qg, is the amount of hydrocarbons generated from unit of organic carbon (unit: mg HC/g TOC) (Fig. 4). The percentage of the expelled hydrocarbons is called the expulsion efficiency (%). When the VR increases by 0.1%, the corresponding variations in the hydrocarbon generation and expulsion ratios are called the petroleum generation and expulsion rates, (Zhou et al., 2006). Qe represents the cumulative amount of expelled petroleum through geological history (unit: ton), Qr is the residual petroleum amount retained in the source rock (unit: ton),and Qg is the amount of petroleum generated (unit: ton) (Fig. 4; Pang et al., 2005).
 (3)
(3) (4)
(4) (5)
(5) (6)
(6) (7)
(7) (8)
(8)4 Results and Interpretations
4.1 Geological and geochemical characteristics of P2l source rocks
4.1.1 Lithology and thickness
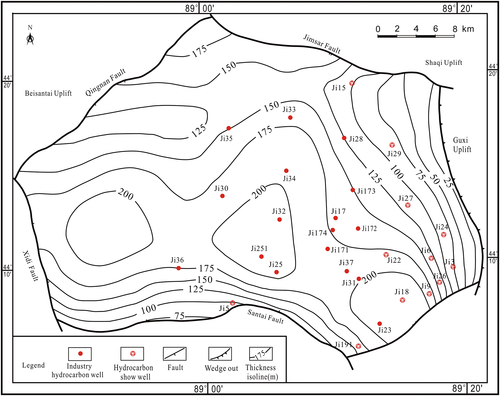
The P2l formation in the Jimusar Sag is characterized by saline semi-deep to deep lake deposits and contains three main rock types: mudstone, carbonates and siltstone (Fig. 3). This formation has a large thickness and wide distribution. This formation, which occupies most of the sag, is widely distributed with a large thickness (typically greater than 200 m, and approximately 350 m at maximum; Kuang et al., 2015). The organic matter enrichment in the dark mudstone layer provides favourable conditions for hydrocarbon generation in the source rocks. Using previously defined criteria for shale oil source rocks and considering the actual situation in the study area (Zhao and Du, 2012), the dark mudstone with the TOC content of 1% or above can be considered as the effective source rocks. Using well data of formation thickness, burial depth, sedimentary facies, etc., the source rock thickness map of the P2l in the Jimusar Sag was constructed (Fig. 5). The map indicates that the distribution area of the source rock is ~1200 km2, covering the entire sag (Kuang et al., 2015). Overall, the thickness increases gradually from east to west, in the range of 25 to 200 m. The greatest thickness of ~200 m occurs in the area of well Ji25 (Figs. 1 and 5).
4.1.2 Abundance of organic matter
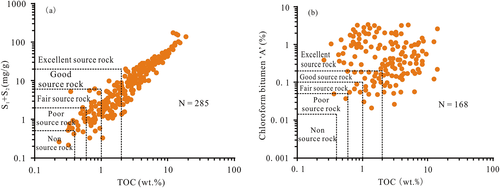
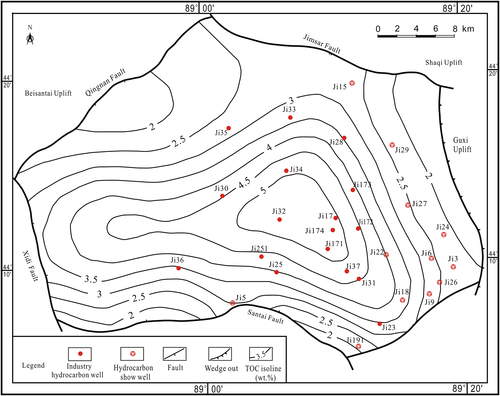
A basic parameter in source rock evaluations is the organic matter abundance, defined as the amount of organic matter per unit mass of the source rock (Peters, 1986; Lu and Zhang, 2008). Statistical analysis was performed on 285 sets of organic carbon experimental data, 285 sets of Rock-Eval pyrolysis data and test data of 168 sets of chloroform bitumen ‘A’ from eight wells in the Jimusar Sag (Table 1). The results reveal that the TOC content of source rocks in this area is between 0.24 and 19.01 wt.%, with an average value of 3.42 wt.%; the amount of hydrocarbon generation potential is between 0.21 to 87.03 mg/g of rock, average 15 mg/g of rock; and chloroform bitumen ‘A’ is between 0.02 and 3.32%, average 0.89%. Based on the Chinese continental hydrocarbon source rock geochemical evaluation method (SY/T 5735-1995), the results indicate that the source rocks are fair to good on the whole and that the majority are good source rocks (Fig. 6). Figure 7 shows a planar distribution map of the TOC content of the source rocks of the P2l in the Jimusar Sag. The map indicates that the average TOC content of the P2l source rocks in the study area is between 2 and 5% and that there are differences in the TOC content in different regions (Fig. 7). On the whole, TOC content is higher in the centre of the sag and lower in the east. The TOC of P2l source rocks is mainly influenced by sedimentary facies, which are dominated by lacustrine deposition. As the water depth gradually increases from the lacustrine basin margin to the centre, the hydrodynamic conditions weaken, the sediment grains become finer and the preservation condition of organic matter improves. Consequently, the TOC of P2l source rocks gradually increases. The average TOC in the Ji17 well area is approximately 5%.
| Well | Depth (m) | Test items | |||
|---|---|---|---|---|---|
| TOC (%) | S1 (mg/g) | S2 (mg/g) | Chloroform bitumen ‘A’ (%) | ||
| Ji17 | 3136–3138 |
 |
 |
 |
 |
| Ji22 | 2524–2624 |
 |
 |
 |
 |
| Ji23 | 2296–2296 |
 |
 |
 |
 |
| Ji24 | 1691–2280 |
 |
 |
 |
 |
| Ji28 | 3184–3342 |
 |
 |
 |
 |
| Ji30 | 4041–4156 |
 |
 |
 |
 |
| Ji174 | 3109–3330 |
 |
 |
 |
 |
| Ji251 | 3601–3785 |
 |
 |
 |
 |
- Note: Data in the table are presented as follows:

4.1.3 Kerogen types
The organic matter type largely influences the hydrocarbon generation potential of source rocks and determines whether they are oil-prone or gas-prone. Thus, identifying the organic matter type is important for objectively assessing the hydrocarbon generation ability of the source rock (Lu and Zhang, 2008). This study uses crossplots of the hydrogen index (HI) against the maximum temperature (Tmax) and carbon isotope analysis to distinguish organic matter types. We obtained 152 sets of hydrocarbon source rock pyrolysis data and plotted the HI against the Tmax. This correlation suggests that the kerogen is dominated by type I and type II (Fig. 8a). Different organic matter types can be distinguished by their δ13C values. The δ13C values of type I kerogen, type II kerogen and type III kerogen (which are terrestrial source rocks) are below −28‰, between −28 and −25.5‰, and greater than −25.5‰, respectively (SY/T 5735-1995). The 170 sets of δ13C measured data of the P2l source rocks indicate (Fig. 8b) that approximately 60% of δ13C values of organic matter samples are between −28 and −25‰. Type II kerogen is most abundant, followed by type I kerogen, and there are only small amounts of type III kerogen.

4.1.4 Thermal maturity of organic matter
The thermal maturity of the samples was evaluated using several data types and parameters, including the vitrinite reflectance (VR) and Tmax. VR is used as an index for evaluation of source rock maturity. As Figure 9a shows, the VR measurements of P2l source rocks in the Jimusar Sag are 0.5–1.1%, suggesting that the majority of source rock is in the early to middle stage of ‘oil window’ (SY/T 5735-1995). Rock-Eval Tmax temperature is also used as an indicator in the evaluation of source rock maturity. Statistical analysis of Rock-Eval pyrolysis Tmax data (Fig. 9b) demonstrates that the Tmax value of the majority of P2l source rock samples is 435–455 °C, and most of the samples are in the early and middle mature stage (SY/T 5735-1995).
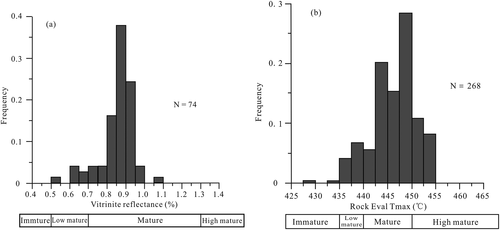
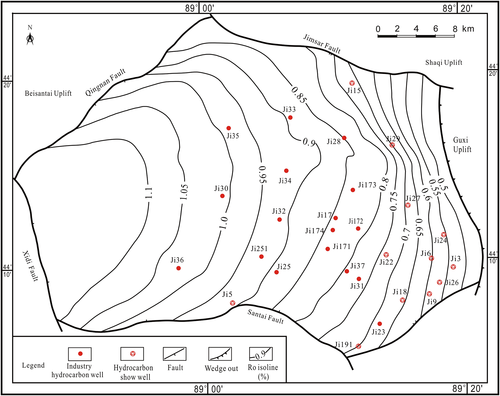
The majority of the P2l source rocks of the Jimusar Sag can be demonstrated to be in the low mature–mature stage. From the measured VR data of core samples and the structural contour map of the P2l source rocks, we mapped the VR distribution of the P2l source rocks in the study area (Fig. 10). As shown in the figure, the VR values of the P2l in the Jimusar Sag range from 0.5 to 1.1%. The maturity gradually decreases from west to east and is maximized at ~1.1% in the west deep depression.
4.2 Hydrocarbon generation and expulsion characteristics of P2l source rocks
In this study, we established a hydrocarbon generation and expulsion model of P2l source rocks (Fig. 11) by using the model for hydrocarbon generation potential proposed by Pang et al. (2005) with improved restoration of the initial hydrocarbon generation potential (Fig. 4). The results of the hydrocarbon generation and expulsion model are highly reliable as the data were obtained from actual core samples of the P2l source rocks in the Jimusar Sag. The expulsion threshold, expulsion rate and hydrocarbon expulsion of P2l source rocks can be determined by studying the changes in the hydrocarbon generation potential index of source rocks in the geological section (Jiang et al., 2010).
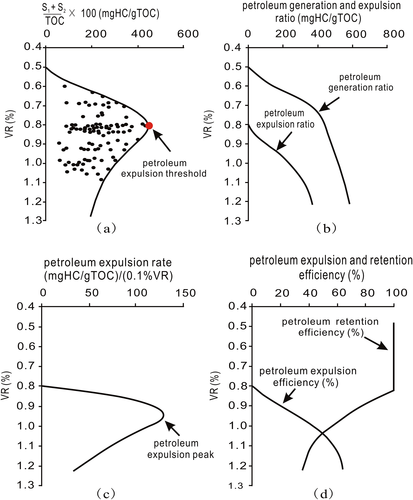
The study has shown that, for P2l source rocks in the Jimusar Sag, the VR values corresponding to the generation and expulsion thresholds are 0.5% and 0.8%, respectively (Fig. 11a). Hydrocarbon generation rates increased rapidly at the VR of 0.6%, with the highest rates of generation being 570 mg/gTOC (Fig. 11b). P2l source rocks reached the peak of expulsion when VR reached 0.95%, with a corresponding expulsion rate of up to 135 mg/gTOC/0.1%VR. Subsequently, the expulsion rate began to decrease with increasing thermal evolution (Fig. 11c). With increasing thermal evolution, the expulsion efficiency of the P2l source rocks gradually rose from 0 to 64%. Prior to reaching the expulsion threshold, most of the generated hydrocarbons were retained in the source rocks; minimal amounts were expelled in the water-dissolving and diffusion phases under compaction and concentration gradients (Pang, 1995). After the source rocks had reached the expulsion threshold, the ability of the source rocks to retain hydrocarbons decreased to approximately 36% (Fig. 11d).
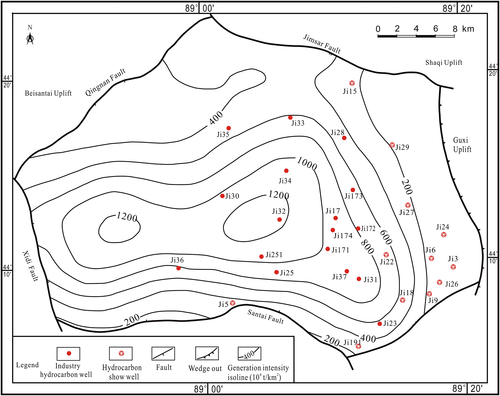
On the basis of the hydrocarbon generation rate, organic matter abundance, current burial depth, thickness of P2l source rocks and other data, a hydrocarbon generation intensity map of the source rocks in the Jimusar Sag was generated using Equation 5 (Fig. 12). The source rocks have all reached the generation threshold, and the hydrocarbon generation boundary is the same as that of the sag, i.e. hydrocarbon generation has taken place over the whole sag. However, the generation intensity varies in different areas of the sag, being higher in the central part and western deep depression area of the sag, with maximum values of ~1200 × 104 t/km2. The generation intensity is lower in the northern part and eastern slopes of the sag, and is generally less than 400 × 104 t/km2 in these areas. In general, there are two hydrocarbon generation kitchens, one in the centre and the other in the west of the sag.
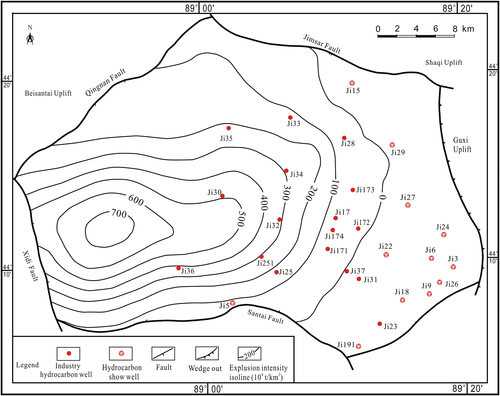
Similarly, using the expulsion rate, organic matter abundance, current burial depth, thickness of P2l source rocks and other data, an expulsion intensity map of P2l source rocks in the area was constructed (Fig. 13). There is a hydrocarbon expulsion centre in the western part of the sag. In this area, the expulsion intensity is a maximum of ~700 × 104 t/km2, and the values are generally lower in the eastern slopes of the sag. The results suggest that the expulsion intensity of P2l source rocks is mainly controlled by the degree of thermal evolution. The source rock in the eastern part of the sag has not yet reached the expulsion threshold because the degree of transformation of organic matter is low in this area, causing the hydrocarbon expulsion intensity to be lower than that in the western deep depression of the sag.
4.3 Shale oil resource potential of P2l source rocks
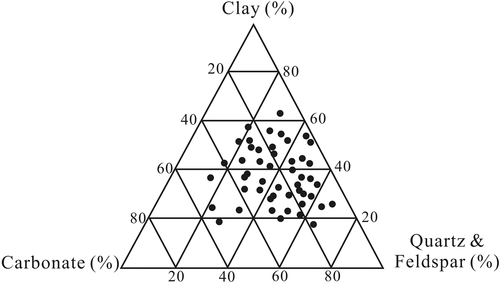
The P2l source rocks in the Jimusar Sag are characterized by wide distribution, large thickness, high organic matter abundance, type I and type II kerogen and low mature–mid-mature thermal maturity. These conditions provide a solid mass foundation for the formation of large-scale shale oil. In previous studies, shale oil refers to the oil generated and retained in the shale, which is primarily stored in the micro-nanoscale pore throats (Wu et al., 2012). The P2l source rocks in the Jimusar Sag are mainly composed of dolomitic mudstone, silty mudstone, lime mudstone and pure mudstone. Being affected by penecontemporaneous period adjustment dolomitization, the P2l source rocks contain widespread micritic and microcrystalline dolomites (Kuang et al., 2015). The mineral compositions of these rocks are complex. Mineral X-ray diffraction data demonstrate that the levels of clay minerals in P2l source rocks are approximately 20–60%. The levels of quartz, feldspar, carbonate and other brittle minerals are high, a total of 40–80% (Fig. 14). The acidic fluid generated from organic matter hydrocarbons corrodes the feldspar and other brittle minerals, forming numerous inorganic mineral dissolution pores that retain the shale oil (Xi et al., 2015).
Shale is geologically characterized by self-generation and self-preservation of hydrocarbons (Zou et al., 2013). Thus, the difference between the generated and expelled hydrocarbon quantities (which defines the maximum amount of residual oil in the shale) can be computed from the generation and expulsion characteristics of the P2l source rocks. As analysed above, the quantities of hydrocarbons generated and expelled from the source rocks of the P2l in the Jimusar Sag are, respectively, 65 × 108 and 22 × 108 t, calculated using Equations 7 and 8. The shale oil resource potential residual in the source rock is 43 × 108 t, and the comprehensive hydrocarbon expulsion efficiency is 34% (Table 2).
| Generated hydrocarbons (108 t) | Expelled hydrocarbons (108 t) | Residual hydrocarbons (108 t) | Comprehensive hydrocarbon expulsion efficiency (%) |
|---|---|---|---|
| 65 | 22 | 43 | 34 |
5 Discussion
In this paper, we calculated the generated and expelled hydrocarbon quantities of P2l source rocks in Jimusar Sag using an improved method of hydrocarbon generation potential. This method is based on the material balance principle, i.e. the quantity of organic matter is conserved before and after hydrocarbon expulsion. The data in this paper were obtained from core samples of the study areas. The concepts are clear and simple and objectively reflect the overall hydrocarbon generation and hydrocarbon expulsion trends in the source rocks, reducing human biases in the resource evaluation result.
 (9)
(9)The geological resource of shale oil within the P2l source rocks in the Jimusar Sag was calculated as 36 × 108 t. The residual oil resources in the source rocks are much larger in the improved hydrocarbon generation model than that in the volumetric method; this is partly because the residual oil resources include the kerogen-cracking hydrocarbons. The amount of residual oil in the source rocks is considered as the maximum potential of the shale oil.
The results of this paper demonstrate the tremendous potential of the shale oil resource in the P2l of the Jimusar Sag. Such high resource potential has three possible causes. First, as mentioned above, the total organic contents of the source rocks in the study area are very high (between 2% and 5%), providing an abundant material base for forming shale oil. Second, the organic matter has moderate thermal maturity, and most of the source rocks are in the ‘oil window’ phase. Both conditions favour the formation of shale oil. Third, there are high levels of brittle minerals. When dissolved via the fluid generated from organic matter hydrocarbons, these minerals leave numerous dissolution pores that provide reservoir space for shale oil.
The cost of shale oil exploration is higher than that of conventional petroleum exploration, and the recovery coefficient is lower for shale oil than conventional petroleum. According to Jia et al. (2012), the shale oil recovery coefficient in the Chinese continental basin is only 16–18%. The present paper was limited to the resource potential of shale oil. Other economic and technical factors require further investigation. In addition, the light hydrocarbons in S1 could evaporate over time, leading to an underestimated HPGr, which has not been considered in the present study.
6 Conclusions
- The source rocks in the study area have a high TOC content, between 2 and 5%. The organic matter is dominated by type II kerogen with admixture of type I. Most source rocks in the P2l are low mature to mid-mature, with VR between 0.5 and 1.1%. These geological and geochemical characteristics indicate that a set of good source rocks is developed in the P2l of the Jimusar Sag, which possesses favourable conditions for the formation of shale oil.
- The P2l source rocks in the Jimusar Sag reached the hydrocarbon generation and expulsion thresholds at thermal maturities of 0.5% and 0.8% VR, respectively. The maximum hydrocarbon generation intensity is 1200 × 104 t/km2, and the maximum hydrocarbon expulsion intensity is 700 × 104 t/km2. The average expulsion efficiency of the P2l source rocks is 34%. The amounts of hydrocarbons generated and expelled from P2l source socks were 65 × 108 t and 22 × 108 t, respectively. The results show that the shale oil resource potential in the P2l of the Jimusar Sag is 43 × 108 t.
Acknowledgements
This study is supported by the National Key Fundamental Research Plan “973” Project (2011CB201102 and 2014CB239101). We are very grateful to the Petrochina Xinjiang Oil Company, especially the Research Institute of Exploration and Development, for the provision of the large amount of data. We sincerely thank the reviewers for their constructive comments and the editor who helped improve the quality of this manuscript.


