Across-Platform Imputation of DNA Methylation Levels Incorporating Nonlocal Information Using Penalized Functional Regression
ABSTRACT
DNA methylation is a key epigenetic mark involved in both normal development and disease progression. Recent advances in high-throughput technologies have enabled genome-wide profiling of DNA methylation. However, DNA methylation profiling often employs different designs and platforms with varying resolution, which hinders joint analysis of methylation data from multiple platforms. In this study, we propose a penalized functional regression model to impute missing methylation data. By incorporating functional predictors, our model utilizes information from nonlocal probes to improve imputation quality. Here, we compared the performance of our functional model to linear regression and the best single probe surrogate in real data and via simulations. Specifically, we applied different imputation approaches to an acute myeloid leukemia dataset consisting of 194 samples and our method showed higher imputation accuracy, manifested, for example, by a 94% relative increase in information content and up to 86% more CpG sites passing post-imputation filtering. Our simulated association study further demonstrated that our method substantially improves the statistical power to identify trait-associated methylation loci. These findings indicate that the penalized functional regression model is a convenient and valuable imputation tool for methylation data, and it can boost statistical power in downstream epigenome-wide association study (EWAS).
Introduction
DNA methylation is an important epigenetic modification involved not only in normal development [Smith and Meissner, 2013], but also in risk and progression to many diseases [Bergman and Cedar, 2013]. It has been shown to play a key role in the regulation of gene transcription, X-inactivation, cellular differentiation, and other critical processes such as aging [Bird, 2002; Gonzalo, 2010]. Recently, the emergence of powerful technologies such as microarray-based DNA methylation studies [Bibikova et al., 2011] and whole-genome bisulfite sequencing [Harris et al., 2010] has enabled the profiling of DNA methylation levels at high resolution. Numerous studies employed these high-throughput approaches to characterize changes in DNA methylation patterns and their corresponding tissue- and disease-specific differentially methylated regions on a genome-wide scale [Berman et al., 2012; Chen, Ning, Hong, & Wang, 2014; Horvath, 2013; Varley et al., 2013].
As new technologies emerge, researchers tend to replace older methylation profiling platforms with new ones. However, different platforms can target CpG sites at different locations and with varying resolutions, which hinders the joint analysis of data from multiple platforms. For instance, the Illumina HumanMethylation27 (HM27) and HumanMethylation450 (HM450) BeadChip [Bibikova et al., 2011] are two common microarrays used by The Cancer Genome Atlas (TCGA) project. HM27 investigates 27,578 CpG sites predominantly located near CpG islands, while HM450 provides broader coverage with 485,577 probes spanning 96% of CpG islands and 92% of CpG shores across a larger number of genes [Bibikova et al., 2011]. Several TCGA studies have used HM450 to generate methylation profile data for more recently collected samples while still using HM27 to measure DNA methylation in the older test subjects. These mixed profiles compel researchers to focus on those probes shared between the two platforms when using the data for downstream analysis, as reevaluating all samples using HM450 is not only expensive, but also time-consuming [Getz et al., 2013; Koboldt et al., 2012; The Cancer Genome Atlas Research Network, 2012, 2013].
Imputation has been successfully employed in many genetic, genomic, and epigenomic contexts [Donner et al., 2012; Ernst and Kellis, 2015; Jewett et al., 2012; Li et al., 2009; Zhang et al., 2015]. For methylation profiling, multiple methods have been proposed to impute methylation levels across tissue types [Ma et al., 2014] or employing various genomic and epigenomic features, including DNA sequence context, genomic position, predicted DNA structure, GC content, and DNA regulatory elements [Bock et al., 2006; Das et al., 2006; Zhang et al., 2015]. However, most of these methods dichotomize methylation status. More importantly, no cross-platform imputation methods have been proposed for predicting methylation levels at unassayed CpG sites. On the other hand, for genotypes, imputation of untyped SNPs has become a standard procedure used both to resolve similar inconsistencies between genotyping arrays and to increase the resolution of genotype data collected in genome-wide association studies [Li et al., 2009]. Here, we propose the application of a similar concept to impute data in DNA methylation profiles from a subset of probes. Although DNA methylation does not exhibit as clear or strong a correlation structure as LD blocks among SNPs, we observe local correlation among neighboring probes similar as reported by others [Eckhardt et al., 2006; Zhang et al., 2015]. Importantly, we have found nonlocal correlations among probes falling into the same functional categories that have not been employed in the literature. Therefore, we adopt a penalized functional regression model [Goldsmith et al., 2011], which uses functional predictors to capture these nonlocal correlations. Our study demonstrates that this model can impute an HM27 dataset into an HM450 dataset effectively and accurately, and using these imputed values can improve the statistical power of downstream epigenome-wide association study (EWAS).
Materials and Methods
Data
We evaluated our imputation model using DNA methylation data from TCGA acute myeloid leukemia (AML) samples [Ley et al., 2013]. The dataset contains DNA methylation data of tumor tissues from 194 patients with AML and is one of the largest methylation datasets from the TCGA project. All samples were evaluated using both HM27 and HM450. We transformed the raw β values into M values, defined as  , as the M values better follow a Gaussian distribution [The Cancer Genome Atlas Research Network, 2013]. Our goal is to impute the HM27 dataset into an HM450 dataset to get an expanded view of the epigenomic landscape. The dataset is publicly available at the TCGA data portal (https://tcga-data.nci.nih.gov/tcga/).
Because imputation of sporadic missing data is not the focus of this work, we removed all probes with at least one missing values for the sake of convenience. However, these missing values can be imputed by applying similar methods developed for gene expression profiles [Bo, Dysvik, & Jonassen, 2004; Kim et al., 2005; Liew et al., 2011; Troyanskaya et al., 2001] to generate data without missing values. Additionally, we removed 743 probes designed in HM27 but not in HM450. In total, the HM27 dataset consisted of 20,794 probes passing TCGA quality control (QC) criteria [Ley et al., 2013] and the HM450 dataset consisted of 393,152 QC+ probes. The latter set contained all 20,794 probes in HM27, leaving the remaining 373,358 as our potential imputation targets.
When training and using our model, we required data from HM450 and HM27, respectively. However, we noted that as HM27 and HM450 employ different biochemical methods to measure methylation levels, platform-specific effects might negatively impact imputation performance. To alleviate this systematic effect, we fitted a LOESS (locally weighted scatterplot smoothing) regression model [Cleveland, 1979] between two platforms, stratified by the number of CpGs in the probe (#CpG = 0, 1, 2, 3, 4, 5, 6, 7+), using 14 randomly chosen samples and normalized the HM27 data against the HM450 data [The Cancer Genome Atlas Research Network, 2013].
Penalized Functional Regression Model

 .
.To improve imputation accuracy, we incorporated functional predictors Xi(t) into our model to capture information such as nonlinear relationships from nonlocal probes. Based on the assumption that probes with similar properties tend to show similar methylation profiles, we divided the probes into several property groups. Here, we divided the probes among five groups according to their relative location to a CpG island. The five groups are “CpG Island,” “North Shore,” “South Shore,” “North Shelf,” and “South Shelf” [Bibikova et al., 2011]. Then, we estimated the DNA methylation function Xi(t) for a particular target probe with the DNA methylation data from HM27 probes in the same group as the target probe. Assume the target probe is in group g and there are q HM27 probes in the same group. The observed DNA methylation data are denoted as  , where
  is the DNA methylation value at jth HM27 probe in group g and j = 1, …, q. Instead of estimating Xi(t) by expanding into the principal component basis obtained from its covariance matrix [Goldsmith et al., 2011], we used the kernel density estimation to obtain Xi(t) with
  so that it is specific to group g.
To perform the model fitting, the functional coefficient β(t) was expanded by a linear spline basis  , where
  is the knot along the interval [0,1] and
  is an indicator function, taking a value of 1 if
  and 0 if
  . We further defined a spline basis vector
  and a coefficient vector
  so that we may induce smoothing by assuming b∼N(0,D), where D is a penalty matrix corresponding to the particular spline basis ϕ(t).

 . For ease of notation, we denoted JXϕ as the n×Kb matrix with the (i,k)th entry equal to
  and Z as the n × p matrix with the ith row equal to Zi, where p is the number of covariates. The model can be written in matrix format as:

b ∼ N(0,D).

Typically, Kb = 30 is sufficient to avoid under-smoothing in most applications [Goldsmith et al., 2011]. Consistent with previous work [Fan et al., 2015a,2015bb], choice of Kb has little impact on performance (Supplementary Fig. S2).
Selection of Local Covariates
We exploited linear correlation with neighboring probes by including methylation values of HM27 probes near the target HM450 probe as local covariates Z in our imputation model. For simplicity, we selected the five nearest upstream probes and the five nearest downstream probes to each target probe as these local covariates.
Quality Filter
Because most probes showed nearly constant methylation levels across samples, we found for many probes, the imputation model is formed without sufficient information. Thus, it tends to be underfitted and yields inaccurate imputation results. It is therefore desirable to have quality metrics for gauging the imputation quality. As such a quality metric, we proposed an under-dispersion measure defined as the ratio of the variance of fitted methylation values to its expected value (the variance of the true methylation values in the training set). If this ratio is below a certain threshold for a probe, it indicates an underfitted model for that probe, and we discard imputed values for the probe before subsequent analysis. A more stringent threshold can provide more accurate results, although at the cost of more probes discarded after imputation.
Imputation Quality Assessment
We assessed imputation quality using fivefold cross-validation. Within each split, the full dataset was randomly divided into a training set consisting of 80% of the samples and a testing set comprised the remaining 20%. For each testing set, we only retained HM27 data that contain a subset of HM450 probes, and masked methylation values of other HM450-specific probes. For the training set, we used methylation measurements on probes shared between the two arrays as predictors to impute methylation values at HM450-specific probes. Because most HM27 probes were measured by both HM27 and HM450, the predictors used in our model can be methylation levels for these shared probes measured from either array. Note that our prediction model was built under the realistic (more challenging) scenario where we used as predictors the measurements from HM450 array instead of those from HM27 array, which would require the training dataset had measurements from both arrays. Specifically, we fitted the functional regression model based on the training set, learned the relationship between methylation values of the shared and HM450-specific probes, and used the fitted model to impute the masked values of HM450 probes from the HM27 data in the testing set. Finally, we evaluated the imputation performance by averaging quality measures across splits.
As quality measures, we selected the mean squared error (MSE) and the squared Pearson correlation (R2) between the imputed and the true methylation values in the testing sets. Although R2 is a more intuitive measure of quality directly related to power and sample size in downstream analysis, we would like to note that this metric could easily be affected by a few outliers. Additionally, if the variance of methylation values for a specific probe is small, R2 can be dramatically affected even by small imputation errors.
Simulation of Association Study
To assess the potential improvement of statistical power when using well-imputed methylation values for epigenetic association studies, we performed several simulated association studies for continuous and binary traits. Specifically, we randomly selected 100 HM450 probes with imputation R2 between 0.1 and 0.3 based on our functional model, and simulated a dataset with 180 samples for each probe. In the continuous trait setting, for each probe, a trait value  was simulated from the methylation level of this probe according to the linear model
  for sample i, where
  is true methylation β value, the effect size
  , and
, and  , where
  is the sample standard deviation of
  . In the binary trait setting, we first calculated
  , and simulated
  from
from  , where
  is the mean value of
  , and the effect size
  .
.
We repeated the simulation 2000 times. For each simulated dataset, we performed association tests (linear regression for the continuous trait, and logistic regression for the binary trait) based on the true methylation values, as well as imputed values from the simple linear model and our proposed penalized functional model. The empirical power of each method was calculated as the proportion of observed P values that fall below the significance threshold,  . Finally, we evaluated the empirical power for each effect size c by averaging results across 100 probes.
Results
Evaluation of Imputation Quality
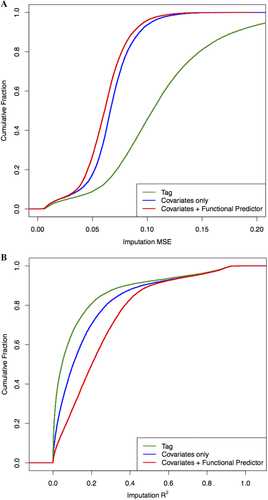
Most probes showed nearly constant methylation levels in populations, making imputation trivial for them. We therefore focused on probes showing large variations and chose the top 20,000 such probes to evaluate the imputation quality. The time complexity of our method increases linearly with the number of target probes. However, since the imputation for each target probe is independent, we can accelerate it by running imputation in parallel. In the fivefold cross-validation experiment, 14 samples used for normalization were removed at first. Among the remaining 180, 144 individuals were chosen at random as the training set and 36 as the testing set within each split. The empirical cumulative distribution of imputation MSE and R2 are shown in Figure 1. The baseline method we used is the “tag” approach, where for each target probe, we calculated the Euclidean distance between the target probe and local probes, chose the local probe with the smallest distance as the tag probe, and directly copied its methylation values as imputed values for the target probe. We also compared the two models with and without functional predictors and found that incorporating functional predictors lead to significantly improved imputation MSE and R2 (P < 2.2 × 10⁻¹⁶ for both metrics, paired Wilcoxon test). Table 1 summarizes some basic statistics. As expected, the “tag” method performs worst and we have therefore focused in subsequent text only the two models with and without functional predictors.
| Imputation MSE | Imputation R2 | |||||
|---|---|---|---|---|---|---|
| Q1 | Median | Q3 | Q1 | Median | Q3 | |
| Covariates only | 0.0553 | 0.0662 | 0.0781 | 0.0326 | 0.1040 | 0.2321 |
| Covariates + functional predictor | 0.0489 | 0.0610 | 0.0731 | 0.0907 | 0.2015 | 0.3375 |
| Improvement | 12% | 8% | 6% | 178% | 94% | 45% |
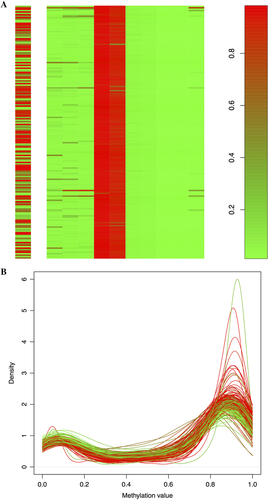
We used the target probe cg00288598 as an example to illustrate how the functional predictors improve the imputation quality. As shown in Figure 2A, the selected local probes showed much smaller variation than the target probe, leading to an underfitted linear regression model and thus low imputation quality. In contrast, the methylation profile of the target probe is strongly associated with the distribution of methylation levels from all HM27 probes in its assigned North Shelf group, as indicated in Figure 2B. Therefore, after the functional predictors are added, the model can utilize the information from these nonlocal probes, including probes on different chromosomes, to alleviate the underfitting problem.
Performance of Quality Metrics
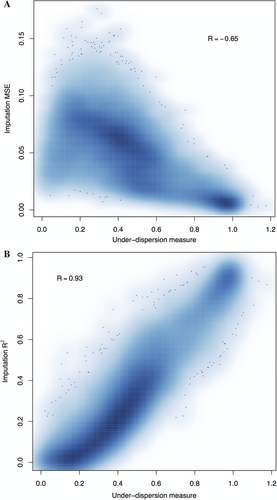
Because not all target probes can be imputed with the same level of accuracy, we tried to use the under-dispersion measure described in the Methods section to filter out inaccurate imputation results. We examined the relationship between imputation MSE/R2 and the under-dispersion measure. We observed a negative correlation between the imputation MSE and this quality measure (Fig. 3A, Pearson correlation coefficient, R = –0.65), and a positive correlation between imputation R2 and the measure (Fig. 3B, Pearson correlation coefficient, R = 0.93). Therefore, when performing imputation, we can calculate the under-dispersion measure and use it to filter out low-quality imputation results. Figure 3 indicates that by choosing an appropriate threshold, we can remove most probes imputed with low-quality while simultaneously retaining nearly all probes imputed with high-quality. Based on our results, we suggest a threshold of 0.8 for the under-dispersion measure, which removes all badly imputed probes (defined as true R2 < 0.2) at the cost of 1.24% well-imputed probes (true R2 > 0.8). Table 2 shows the number of probes passing post-imputation quality filter at varying thresholds of the under-dispersion measure and we see that our penalized functional model results in up to 86.0% more probes that can be used for further analysis.
| Under-dispersion measure threshold | 0.6 | 0.7 | 0.8 | 0.9 |
|---|---|---|---|---|
| Among top 20,000 probes | ||||
| Covariates only | 2,113 | 1,592 | 1,174 | 681 |
| Covariates + functional predictor | 2,677 | 1,691 | 1,226 | 719 |
| Improvement | 26.7% | 6.2% | 4.4% | 5.6% |
| Among all probes | ||||
| Covariates only | 14,479 | 8,796 | 5,123 | 2,417 |
| Covariates + functional predictor | 26,924 | 13,117 | 6,526 | 2,684 |
| Improvement | 86.0% | 49.1% | 27.4% | 11.1% |
Power Gain in Association Study
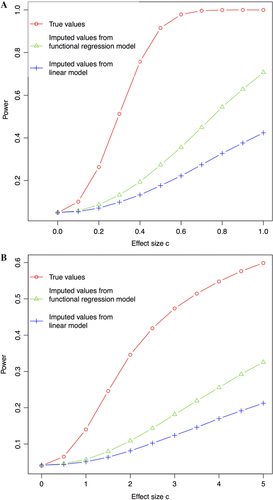
It is not surprising to find relatively little difference in the performance of the two models at the two ends of the distribution (Fig. 1A and B) because of probes that are either trivial or impossible to impute. Therefore in our work, we focus on the ∼34% probes with imputation R2 between 0.1 and 0.3, where our model demonstrates advantages over simpler models. As shown in Figure 4, using imputed values from the penalized functional model for association tests is consistently more powerful than using values from the simple linear model, while the type I error rate (when c = 0) was still under proper control. These results suggest that even using probes with moderate imputation quality can substantially improve the statistical power of association test while maintaining the desired type I error rate.
Discussion
In summary, we propose a penalized functional regression framework for across-platform imputation of methylation probes. Although a number of methods exist for predicting methylation levels at single CpG resolution, none of these directly apply to the across-platform imputation that we consider in this work. Moreover, we model information from nonlocal probes and have found such information considerably increase imputation performance. Our real data analysis demonstrates that by incorporating functional predictors from these nonlocal probes, our model can produce accurate imputation results when the reference panel (training set) and target panel (testing set) characterize the same tissue under similar conditions.
Because DNA methylation profiles are highly tissue and condition specific [Laurent et al., 2010; Lister et al., 2009; Varley et al., 2013], our method will not work well if the two datasets are from different tissues or very different conditions. Recent studies suggest some statistical models to predict methylation profile in target tissue from a surrogate tissue [Ma et al., 2014], which might be helpful in this case. Moreover, other systematic errors such as batch effect may also harm imputation quality. Therefore, we suggest using techniques such as principal component analysis to check for obvious discrepancies between reference and target panels before applying our method.
In various settings, a different way to construct predictors may further improve the performance of our model. For example, nonlocal probes can be categorized based on other properties, such as their relative location to a gene [Bibikova et al., 2011]. Another possible approach to select nonlocal probes is to choose HM27 probes highly correlated with the target probe (see Supplementary Methods). Supplementary Figure S1 shows that this approach can lead to better imputation performance, but the computational cost will be much higher. We can also explore other approaches to select local covariates, such as using a different number of probes, or choosing the local covariates as the 10 local probes that have the highest correlation with the target probe.
Because most CpG sites display stable DNA methylation levels, imputation error is low on average (the median imputation root MSE for beta values of all probes is ∼0.05). Dichotomizing at beta value of 0.5 following Zhang et al. [2015], our prediction accuracy is 94.9%, largely consistent with their reported 92% prediction accuracy. However, researchers may consider dynamic CpG sites to be of more interest, as these sites often colocalize with key regulators, such as enhancers and transcription factor binding sites [Ziller et al., 2013]. Therefore, we calculated quality metrics for individual probes, facilitating the evaluation of imputation quality for each probe and removing probes with low imputation quality for downstream analysis.
For probes showing a large variation of methylation levels, we notice that even after incorporating functional predictors, the imputation quality is still low for a significant portion of these probes. Possible reasons are the following: first, the DNA methylation profile alone does not provide sufficient information for accurate imputation. We may need to incorporate other information to improve imputation quality, such as local DNA context and the binding profile of regulatory proteins [Bhasin et al., 2005; Bock et al., 2006; Zheng et al., 2013], although this requires additional data sources in the same or similar tissue type that are rarely available. Second, HM27 has a much lower resolution than HM450. In addition, a large proportion of HM27 probes showed nearly constant methylation levels across samples. As such, an extreme case is that if the target HM450 probe is not correlated with any HM27 probes, the model will be underfitted with the predicted methylation levels for all samples close to the average, thus leading to smaller variance than expected, similar to under-dispersion observed with imputed SNP data [Li et al., 2009]. We expect to observe better performance if we impute from a denser microarray. For example, researchers are now replacing the HM450 array with the Illumina EPIC 850K array. We anticipate that imputation from 450K probes to 850K probes will exhibit a much better quality. Third, our normalization procedure does not fully eliminate the inconsistency of measurements between HM27 and HM450, which also affects the performance of our model. Here, we assumed only HM450 data are available for the training dataset, which is a more realistic setting. However, if the training set contains both HM27 and HM450 data in a real case, we can treat HM450 data as response and use HM27 data to construct predictors. Thus, predictors from both training and testing set are constructed from HM27 data and the inconsistency between HM27 and HM450 is automatically learned by the model. In this case, our model will show higher imputation accuracy.
Because a considerable proportion of CpG probes on HM450 overlap with SNPs (hereafter referred to as SNP-probes), we also examined whether imputation quality for these SNP-probes differs from that for non-SNP probes. Our annotation [Barfield et al., 2014] includes 98,741 CpGs that have an SNP somewhere underneath the 50 bp probe, among which 62,777 are QC+ HM450-specific sites. We found that the SNP-probes are slightly less varying than the non-SNP probes (e.g., median variance of β values is 0.00310 and 0.00356, respectively; Table 3). Analogous to rarer variants in SNP imputation [Duan et al., 2013; Li et al., 2009; Liu et al., 2012; Pistis et al., 2015], it is not surprising to find that these SNP-probes appear slightly easier to impute when measured using MSE (e.g., median MSE is 0.00236 and 0.00263, respectively), but actually slightly more challenging to impute when measured using the more honest information content R2 metric (median R2 is 0.162 and 0.182, respectively).
| Variance in β measurement | Imputation MSE | Imputation R2 | ||||
|---|---|---|---|---|---|---|
| Mean | Median | Mean | Median | Mean | Median | |
| SNP probe | 0.0131 | 0.00310 | 0.0110 | 0.00236 | 0.206 | 0.162 |
| Non-SNP probe | 0.0140 | 0.00356 | 0.0115 | 0.00263 | 0.223 | 0.182 |
The focus of the present work is on imputation per se rather than association analysis. After accurate imputation, we can combine data from multiple platforms to obtain methylation levels of more CpG sites for downstream analysis such as detecting methylation quantitative trait loci or EWAS [Heyn and Esteller, 2012; Rakyan et al., 2011]. Such analysis can take imputation uncertainty into account similarly as for imputed SNPs [Huang et al., 2014]. In this work, we evaluated the statistical power under the mostly commonly observed change in mean values, however, other forms of changes have been observed. For example, several studies [Gervin et al., 2011; Hansen et al., 2011] reported differences in the variation (in addition to the mean) of methylation values between cancer and healthy groups. Our simulation studies (Supplementary Methods S2) show a power improvement even using the standard logistic regression to test the mean difference under such variation differences. Regardless of the epigenetic architecture of the phenotype, we expect our imputation method, by allowing in higher resolution and more powerful exploration of the epigenome, will lead to rapid advances in understanding the functional role of normal DNA methylation and the impact of its aberration. Our method is implemented in R and freely available at https://github.com/Leonardo0628/pfr.
Acknowledgments
We thank the Cancer Genome Atlas (TCGA) project for generating the data. The research is supported by R01HG006292, R01HG006703 (awarded to Y.L.) R01MH105561 (awarded to J.K.) and P01 CA142538 (awarded to J.Y.T.).
The authors declare no conflict of interest.


