Genome-wide Association and Network Analysis of Lung Function in the Framingham Heart Study
ABSTRACT
Single nucleotide polymorphisms have been found to be associated with pulmonary function using genome-wide association studies. However, lung function is a complex trait that is likely to be influenced by multiple gene–gene interactions besides individual genes. Our goal is to build a cellular network to explore the relationship between pulmonary function and genotypes by combining SNP level and network analyses using longitudinal lung function data from the Framingham Heart Study. We analyzed 2,698 genotyped participants from the Offspring cohort that had an average of 3.35 spirometry measurements per person for a mean length of 13 years. Repeated forced expiratory volume in one second (FEV1) and the ratio of FEV1 to forced vital capacity (FVC) were used as outcomes. Data were analyzed using linear-mixed models for the association between lung function and alleles by accounting for the correlation among repeated measures over time within the same subject and within-family correlation. Network analyses were performed using dmGWAS and validated with data from the Third Generation cohort. Analyses identified SMAD3, TGFBR2, CD44, CTGF, VCAN, CTNNB1, SCGB1A1, PDE4D, NRG1, EPHB1, and LYN as contributors to pulmonary function. Most of these genes were novel that were not found previously using solely SNP-level analysis. These novel genes are involving the transforming growth factor beta (TGFB)-SMAD pathway, Wnt/beta-catenin pathway, etc. Therefore, combining SNP-level and network analyses using longitudinal lung function data is a useful alternative strategy to identify risk genes.
Introduction
Chronic obstructive pulmonary disease (COPD) is a progressive lung disease in which impeded airflow makes breathing difficult. COPD is estimated to become the fourth leading cause of death by 2030 [Mathers and Loncar, 2006]. Cigarette smoke is the most important environmental risk factor for COPD, but the development of COPD is not universal in smokers. This phenomenon indicates that other factors contribute to the etiology of the disease.
Pulmonary spirometric measurements, including forced expiratory volume in one second (FEV1) and ratio of FEV1 to forced vital capacity (FVC) (FEV1/FVC), are important indicators in the diagnosis of COPD and are heritable traits [Givelber et al., 1998; Wilk et al., 2000]. Although previous studies have primarily focused on cross-sectional analyses of adult lung function, pulmonary diseases such as COPD usually afflict patients in a certain age range. Cross-sectional studies may miss genetic effects by collecting lung function measurements at a time when genetic effects are weak.
Recent genome-wide association studies (GWAS) have focused on individual genetic effects on complex diseases and traits, but individual genes are unlikely to comprehensively underpin the cellular network structure. Lung function is a complex trait that is likely influenced by multiple gene interactions and environmental factors rather than a few individual genes. Therefore, network approaches to the genetics of complex diseases or traits provide attractive tools to better capture this complexity [Silverman and Loscalzo, 2012].
Several methods have been developed to integrate proteomics with genetics. Because using a protein–protein interactions (PPI) network can reduce the number of multiple comparisons [Emily et al., 2009], we used Jia et al.'s [Jia et al., 2011] method to integrate genome-wide association data and PPI networks. The advantage to this approach is that it uses all GWAS data, not only the top single nucleotide polymorphisms (SNPs) analyzed with other approaches. We explored the associations between pulmonary function and genes by building a cellular network to combine SNP level and network analyses using longitudinal lung function data from the Framingham Heart Study. Proving the viability of our comprehensive strategy, our results identified several genes that may be closely associated with pulmonary function.
Methods
Study Population
This study used the Framingham Heart Study population, which is primarily Caucasian (Fig. 1). Since 1948, three generations have participated in the study: the Original cohort, Offspring cohort, and Third Generation cohort. Participants underwent spirometry measurements, detailed medical histories, physical examinations, and laboratory tests approximately every 2 years [Feinleib et al., 1975]. A total of 2,698 genotyped participants with repeated lung function measurements (9,031 observations) in the Offspring cohort were used in the primary analysis. A total of 3,597 genotyped participants with cross-sectional lung function measurements in the Third Generation cohort were used for evaluation of the network analysis.

Spirometry Phenotypes and Covariates
Spirometry results with acceptable pulmonary function were used for analysis [ATS, 1995]. FEV1 and FEV1/FVC values obtained from participants in the Offspring cohort at exams 3, 5, 6, 7, and 8 were used as continuous outcomes. Our analysis included both time-independent and -dependent variables as covariates: gender (time-independent), age (time-dependent), height (time-dependent), pack-years (time-dependent), and smoking status at time of examination (time-dependent). Smoking status was coded as dummy variables (current smoker: yes/no; former smoker: yes/no). These covariates were commonly used in COPD/lung function genetic association studies [Silverman et al., 2009]. For validation of network analysis results, cross-sectional FEV1 and FEV1/FVC values from Third Generation cohort exams were used as outcomes, and covariates were measured cross-sectionally.
Genotyping and Quality Control
Genotyping for 500,568 SNPs in 9,354 subjects from three generations was conducted with Affymetrix 500K mapping plus Affymetrix 50K supplemental arrays and was additionally checked for sex accordance and consistency with family structure resulting 9,237 participants. Quality testing was conducted using PLINK software (version 1.06, http://pngu.mgh.harvard.edu/∼purcell/plink/). For quality control, individuals with genotyping call-rates <95% were removed (n = 499); genotyping rate in the remaining individuals was 98.6%. Ninety individuals from 13 families were removed due to Mendel errors. As another measure of quality control, SNPs were excluded if they failed Hardy–Weinberg tests (P < 1 × 10⁻⁶) (n = 19,546), had a maximum missing rate per SNP >5% (n = 34,110), or had a minor allele frequency <5% in this population. After filtering, 300,895 SNPs remained for analysis.
Population Stratification
FamCC 1.0 software [Zhu et al., 2008] calculated the principle components (PC) by using unrelated members in each family and applying the results to all individuals. The number of principal components we used in our study was based on the scree plot and we also examined the QQ plot that is close to the 45-degree line indicating proper adjustment for population stratification.
Statistical Analyses
SNP-level Analysis
The repeated measures of FEV1 and FEV1/FVC (exams 3, 5, 6, 7, and 8) were used as outcomes and data were analyzed using linear-mixed effects models with the pedigree MM R package for the association between lung function and individual alleles, assuming an additive model with adjustment for relevant covariates. Random effects accounted for the correlation among repeated measures within each subject and the correlation among observations from multiple individuals within a family in linear-mixed models. A kinship coefficient matrix accounted for correlation among individuals within a family and individual random intercept accounted for correlation among repeated measures within the same individual.
Network Analysis
Genome-wide association data and PPI networks were integrated for network analysis with dmGWAS 2.3 software [Jia et al., 2011]. FEV1 and FEV1/FVC were analyzed using all GWAS data. From SNP-level analysis results, this method chose the most significant SNP or the Simes method [Chen et al., 2006] to represent the significance of each gene and built a traits-related network using a seed gene-based approach and calculated scores for each module using the human PPI network from the Protein Interaction Network Analysis platform [Wu et al., 2009] that consisted of six databases: MINT, IntAct, DIP, HPRD, MIPS/MPact, and BioGRID. This dataset had 108,477 PPI as of December 12, 2012. For the module selection, the Third Generation cohort was used as the validation dataset. The top 5% of modules in both the discovery dataset (Offspring cohort) and the validation dataset (Third Generation cohort) were used to build the network.
Results
Table 1 summarizes the baseline gender-specific characteristics of the 2,698 study participants, who underwent an average of 3.35 repeated measurements per person for a mean of 13 years. Baseline FEV1 was higher in males; FEV1/FVC did not differ between genders. Additionally, the prevalence of current smokers at baseline was similar for both genders while the prevalence of former smokers was higher in males. A total of 3,597 participants from the Third Generation cohort were used as the validation dataset in network analysis (Table 1).
| Offspring cohort | Third Generation cohort | |||||||||||
|---|---|---|---|---|---|---|---|---|---|---|---|---|
| Male (n = 1,223) | Female (n = 1,475) | Total (n = 2,698) | Male (n = 1,706) | Female (n = 1,891) | Total (n = 3,597) | |||||||
| FEV1, L (SD) | 3.49 | (0.75) | 2.53 | (0.55) | 2.97 | (0.81) | 4.17 | (0.64) | 3.07 | (0.49) | 3.59 | (0.79) |
| FEV1/FVC, L (SD) | 0.75 | (0.08) | 0.76 | (0.08) | 0.76 | (0.08) | 0.77 | (0.06) | 0.78 | (0.06) | 0.78 | (0.06) |
| Follow-up time, years (SD) | 12.8 | (7.6) | 13.3 | (7.4) | 13.1 | (7.5) | — | — | — | — | — | — |
| Age, years (SD) | 51.9 | (11.2) | 51.8 | (10.8) | 51.9 | (11.0) | 40.2 | (8.7) | 40.0 | (8.7) | 40.1 | (8.7) |
| Height, inches (SD) | 69.12 | (2.62) | 63.72 | (2.39) | 66.17 | (3.67) | 70.00 | (2.57) | 64.61 | (2.41) | 67.17 | (3.67) |
| Pack-years* (SD) | 31.00 | (26.00) | 21.54 | (20.46) | 26.13 | (23.78) | 16.27 | (16.13) | 11.74 | (12.25) | 13.76 | (14.29) |
| Smoking status, n (%) | ||||||||||||
| Never smokers | 442 | (36.14) | 645 | (43.73) | 1087 | (40.29) | 1017 | (59.61) | 1037 | (54.84) | 2054 | (57.10) |
| Former smokers | 465 | (38.02) | 461 | (31.25) | 926 | (34.32) | 382 | (22.39) | 544 | (28.77) | 926 | (25.74) |
| Current smokers | 316 | (25.84) | 369 | (25.02) | 685 | (25.39) | 307 | (18.00) | 310 | (16.39) | 617 | (17.15) |
- *Pack-years mean and standard deviation calculated among current and former smokers.
- FEV1, forced expiratory volume in 1 sec; FEV1/FVC, forced expiratory volume in 1 sec/forced vital capacity; SD, standard deviation.
SNP-level Analysis
Genome-wide analysis of 300,895 SNPs (Bonferroni correction α = 1.66 × 10⁻⁷) did not detect any significant single SNPs associated with FEV1. However, three SNPs in SYNE1 (rs17701297, rs4870113, and rs10499269) and three SNPs in TASP1 (rs6134890, rs6042183, and rs6105115) had small P-values (P < 4.35 × 10⁻⁵). We used the first five PCs based on the scree plot and the QQ plot performance (Supplementary Fig. S1). The genomic inflation factor value of 1.03 suggested the P-values were appropriately distributed, and the QQ plot shows the P-values lie close to the 45-degree line. These suggested that population stratification and confounding effects were properly controlled.
Genome-wide analysis also did not detect any significant single SNPs associated with FEV1/FVC. However, SNP rs17417768 (P = 1.15 × 10⁻⁵) in SOX5, SNP rs7167951 (P = 2.30 × 10⁻⁵) in THSD4, and four SNPs in CNTN5 (rs11222969, rs17624571, rs11223109, and rs17094497) (P < 5.91 × 10⁻⁵) had small P-values. The genomic inflation factor value of 1.03 and the QQ-plot suggested the P-values were appropriately distributed. The top ten strongest SNPs associated with FEV1 and FEV1/FVC are shown in Tables 2 and 3, respectively. Manhattan plots are shown in Supplementary Figs. S2 and S3.
| SNP | Chr | Position | Band | Gene* | All1 | All2 | MAF | β-Estimate** | P-value |
|---|---|---|---|---|---|---|---|---|---|
| rs1450439 | 4 | 139493398 | q28.3 | — | A | G | 0.2373 | 67.90 | 4.38 × 10⁻⁶ |
| rs33794 | 3 | 45300605 | p21.31 | — | A | G | 0.4367 | –55.90 | 6.07 × 10⁻⁶ |
| rs10459348 | 13 | 85619082 | q31.1 | — | C | T | 0.255 | –62.60 | 9.84 × 10⁻⁶ |
| rs1349345 | 4 | 139490191 | q28.3 | — | C | G | 0.3647 | 56.40 | 1.39 × 10⁻⁵ |
| rs7227539 | 18 | 2377088 | p11.32 | — | A | G | 0.07416 | −101.00 | 1.58 × 10⁻⁵ |
| rs1932913 | 13 | 85617558 | q31.1 | — | T | C | 0.2569 | −60.50 | 1.88 × 10⁻⁵ |
| rs9365009 | 6 | 159340672 | q25.3 | — | A | C | 0.2704 | −58.50 | 1.98 × 10⁻⁵ |
| rs10779128 | 12 | 85153171 | q21.31 | — | A | G | 0.2262 | 63.50 | 2.28 × 10⁻⁵ |
| rs33773 | 3 | 45284315 | p21.31 | — | G | A | 0.4385 | −51.90 | 2.71 × 10⁻⁵ |
| rs28288 | 3 | 45290007 | p21.31 | — | G | A | 0.4283 | −52.60 | 2.77 × 10⁻⁵ |
- *None within gene regions; **β-estimates represent increased or decreased FEV1 in mL.
- SNP-estimates based on an additive model.
- SNP, single nucleotide polymorphism; FEV1, forced expiratory volume in 1 sec; Chr, chromosome; All1, allele 1; All2, allele 2; MAF, minor allele frequency.
| SNP | Chr | Position | Band | Gene | All1 | All2 | MAF | β-Estimate* | P-value |
|---|---|---|---|---|---|---|---|---|---|
| rs17417768 | 12 | 24558745 | p12.1 | SOX5 | T | C | 0.09 | −1.39 | 1.15 × 10⁻⁵ |
| rs7117082 | 11 | 133392294 | q25 | OPCML | G | T | 0.07 | 1.53 | 1.37 × 10⁻⁵ |
| rs11222969 | 11 | 100017048 | q22.1 | CNTN5 | C | T | 0.14 | 1.16 | 1.66 × 10⁻⁵ |
| rs3760905 | 19 | 4182939 | p13.3 | SIRT6 | G | T | 0.12 | −1.10 | 1.91 × 10⁻⁵ |
| rs7167951 | 15 | 71678963 | q23 | THSD4 | T | G | 0.34 | 0.83 | 2.30 × 10⁻⁵ |
| rs7945975 | 11 | 92562200 | q14.3 | FAT3 | G | A | 0.13 | 1.12 | 2.45 × 10⁻⁵ |
| rs7620133 | 3 | 134877681 | q22.2 | EPHB1 | C | W | 0.29 | 0.86 | 2.49 × 10⁻⁵ |
| rs539194 | 11 | 92329626 | q14.3 | FAT3 | T | C | 0.09 | 1.31 | 2.57 × 10⁻⁵ |
| rs7949157 | 11 | 92531356 | q14.3 | FAT3 | A | G | 0.15 | 1.06 | 2.95 × 10⁻⁵ |
| rs17624571 | 11 | 100005547 | q22.1 | CNTN5 | C | G | 0.13 | 1.13 | 2.96 × 10⁻⁵ |
- *β-Estimates represent increased or decreased FEV1/FVC in percentage; SNP-estimates based on an additive model.
- SNP, single nucleotide polymorphism; FEV1/FVC, forced expiratory volume in 1 sec/forced vital capacity; Chr, chromosome; All1, allele 1; All2, allele 2; MAF, minor allele frequency.
Networks Analysis
Using dmGWAS with most significant SNP in each gene, we found 3,282 single modules for FEV1 and 3,308 single modules for FEV1/FVC. Supplementary Figs. 4 and 5 show the networks for FEV1 and FEV1/FVC, respectively, built using the top 50 modules (approximately 1.5% of all modules). Through this network analysis using the Offspring cohort, we identified several modules associated with FEV1 that included key genes IGF1R, NCK1, KCNA2, RPL5, RMI1, GTF2IRD1, UBE2I, CRMP1, NEFL, DCTN4, and RPL5. Modules associated with FEV1/FVC included key genes CTNNB1, SCGB1A1, ANAPC4, CDH17, PAX6, TANC1, XRCC 6, APLP2, ANXA5, and BTRC. We used the Third Generation cohort as a validation dataset. A total of 12 modules for FEV1 (nominal P-value in validation dataset between 7.90 × 10⁻⁴ and 1.17 × 10⁻²) and 18 modules for FEV1/FVC (nominal P-value in validation dataset between 4.40 × 10⁻⁴ and 7.75 × 10⁻³) were top 5% modules in both the Offspring and Third Generation cohorts. Figures 2 and 3 show networks for FEV1 and FEV1/FVC, respectively, built by top modules. Genes in top modules identified in both networks of FEV1 and FEV1/FVC were LYN, EPHB1, ABL1, NCK1, ERBB4, NRG1, NRG3, and DLG2. Other key genes in modules associated with FEV1 included SMAD3, TGFBR2, CD44, CTGF, and VCAN; genes in modules associated with FEV1/FVC included GRIN2B and PDE4D.
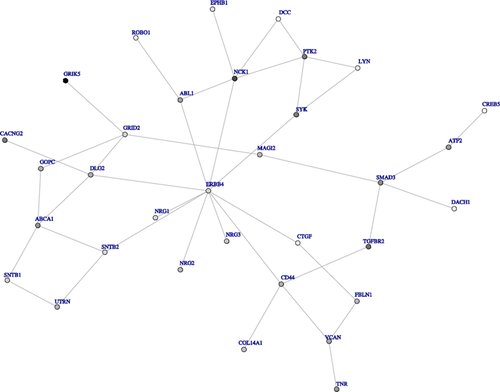
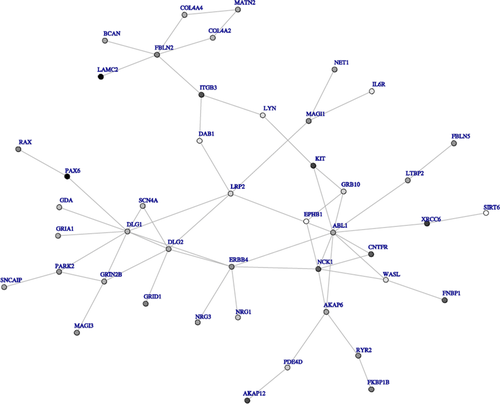
We also used dmGWAS with the Simes method to identify top modules using the Offspring cohort, and validated the results using the Third Generation cohort. A total of 32 modules for FEV1 and 5 modules for FEV1/FVC were top 5% modules in both the Offspring and Third Generation cohorts. Figures 4 and 5 show networks for FEV1 and FEV1/FVC, respectively, built by top modules. Genes in top modules identified in both networks of FEV1 and FEV1/FVC were LYN, EPHB1, WASL, GRB2, and PKP1.
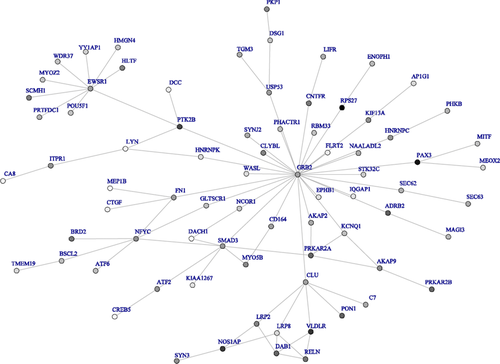
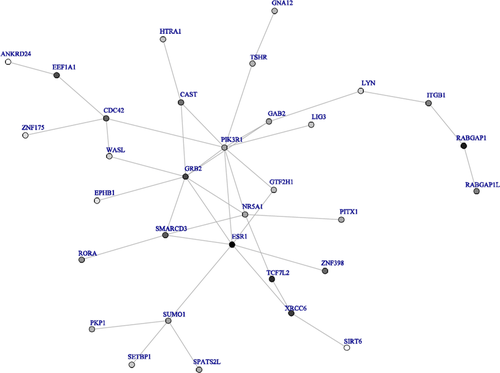
In summary, genes identified in networks of FEV1 by both methods were ATF2, CREB5, CTGF, DACH1, DCC, EPHB1, LYN, and SMAD3 and in networks of FEV1/FVC by both methods were EPHB1, LYN, WASL, SIRT6, XRCC6. Genes identified in both networks of FEV1 and FEV1/FVC using both methods were EPHB1 and LYN.
Discussion
This GWAS of longitudinal lung function in the Framingham Heart Study identified SMAD3, TGFBR2, CD44, CTGF, VCAN, CTNNB1, SCGB1A1, PDE4D, and NRG1 through network analysis. These genes may play important roles in lung function, in accordance with previous literature.
For FEV1 network analysis validated by the Third Generation cohort (Fig. 2), we identified several genes with previously established ties to pulmonary function. The transforming growth factor beta (TGFB)-SMAD pathway is aberrantly expressed in patients with COPD [Zandvoort et al., 2006], and SNP rs28683050 in SMAD3 is associated with COPD in a Chinese population [Yang et al., 2010]. Increased TGFB type II receptor (TGFBR2) expression is observed in both the tunica media and intima from 14 patients with severe COPD who underwent lung transplantation [Beghe et al., 2006]. Further, TGFBR2 expression is decreased in the bronchial glands of smokers with COPD [Baraldo et al., 2005]. COPD patients also have a higher percentage of alveolar macrophages with low CD44 surface expression compared to smokers with normal lung function and nonsmokers [Pons et al., 2005]. Coexpressed CD44 and CD11b receptors are significantly increased in neutrophils in the submucosa of COPD patients [Di Stefano et al., 2009]. Serial gene expression and microarray analyses comparing lung tissue expression from COPD patients and control smokers shows altered CTGF expression in alveolar epithelial cells, airway epithelial cells, and stromal and inflammatory cells of COPD patients [Ning et al., 2004]. In addition, VCAN expression negatively correlates with FEV1 in human alveolar walls and rims [Merrilees et al., 2008].
For FEV1/FVC networks built by the top 50 modules from the discovery dataset of the Offspring cohort (Supplementary Fig. 4), CTNNB1 is involved in the Wnt/beta-catenin pathway. Beta-catenin signaling contributes to myofibroblast differentiation and extracellular matrix production. Wnt/beta-catenin pathway expression is increased in pulmonary fibroblasts of COPD patients [Baarsma et al., 2011]. Circulating CC-16 levels correlate with mRNA expression of SCGB1A1 in sputum [Kim et al., 2012], and CC-16 levels are reduced in COPD patients compared to smoking and nonsmoking controls. PDE4D associates with COPD in a case-control study of Japanese and Egyptian populations [Homma et al., 2006].
We identified NRG1 in both FEV1 and FEV1/FVC networks validated by the Third Generation cohort (Figs. 2 and 3). NRG1 encodes the alternative splicing isoform heregulin, which has higher expression in intact epithelium of resected bronchial tissue from COPD patients [de Boer et al., 2006]. In addition, CNTN5 had a small P-value in our SNP level analysis, consistent with previous results that associate CNTN5 with both FEV1 and FEV1/FVC [Obeidat et al., 2011]. Further research will investigate the correlations between SMAD3, TGFBR2, CD44, CTGF, VCAN, CTNNB1, SCGB1A1, PDE4D, and NRG1 and lung function or COPD through larger scale GWAS and mechanistic studies.
It is important to emphasize that the lack of an independent external replication population limits our interpretation. Residents in Framingham, Massachusetts may differ from the general population in terms of several environmental risk factors associated with lung function, such as smoking, occupational exposure, or air pollution. Nonetheless, given the exploratory nature of this study, our findings suggest that combining SNP level and network analyses may identify some genes that have moderate individual effects but strong interaction effects. This gene network may better reflect how genes affect complex diseases or endophenotypes. Our results demonstrate that these approaches can be implemented practically to aid discovery of novel gene associations.
Acknowledgments
The authors declare that they have no actual or potential competing financial interests.
The Framingham Heart Study is conducted and supported by the National Heart, Lung, and Blood Institute (NHLBI) in collaboration with Boston University (Contract No. N01-HC-25195). This manuscript was not prepared in collaboration with investigators of the Framingham Heart Study and does not necessarily reflect the opinions or views of the Framingham Heart Study, Boston University, or NHLBI. Funding was provided by the National Institute of Environmental Health Sciences (ES00002). Funding for SHARe genotyping was provided by NHLBI (Contract N02-HL-64278). Funding for the Framingham Social Network datasets was provided by the National Institute on Aging (P01 AG 031093).
We would like to acknowledge the comments of Edwin K. Silverman, MD, PhD from Harvard Medical School and research assistance of Zhaoxi Wang, MD, PhD from Harvard School of Public Health.


