Major fluvial erosion and a 500-Mt sediment pulse triggered by lava-dam failure, Río Coca, Ecuador
Abstract
The failure of a 144-m-high lava-dam waterfall on the Río Coca, Ecuador, in February 2020 initiated a catastrophic watershed reset—regressive erosion upstream and a massive sediment pulse downstream—as the river evolves towards a new equilibrium grade. The evolution of this river corridor after a sudden base-level fall embodies the “complex response” concepts long understood through laboratory experiments, numerical modelling and smaller-scale field studies, but that have not been observed in the field before on this scale. This paper presents geomorphic and geotechnical data to characterize the evolution of the Río Coca since 2020. In the three years after the lava-dam failure, the erosion front migrated almost 13 km upstream along the mainstem river and triggered secondary headcuts that began migrating up tributaries. Erosion of the mainstem and tributary valleys generated a sediment pulse estimated to be 277 million m3 and ~500 million tonnes (Mt) over three years, depositing sediment tens of meters thick over tens of kilometres downstream from the former waterfall. This sediment pulse is one of the largest in modern times, comparable to the annual sediment load of a major continent-draining river but with orders-of-magnitude greater sediment yield. Geomorphic adjustment of the Río Coca represents a highly unusual natural disaster threatening life, property, water quality, the regional economy, major infrastructure and energy security. However, this event also provides a rare opportunity to learn how a large autogenic watershed disturbance and recovery evolve, with important lessons for interpreting the sedimentary record of volcanic landscapes.
1 INTRODUCTION
Fluvial system response to disturbance was one of the earliest research problems investigated in experimental geomorphology, inspiring flume studies by, e.g., Lewis (1944) and Schumm (1973), who built on ideas proposed by G.K. Gilbert and W.M. Davis in the late 19th and early 20th centuries. Early studies of intrinsic disturbance demonstrated that an abrupt decrease in the base level of a stream channel causes a complex geomorphic response upstream and downstream, driven by evolution toward an equilibrium grade (Mackin, 1948). Schumm (1973, 1977) described this “complex response,” including episodic regressive erosion (upstream knickpoint migration) along the mainstem and tributary channels, accompanied by hillslope retreat. Numerical models have explored these principles in more recent decades, beginning with, e.g., Slingerland & Snow (1988) and Willgoose et al. (1991) and, more recently, coupled with field and remote-sensing data (Gran et al., 2013). Base level can change because of tectonic activity, landscape response to glaciation or deglaciation, or from autogenic changes to the longitudinal profile of a river as a knickpoint forms (due to stream capture, meander cutoff or incision into a more resistant substrate) or collapses (e.g., Whipple, 2004).
Despite the long-standing research interest in the effects of changing base level, opportunities to monitor these processes in the field on easily observable time scales are exceedingly rare. This paper describes the fluvial response to a sudden base-level adjustment on a scale that, to our knowledge, is unprecedented in the historical era. The base-level fall in this case resulted from the failure of a 144-m-high lava-dam waterfall called the Cascada San Rafael, which had provided grade control on the Río Coca, a fifth-order river channel in Ecuador. In 2020 the Río Coca undermined the lava dam, initiating regressive erosion and a corresponding sediment pulse on a massive scale. The evolution of the Río Coca since 2020 represents a rapidly progressing example of watershed response to “rejuvenation” after crossing a major, intrinsic geomorphic threshold in the sense envisioned by Schumm (1973).
This paper presents evidence of fluvial response to major base-level lowering on the Río Coca, quantifying the rate, geomorphic characteristics and spatial extent of regressive erosion and contemporaneous downstream progression of the sediment pulse. We demonstrate that the patterns of erosion and deposition resemble those that follow intentional dam removals, but on a scale one to two orders of magnitude larger and with greater complexity in a geologically heterogenous river corridor, and we consider this sediment pulse in the context of other large natural and anthropogenic sediment pulses. We then summarize the practical implications of this unusual natural hazard, which poses acute and chronic threats to lives, property, critical infrastructure, the regional economy, water quality and energy security. Finally, we discuss implications for interpreting transient landscapes and the sedimentary record downstream of volcanic terrain.
2 STUDY AREA
2.1 Watershed and volcanic setting
The Río Coca watershed is located on the eastern side of the Andes Mountains, in the upper Amazon River basin of eastern Ecuador (Figure 1). The region falls within the Af zone (tropical, fully humid rainforest) in the Köppen-Geiger climate classification (Beck et al., 2018), and the immediate region of interest has an annual rainfall of 1,500 mm (Hijmans et al., 2005).
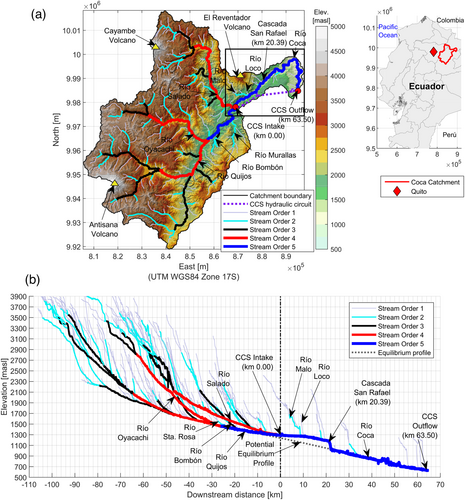
The watershed includes complex volcanic terrain: Pleistocene, Holocene and recent basaltic andesite and andesitic lava flows, pyroclastic deposits and volcaniclastic mass-wasting deposits. These young volcanic and volcaniclastic strata, most of which have not been named formally, overlie sandstones, shales and limestones of the Cretaceous Napo Formation and basaltic lava and pyroclastic units of the Jurassic Misahualli Formation (Barrera Crespo, 2021a, 2021b; INECEL [Instituto Ecuatoriano de Electrificacion], 1988; Reyes et al., 2021). The Pleistocene and younger volcanic and volcaniclastic deposits in the part of the Río Coca basin discussed here are derived from the eastern flank of El Reventador, a stratovolcano with a caldera rim reaching 3,500 m in elevation (Figure 1).
El Reventador has been active continuously since 2002, producing lava flows, several pyroclastic flows and near-daily ash plumes (Samaniego et al., 2008). Its eastern flanks are draped with recent, unvegetated lahar and pyroclastic deposits. It is evident from the volcanic-edifice topography that much of the volcano's eastern side collapsed or was destroyed by a lateral eruption at some time in the past, directing voluminous mass wasting eastward into the Río Coca valley (Hall et al., 2004).
2.2 The 2020 lava-dam failure
This study focuses on major fluvial erosion that began with the loss of grade control at the Cascada San Rafael, formerly the tallest waterfall in Ecuador (Figure 2a, location on Figure 1). The lava flow comprising the Cascada San Rafael formed a 144-m-tall knickpoint in the Río Coca profile 9 km east of the El Reventador caldera at an elevation of 1,160 m (the top of the falls) and with an upstream watershed area of 3,700 km2. The lava flow, approximately 100 m thick at the waterfall location, overlies a matrix-supported, poorly indurated, volcaniclastic debris-avalanche deposit radiocarbon-dated to 19 ka (INECEL [Instituto Ecuatoriano de Electrificacion], 1988). The unconformable contact between the lava flow and debris-avalanche deposit was exposed in the waterfall profile (Figure 2b). During the time that the lava dam existed, sediment filled the accommodation space upstream of this grade control.
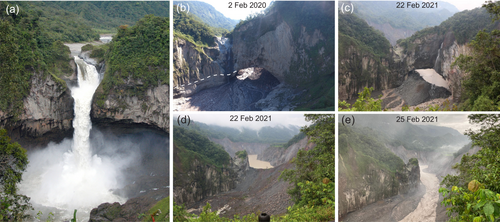
The waterfall was geomorphically dynamic in the decades before its failure. In the late 1990s, the Cascada San Rafael was a two-stage waterfall but by 2010 most of its lower bench had eroded, leaving the waterfall cantilevered over a recessed base. The eventual knickpoint failure (in 2020) revealed that the plunge pool downstream of the lava dam had scoured below the basaltic lava flow. The waterfall eroded into unconsolidated material beneath the basalt that presumably developed piping pathways.
A sinkhole developed before the river undermined the lava dam, beginning in mid-2019 (Reyes et al., 2021). The sinkhole formed immediately upstream of the falls, to the west of the river. On 2 February 2020, the sinkhole captured the entire discharge of the Río Coca. The river abandoned its former course over the falls (Figure 2b) and triggered headward erosion through volcaniclastic sedimentary deposits. It is not known why the sinkhole formation and capture occurred with this particular timing, but these events appear to have been entirely natural, not anthropogenic. The authors are not aware of analogous situations having occurred at other lava dams.
The river flowed beneath the relict arch of the abandoned lava dam until, in February 2021, the remaining arched edifice of the lava flow collapsed (Figure 2). The arch collapse formed a debris dam that impounded the river for several hours until the temporary reservoir behind it filled, overtopping and breaching the debris (Figure 2C–E; Barrera Crespo, 2021a, 2021b, 2023a, 2023b). The breaching event caused an outburst flood equivalent to approximately the 200-year flood magnitude (0.005 Annual Exceedance Probability [AEP]).
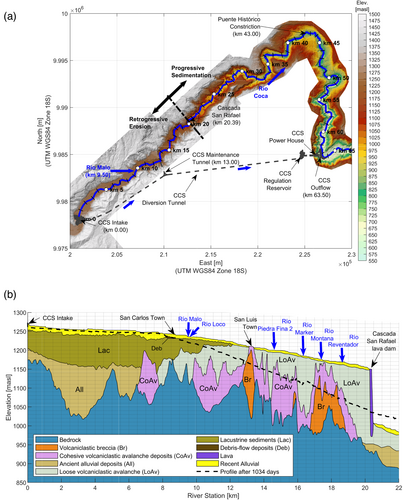
This study describes geomorphic changes following the loss of the Cascada San Rafael knickpoint along a 65-km reach of the Río Coca extending from the diversion-tunnel intake of the Coca Codo Sinclair (CCS) hydroelectric facility, 20.39 km upstream of the former Cascada San Rafael location (river-kilometer [rkm] 0), to just downstream of the diversion-tunnel outlet and hydropower generators at rkm 63.50 (Barrera Crespo, 2021a, 2021b; Gibson et al., 2021), about 43 km downstream of the Cascada San Rafael site (Figures 1b, 3a).
2.3 River corridor geology and stratigraphy
The Río Coca is primarily a gravel-bed river throughout the 65-km reach of interest, with intra-channel deposits of pebble, cobble and boulder clast sizes. Sand deposits occur in eddies, as localized interstitial material on channel-margin gravel bars, and beneath a gravel armour layer.
Beneath these modern alluvial deposits are geologic strata evident from boreholes collected for the CCS hydropower project (INECEL [Instituto Ecuatoriano de Electrificacion], 1992) and subsequent examination of outcrops (the exposure of which has increased dramatically since 2020). These deposits indicate that the geologic history of El Reventador's activity affects the rate and pattern of the complex response in this system. The rate and processes of the regressive erosion adjust as it encounters loose volcaniclastic mass-wasting deposits, more cohesive mass-wasting and debris-flow deposits and lacustrine materials deposited in the backwaters upstream of the former lava dam. A brief description of these units follows; the Methods and subsequent sections discuss new measurements of their erodibility.
Based on field observations and the boreholes drilled in earlier decades, the geologic units underlying the riverbed include (1) Volcanic bedrock (Jurassic) consisting of andesitic and trachytic tuffs and lavas, overlain by sandstone-dominated Cretaceous rocks exposed in isolated outcrops along the highest parts of the mountainous margins of the Río Coca valley between rkm 8.0 and 65.0; (2) an indurated volcaniclastic breccia unit (orange unit ‘Br’ on Figure 3b, described as also including several lava beds) that underlies the volcaniclastic avalanche deposits and fluvio-lacustrine material, outcropping intermittently between rkm 9.0 and 18.3; (3) volcaniclastic debris-avalanche deposits exposed between rkm 7.4 and 22.5, consisting of matrix-supported material from silt to boulders, poorly sorted. The avalanche deposits occur as two units, a lower cohesive unit (pink ‘CoAv’ in Figure 3b) and an upper non-cohesive or loose unit (grey ‘LoAv’). An irregular contact between them occurs indistinctly near the surface between rkm 9.8 and 18.3. The non-cohesive avalanche unit, dated to 19 ka, directly underlay the lava dam; (4) ancient alluvial and colluvial deposits (tan ‘All’ on Figure 3b), not exposed at the surface but evident in borehole material (INECEL [Instituto Ecuatoriano de Electrificacion], 1992); (5) fluviolacustrine deposits composed of fine, cohesive sediment, exposed along the present (2023) riverbed intermittently between rkm 0 and 12 (‘Lac’ on Figure 3b); (6) debris-flow deposits associated with the Río Malo confluence, overlying the fluviolacustrine, avalanche and breccia deposits along rkm 8.0 to 8.5 (dark brown ‘Deb’ on Figure 3b). The volcanic breccias and cohesive avalanche deposits pre-date the lava dam (based on field relations), whereas the non-cohesive avalanche deposits are considered likely contemporaneous with the lava dam and several other small local lava flows. The fluviolacustrine deposits formed later as accommodation space filled upstream of the lava dam.
Whereas the subsurface geology is better understood upstream of the lava dam due to extensive exposure since 2020, there is less information about subsurface materials (and they are less relevant to recent landscape processes) downstream, where the river corridor is not eroding. However, a notable change occurs in the river-corridor geology and morphology at rkm 43, where the river makes a major eastward bend and enters a narrow bedrock slot canyon (<20 m wide) carved into Cretaceous sedimentary rock. The bedrock canyon extends from rkm 43 to 49, although interrupted by a 500-m-long alluvial section. Downstream of the slot canyon, the river resumes a gravel-bed alluvial morphology from rkm 49 to 65. Below the study reach, the Río Coca remains alluvial but transitions to a lower-gradient, anastomosing morphology around rkm 76, which continues for most of the next 80 km downstream to its confluence with the Río Napo.
2.4 Hydrology
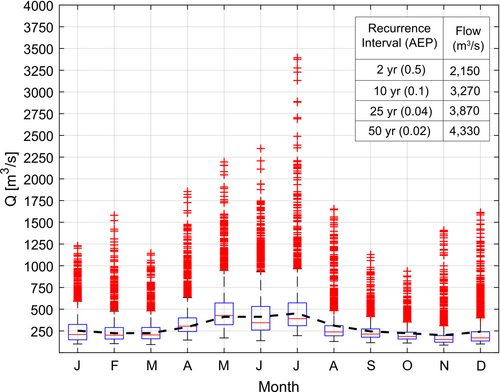
Flows in the Río Coca vary seasonally, with a wetter season from April through August and relatively drier, lower-flow conditions from September to March, although high flows can occur during the “dry” season (Figure 4). Analysis of flows gaged on the Río Coca upstream of the CCS Dam and reservoir (below the Río Salado confluence; Figure 1) since 1972 indicates that the 2-year flood (flow peak with 0.5 AEP) is 2,150 m3/s and the 50-year flood (0.02 AEP) is 4,330 m3/s (Figure 4). The mean daily flow in the study reach is 293 m3/s, which is exceeded 35% of the time.
Several ungaged tributaries join the Río Coca along the 65-km reach of interest. The largest of these is the Río Malo, which enters the Río Coca from the west at rkm 9.50 (Figure 1). A debris fan at the Río Malo confluence exerts some degree of hydraulic control on the mainstem river, indicated by a subtle inflection in the pre-failure profile (Figure 3b) and the transition from multi-thread alluvial river morphology above the fan to a single-thread channel below it, suggesting sediment deposition above the debris fan.
3 METHODS
3.1 Geomorphic change analysis
The fluvial response to the sudden decrease in base level after the loss of the Cascada San Rafael knickpoint was investigated through field and remote-sensing operations beginning in February 2020. Due to the large spatial extent of the affected river corridor and the fact that rkm 15–65 is a remote area with no road access to or near the river, data collection has been concentrated in the reach upstream of the former waterfall, from rkm 0 to 21. This upstream region has been accessed repeatedly for direct field observations of channel morphology, measurement of physical characteristics of fluvial sediment and riverbank geology, aerial photography, and establishment of geodetic survey control points to support airborne lidar and photogrammetry data collection. Available lidar coverage includes one dataset that spanned the entire study reach from rkm 0 to 65 before the knickpoint failure (October 2012, which we use as a proxy for the pre-failure riverbed of 2 February 2020) and additional airborne lidar datasets collected on 17 June 2020, 26 February 2021, 21 April 2021, 24 July 2021 and 2 December 2022.
Observations of geomorphic change have been made on numerous additional dates between February 2020 and February 2023 using uncrewed airborne system (UAS)-based photography, helicopter overflights, direct site visits along rkm 0–12 and at rkm 65 and photographs taken from limited roadside viewpoints between rkm 20 and 43. The position of the headcut has been observed on a near-daily basis by direct site visits or UAS photography, coordinated by the Corporación Eléctrica del Ecuador. Although the scale of the erosion is large enough to be visible in Sentinel-1 (Graw et al., 2022) and Sentinel-2 satellite imagery, we base our geomorphic analyses on lidar and imagery from helicopter and UAS platforms due to their spatial resolution being much higher than that of available satellite data.
The study team evaluated the magnitude and timing of erosion quantitatively along the mainstem Río Coca from rkm 0 to 21 using airborne lidar and photogrammetry data to measure the position of the channel thalweg, to evaluate changes in the longitudinal profile, and to calculate volume changes that represent patterns of erosion and sediment deposition. The execution of topographic surveys was subject to weather conditions and accessibility considerations. We used a Mavic 2PRO drone equipped with a 20 MP Hasselblad camera to conduct photogrammetric surveys. Flight planning was conducted using UgCS software, while photo processing was performed using Agisoft Metashape software. A flight altitude of 280 m was set to achieve a resolution of 1.50 m/pixel for the digital elevation models (DEMs). The lidar surveys employed a Hesai Pandar 40 laser scanner mounted on a DJI Matrice 600 Pro drone. The laser scanner has a maximum range of 200 m. Accordingly, the flight altitude for lidar data collection was established at 70 m. Two Global Navigation Satellite System (GNSS) sensors with a horizontal precision of 3 mm and vertical precision of 5 mm were employed to collect geospatial coordinate data during the flights. The final position of the laser points was determined using specific sensor applications, resulting in DEMs with a resolution of 7 cm/pixel.
All surveys were conducted using the WGS84 UTM Zone 18S coordinate system (the boundary between Zones 17S and 18S is around rkm 0) with ground control points that were established during the construction of the CCS hydropower infrastructure, and additional points defined on the left bank of the river within the 65-km reach between the intake and the outlet of the power plant. In total, there were 89 control points distributed in the reach affected by regressive erosion upstream of the Cascada San Rafael lava dam and 22 points in the sedimentation-prone stretch downstream of the former waterfall. Due to the rapid erosion, many control points were lost and new points had to be established outside the erosion-affected zone. This reestablishment process has been conducted repeatedly but is limited by the challenging accessibility resulting from slope failures along the river-corridor margins and the consequent destruction of roads and access points.
The loss of control points directly impacts the accuracy of the surveys. Therefore, to quantify the uncertainty of the topographic models, elevation differences in non-eroded areas were measured using the pre-failure elevation model of the Cascada San Rafael as a reference. The DEMs were compared on a pixel-by-pixel basis. To achieve this, we established a fixed area encompassing the entire eroded zone and an additional buffer zone to account for the non-eroded regions around the river corridor. This fixed area, extending 500 m to the left and 500 m to the right of the channel centreline, served as a boundary for clipping all of the DEMs. Through algebraic operations involving the DEMs, we computed both the total eroded volume and the average elevation difference in the non-eroded areas. This average elevation difference (which varies between surveys) serves as an indicator of uncertainty. As the erosion progresses, the loss of topographic control points intensifies, representing the primary source of measurement errors in subsequent lidar and photogrammetric surveys. Consequently, the average difference in non-eroded areas increases. Thus, as the final step of assessing uncertainty in the calculation of the eroded volume, we multiply the average elevation difference of non-eroded regions by the area of the eroded zone in each instance.
The DEM surfaces resulting from lidar and photogrammetric data collection were used to calculate volumes of material eroded from the river corridor upstream of the former Cascada San Rafael by differencing topographic surfaces using map functions in MATLAB™. To minimize uncertainty (as described above), each successive topographic surface was compared against the lidar-based DEM from October 2012, which we use as a proxy for the topography prior to the loss of fluvial grade control on 2 February 2020. For all of the computational tasks involving map algebra and DEM manipulation, we utilized the open-source MATLAB-based TopoToolbox library (Schwanghart & Scherler, 2014).
To evaluate the relative magnitudes of vertical incision and lateral valley-wall erosion, we imported the pre-event (2012) DEM and the December 2022 DEM into the Hydrologic Engineering Center's River Analysis System, HEC-RAS (U.S. Army Corps of Engineers, 2023). We digitized 77 orthogonal cross-sections along the 15-km reach upstream of the former waterfall (rkm 6–21) and delineated the historic alluvial corridor with bank vectors using RASMapper. We then used the conveyance zone volume tools in HEC-RAS to compute the erosion volume in the channel and the volume from widening outside of the initial channel corridor.
3.2 Physical properties of eroding materials
To constrain the physical properties of substrate and riverbank sediment eroding in the reach upstream from the former waterfall, for the purpose of supporting concurrent and future modelling studies, we measured erosion resistance in situ using the jet erosion test (JET) method (Hanson & Cook, 2004). We evaluated the erosion resistance of the volcaniclastic avalanche deposits (eight tests in the cohesive unit and nine tests in the non-cohesive or loose unit), breccia (five tests) and lacustrine deposits (23 tests). Our measurement and analysis procedures differed slightly from those presented by Hanson & Cook (2004). First, applied shear stresses exerted by the jet had to exceed the boundary shear stress corresponding to the bankfull discharge (approximately 700 Pa), which required a head up to 10.5 m (15 psi). This made the use of a constant-head tank impractical. Water was delivered directly to the jet tube by a Honda WL20XH pump with a total head of 32 m. Because of the oversized pump, pumped flow rates could be maintained at near-constant values over the required range of 0.5–11 m of head. Hence, pressure fluctuations at the jet-tube nozzle were negligible. Pressure at the nozzle was measured by a WIKA Type 232.53 stainless-steel pressure gage with a range of 10.5 m of head (15 psi) to an accuracy of 0.07 m of head (0.1 psi). A relationship between pressure read by the pressure gage and head at the nozzle was developed to calculate the jet velocity at the nozzle accurately, and consequently, shear stresses applied on the surface of the tested materials. Second, the method of Walder (2016) was used to calculate the ultimate, equilibrium depth of the scour hole formed by the jet instead of the more common Blaisdell et al. (1981) method. The latter method is known to overestimate equilibrium scour hole depth for cohesive or cemented soils/sediments, and therefore underestimates critical shear stress (Amin & Mazurek, 2016).
4 RESULTS
4.1 Geomorphic evolution
Geomorphic changes on the Río Coca between the time of the knickpoint failure in February 2020 and early 2023 were rapid and large-magnitude (Figures 5–8). Regressive erosion on the mainstem river advanced more than 12 km upstream from the former waterfall (from rkm 20.39 to rkm 7.7) between February 2020 and February 2023, based on near-daily field observations (Figure 5). The longitudinal profile is evolving towards equilibrium grade without the waterfall knickpoint, accompanied by massive erosion of retreating valley walls as the incision propagates up tributary valleys (Figure 6). As of early 2023 the river corridor upstream from the former waterfall knickpoint had undergone net incision locally of more than 100 m (Figure 7) and widened as much as 900 m into a new canyon morphology, especially around rkm 12–14 (Figures 6–8). Downstream sediment deposition caused a net increase in the riverbed elevation by as much as 30 m locally (in the few km nearest to the waterfall site, Figure 7) and substantially widened the active flow zone.
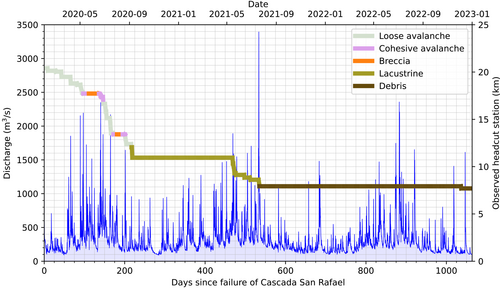
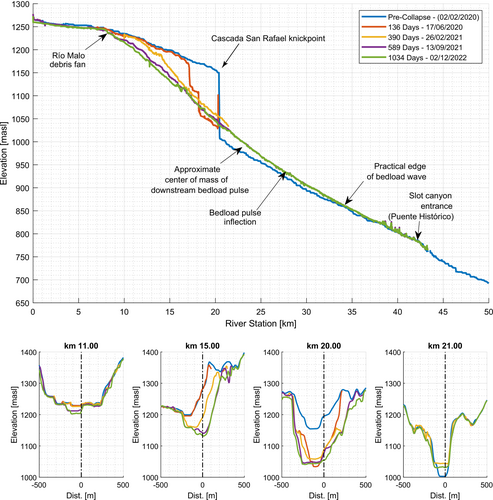
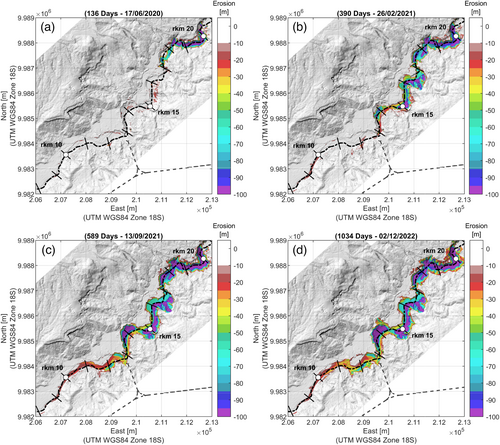
During the first year after the loss of the Cascada San Rafael knickpoint, the erosion front migrated approximately 10 km upstream (8 km in the first six months; Figures 5, 7) as it passed through primarily loose, unconsolidated avalanche deposits (Figures 3b and 5). Lidar data collected on 17 June 2020 showed the transient state of the river during those early months of rapid change: 136 days after the knickpoint failure the riverbed had incised 120 m immediately upstream of the former waterfall (degrading from 1,160 m to 1,040 m above sea level) as the knickpoint migrated upstream about 3.5 km (Figure 7). By 390 days (26 February 2021), shortly after the collapse of the remnant lava dam and corresponding outburst flood, the migrating knickpoint had become more diffuse, in part due to the exposure of relatively resistant lava flows around rkm 17 and 18 that formed two minor, short-lived waterfalls that were subsequently undermined and collapsed. By that time the headcut also had begun to access lacustrine substrate, around rkm 11, and the pace of regressive erosion slowed (Figure 5). Although the incision continued propagating upstream (e.g., at rkm 17 the riverbed had lowered by 40 m; Figure 7), deposition of sediment that had been eroded and transported from upstream had raised the bed elevation at the former waterfall site (rkm 20.39) from 1,040 m (maximum incision) to around 1,055 m as of February 2021 (Figure 7). By 589 days (13 September 2021), a diffuse knickpoint was evident around rkm 10–11 and the longitudinal profile had flattened while the headcut retreat had slowed, stalling on the resistant debris-fan deposits associated with the Río Malo confluence (Figures 3b, 5, 7). At that time (589 days) a lidar flight throughout the entire study reach revealed sediment deposition aggrading the riverbed by as much as 40 m at rkm 21 compared to its elevation before the waterfall failure (Figure 7). The September 2021 lidar data indicated aggradation as far downstream as rkm 65, the limit of the data coverage. The thickness of the new deposits diminished downstream, measuring around 2 m at rkm 63–65 (Figure 7).
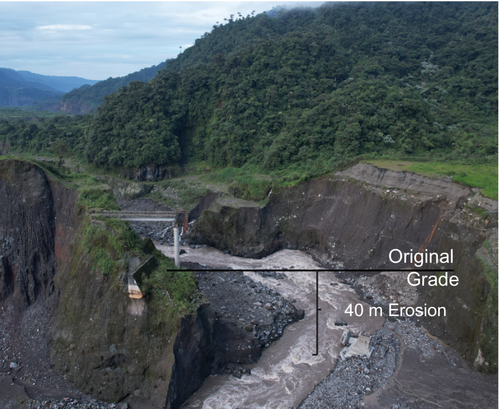
The pace of regressive erosion depends upon the flow history and the relative erosion resistance of the different geologic materials exposed at river level (Figure 5 and next section). The headcut retreat pattern in Figure 5 indicates that the riverbed incision appears to be a threshold process corresponding with larger flows during wetter seasons, especially during the first two years. Headcut retreat progressed most rapidly during the first year when the wet season coincided with the mainstem headcut eroding through loose volcaniclastic avalanche deposits (Figure 5). After its initial rapid onset in early 2020, the headcut retreat slowed substantially upon encountering lacustrine materials (September 2020) and did not resume until the wet season of 2021 (Figure 5). A 10-year flood event in July 2021 (peak flow 3,400 m3/s) was associated with event-driven regressive erosion, allowing the mainstem headcut to migrate upstream far enough to encounter more resistant debris-fan materials at the Río Malo confluence, where headcut retreat then stalled for more than a year (Figure 5). Erosion progressed more quickly through less-resistant loose volcaniclastic avalanche deposits (Figure 5), whereas cohesive avalanche deposits and indurated, well-cemented breccia outcrops have temporarily slowed the erosion and supported channel slopes as steep as 0.012, at least during low-flow conditions. However, even exposures of laterally continuous, relatively well-cemented breccia only slowed incision. The most competent and continuous breccia outcrop at rkm 12 has incised approximately 40 m, undermining the only road bridge crossing the mainstem river (Figure 8). The headcut position relative to geologic substrates shown in Figure 5 relates only to the mainstem river's headcut at the time indicated on the plot. Additional exposures of lacustrine, avalanche and breccia materials are eroding from tributary channels and valley walls, and the mainstem river headcut will access additional exposures of those materials that are now below riverbed elevation as evolution continues towards equilibrium grade (Figure 3b).
The debris-flow deposit at the confluence of the Río Malo is worth further consideration as it arrested the headcut for about 500 days (Figure 5) despite being a minor volumetric component of the subsurface materials (Figure 3b). The Río Malo has concentrated the deposits of multiple El Reventador lahars into an accumulation of rocks in the 0.5–2-m diameter range. These large clasts formed a resistant armour layer that created a localized convexity in the pre-failure bed profile (Figure 7). The debris fan at the Río Malo confluence slowed the upstream headcut erosion substantially for approximately one year, from mid-2021 to late 2022, causing the convexity evident around rkm 9 in the September 2021 longitudinal profile (Figure 7). However, by November 2022 incision of 1–2 m was observed visually by the authors on the mainstem river immediately upstream of the debris fan (around rkm 7.7–8.0) and a field site visit showed that regressive erosion upstream of there had resumed by April 2023.
Outcrops of Mesozoic basement rock at rkm 16 and 17 also temporarily slowed headward erosion. However, at both of those locations the mainstem Río Coca ultimately ‘flanked’ those resistant outcrops, with the active channel reorienting to go around them. The river then continued to erode through volcaniclastic avalanche deposits adjacent to the bedrock outcrops that were not laterally continuous, finding erodible materials in the valley and leaving the bedrock perched above the active flow zone.
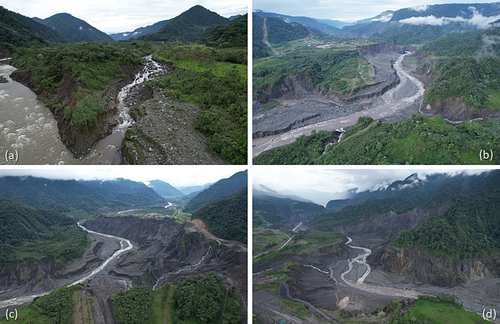
In addition to deepening the mainstem river channel, the regressive erosion has advanced up tributaries along the Río Coca valley as far upstream as rkm 8.5, where the Río Malo is now incising (Figure 6a). As of 2023, many tributary streams show a transient morphology with hanging waterfalls cascading over tributary knickpoints (Figure 6b–d). Groundwater seeps are visible in numerous locations within the walls of the newly exposed canyon. In the tributary and mainstem canyons, the valley walls are retreating through mass-wasting processes. Landslides of various sizes and forms (topples and slides, especially) occur frequently in the volcanic avalanche and breccia material, and tension cracks are commonly observed near the edges of sediment cliffs tens of meters high, indicating incipient failure. Together, the mainstem and tributary erosion exposes increasingly deep and wide outcrops of the fluviolacustrine, volcanic avalanche and breccia deposits that accumulated in the river valley over centuries to millennia while the Cascada San Rafael provided grade control.
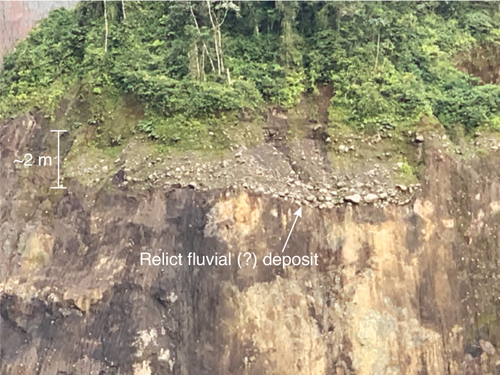
Field observations in the eroding zone indicate that the longitudinal profile and hydraulic control on the Río Coca fluctuated prior to the 2020 knickpoint failure. At rkm 14.5, where the riverbed has incised 60 m since 2020, exposures 2–3 m thick of rounded gravel are present in the eastern wall of the Río Coca canyon (Figure 9). These exposures are visible in several locations spanning 20–100 m in the longitudinal direction, at an elevation at least 20 m above a residual terrace representing the February 2020 riverbed. These deposits may be alluvial material from a relict river course, given their placement in the mainstem river corridor near no major tributary. Alternatively, they could be relict colluvium deposited prior to modern incision. Sorting near the base of the deposit (Figure 9) favours a fluvial origin. Whether these deposits are fluvial or colluvial, their presence indicates a higher downstream base level for the mainstem river corridor at some time in the past, perhaps due to an earlier, higher position of lava flows or volcanic debris downstream (cf. Reyes et al., 2021).
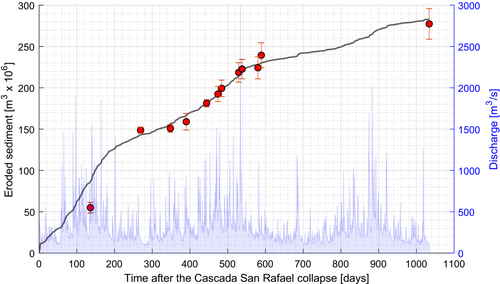
Topographic change detection from the lidar and photogrammetry datasets allowed us to compute the volume of material eroded from the reach upstream of the former waterfall since 2020 (Figures 10 and 11; Table 1). These calculations show that 55 ± 6.53 million m3 eroded in the first 136 days after the knickpoint failed (Figure 10). By February 2021, a year after the loss of the original knickpoint, the total eroded volume had increased to 159 ± 10.1 million m3. By 589 days (13 September 2021), 239 ± 15.1 million m3 had been eroded. The most recent estimates, using lidar data from 2 December 2022, indicate a total erosion volume of 277 ± 18.6 million m3 (Table 1; Figures 10, 11).
| Date | Time since waterfall failure [days] | Eroded volume [m3 × 106] | Volumetric uncertainty [m3 × 106] | River-kilometres included | Survey method | |
|---|---|---|---|---|---|---|
| Start Station [rkm] | End Station [rkm] | |||||
| 02-Feb-2020 | 0 | 0 | - | 0 | 63.5 | Lidar (Oct 2012) |
| 17-Jun-2020 | 136 | 55.0 | 6.53 | 0 | 21.0 | Lidar |
| 28-Oct-2020 | 269 | 148 | 3.77 | 10.0 | 21.0 | Photogrammetry |
| 15-Jan-2021 | 348 | 151 | 4.66 | 10.0 | 21.0 | Photogrammetry |
| 26-Feb-2021 | 390 | 159 | 10.1 | 0 | 21.5 | Lidar |
| 21-Apr-2021 | 444 | 181 | 4.42 | 10.0 | 21.0 | Lidar |
| 21-May-2021 | 474 | 193 | 9.19 | 0 | 21.0 | Photogrammetry |
| 31-May-2021 | 484 | 199 | 10.0 | 0 | 21.0 | Photogrammetry |
| 15-Jul-2021 | 529 | 219 | 11.8 | 0 | 31.5 | Photogrammetry |
| 24-Jul-2021 | 538 | 223 | 11.7 | 0 | 21.0 | Lidar |
| 04-Sep-2021 | 580 | 224 | 13.3 | 0 | 30.0 | Photogrammetry |
| 13-Sep-2021 | 589 | 239 | 15.1 | 0 | 63.5 | Photogrammetry |
| 02-Dec-2022 | 1,034 | 277 | 18.6 | 0 | 63.5 | Lidar |
Having projected the volume change in the original river corridor, our HEC-RAS analysis indicates that approximately 18% of the total erosion volume has resulted from channel incision. Bank failure and valley widening processes are responsible for most of the eroded mass (the remaining ~82%), with the right bank contributing almost half of that amount (~48%) and the left bank contributing one-third (~33%). The dominant contribution from bank failure and valley widening explains why the erosion volume did not stabilize from mid-2021 to late 2022 (Figure 11) despite the headcut migration having stalled (Figure 5).
The total eroded sediment mass can be estimated using the calculated total erosion volume (277 million m3) and the densities of eroding material (Supporting Information; Table S1). The average dry bulk density of the eroding sedimentary units (excluding the Mesozoic bedrock, which comprises a negligible proportion of the eroded material) is 1,623 kg/m3. Most of the erosion volume thus far has been derived from the two volcaniclastic avalanche deposits and the breccia (Figure 3b), which have an average dry bulk density of 1,837 kg/m3 (Table S1). Rounding these values to three significant figures, we use a density range of 1,620–1,840 kg/m3 when calculating the mass of the eroded sediment. Doing so yields a mass estimate of 449 to 510 million tonnes (Mt). As this estimate refers to the amount eroded as of the topographic data collection in early December 2022, it is reasonable to assume that ~500 Mt of material had eroded from the upstream river corridor by three years after the waterfall failure (by early 2023, the time frame considered herein).
The order-108 t of material eroding upstream of rkm 20.39 generated a massive sediment pulse that is evident from changes in the morphology of the river corridor downstream of the former waterfall site (Gibson et al., 2021, 2023). Although there is less quantitative information on the spatial and temporal progression of bed aggradation than there is on the upstream erosion, the sediment pulse has caused a visible widening of the active flow zone in the alluvial reach downstream of rkm 21 (Figure 12). As of December 2022, the thickness of the new deposition tapered from ~40 m at rkm 21 to less than 2 m at rkm 45 (Figure 7). By February 2023, field observations indicated some deposition as far downstream as rkm 70 (1–2 m or less, mostly as sandbars within eddies), in agreement with the December 2022 lidar survey (Figure 7). Lack of access to survey control or direct observation precludes evaluating processes with much quantitative detail between rkm 43 and 65.
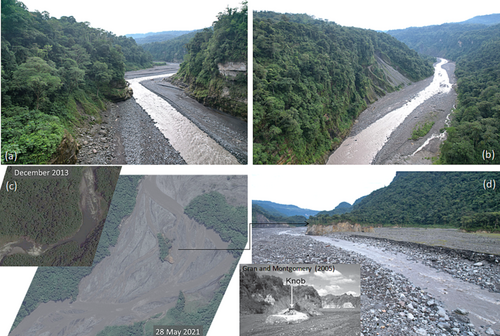
As of February 2023, areas of the alluvial reach observed at rkm 36–40, rkm 45 and rkm 65 had a multi-thread channel, in contrast to the single-thread morphology common throughout rkm 0–21. Truly braided morphology had occurred earlier (e.g., the 28 May 2021 satellite image of rkm ~ 21.5–23 in Figure 12c) but was not observed in 2023. Wetted-channel width was observed to be greater in the downstream reach in early 2023. For example, at a flow of ~100 m3/s the wetted width in the upstream reach (rkm 8 to 21) was 20–40 m, whereas from about rkm 23 to 43 the wetted width was commonly 40–80 m. These geomorphic differences between the upstream and downstream reach were evident in the field and in UAS imagery collected in February 2023 (Figures 6, 12), and were confirmed by examination of February 2023 satellite imagery from the Sentinel-2 platform (not shown). Unvegetated sediment deposits were common in the river corridor downstream of the Cascada San Rafael site after the waterfall failed and were still present as of February 2023 between rkm 21 and the bedrock slot canyon that begins at rkm 43. The presence of unvegetated sediment deposits spanning from valley wall to valley wall reflects multi-thread and locally poorly channelized flow (Figures 12, 13). In several locations, notably around rkm 36 and 40, steep, unvegetated hill slopes (active landslide areas) directly bordered the active river channel in February 2023 (Figures 12b, 13). The morphology of these slopes relative to the active river channel indicated that recent valley-wall-to-valley-wall channel migration had likely destabilized the slope toes, triggering or at least contributing to mass wasting that was introducing additional sediment to the river.
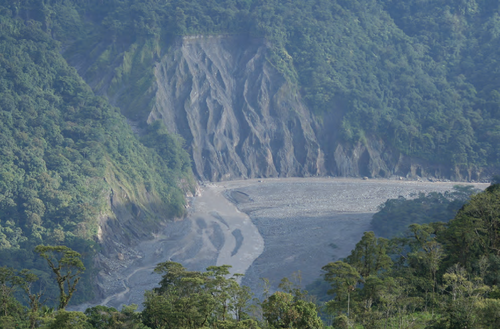
Notably, by February 2023 the reach immediately downstream from the former waterfall site (approximately rkm 20.5 to 23) did not have the multi-thread channel morphology observed farther downstream (Figure 12d). There, the flow of the Río Coca formed a single channel contained within banks 2–3 m high at a discharge of ~100 m3/s (Figure 12d). A wide sediment deposit east of the mainstem channel indicated that flow had extended from valley wall to valley wall recently, but incipient vegetation growth on that deposit suggested less-recent flow occupation than in areas 10–20 km downstream.
4.2 Physical properties of eroding materials
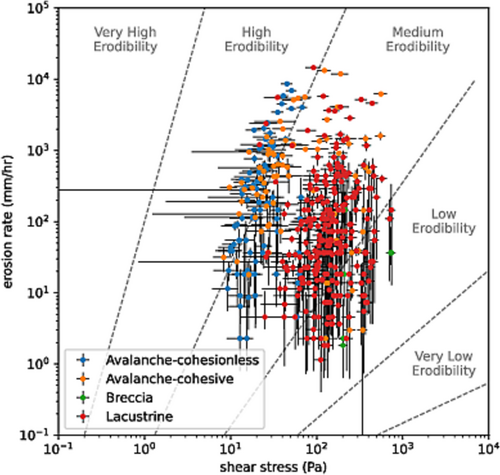
New erodibility measurements complement the previously known characteristics of geologic materials underlying and bordering the river corridor. The erosion functions for the tested geologic units formed two distinct clusters, plotted using the erosion categories of Briaud (2008; Figure 14). The erosion functions of both the older, cohesive and younger, loose (“cohesionless” in Figure 14) avalanche deposits generally fell along the High-Medium Erodibility boundary. The erosion functions of the lacustrine material fell mainly in the Medium Erodibility range, with some low erodibility measurements that overlapped with the erosion functions of the breccia unit. The material of the cohesive avalanche unit that was more erosion resistant had a different colour, pinkish grey (Munsell soil colour 5YR 6/2) compared to the characteristic grey colour (Munsell soil colour 10YR 6/1) of the loose avalanche deposits (as shown in Figures 3 and 5). The Munsell soil colours were determined for air-dried samples collected at each testing site.
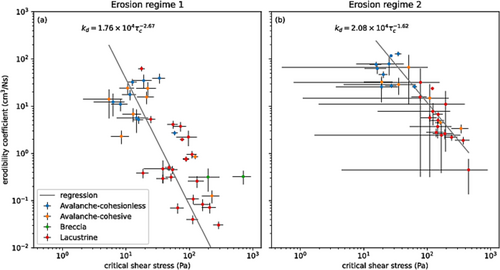
A similar material grouping was observed for the erosion-resistance parameters of both the particle-by-particle and mass erosion regimes (Figure 15). The JET results on avalanche and lacustrine deposits generally exhibited two erosion regimes, whereas the JETs on the breccia and the erosion-resistant cohesive avalanche units showed a single erosion regime only. The erodibility coefficients for the mass erosion regime (Figure 15b) were about an order of magnitude greater than those of the particle-by-particle erosion regime (Figure 15a). Thus, when the critical shear stress for the mass-erosion regime is exceeded, erosion could accelerate tenfold. Critical shear stresses of the cohesive avalanche deposit varied between 5.4 and 226 Pa (median value of 15.0 Pa) for erosion regime 1 and between 19.2 and 341 Pa (median value of 80.4 Pa) for erosion regime 2. Critical shear stresses of the loose, non-cohesive avalanche deposit varied between 6.3 and 58.6 Pa (median value of 14.8 Pa) for erosion regime 1 and between 15.6 and 63.3 Pa (median value of 25.0 Pa) for erosion regime 2. Critical shear stresses of the breccia unit varied between 197 and 705 Pa for its single erosion regime. Critical shear stresses of the lacustrine deposit varied between 17.6 and 289 Pa (median value of 80.1 Pa) for erosion regime 1 and between 77.1 and 449 Pa (median value of 149 Pa) for erosion regime 2. The median values indicate that the loose, cohesionless avalanche deposit has a more limited particle-by-particle erosion regime than the cohesive avalanche unit, and when shear stress exceeds 25 Pa could erode significantly faster. Critical shear stresses of the lacustrine deposit for erosion regime 1 are similar to those of the avalanche material for erosion regime 2, but the avalanche material will erode about 100 times faster based on the regression equations shown in Figure 15.
These newly quantified variations in erodibility among the four major substrate materials are consistent with the observed patterns of headcut migration and erosion volume (Figures 5, 11). Regressive erosion proceeded rapidly during the first seven months after knickpoint failure (February to September 2020) as the headcut migrated through primarily loose avalanche material but slowed upon accessing the more resistant lacustrine substrate after September 2020 (Figures 5, 11). As of early 2023, the headcut had arrived upstream of the resistant Río Malo debris-flow deposit (not JET-tested due to poor exposure and highly variable composition) and resumed eroding lacustrine material. These results imply that future regressive erosion through the lacustrine substrate would require more than an order of magnitude greater shear stress from flow events to produce erosion rates comparable to those observed in early–mid-2020.
5 DISCUSSION
5.1 Evolution of the Río Coca after knickpoint failure
The evolution of the Río Coca after the failure of the Cascada San Rafael knickpoint in 2020 embodies concepts long understood in fluvial geomorphology through laboratory experiments, numerical modelling and field studies of the geologic record, but that have never been seen before in the field of this order of magnitude: a sudden base-level drop of more than 140 m affecting more than 70 km of river length, causing regressive erosion to mobilize ~500 million tonnes of sediment. Examples of lava-dam formation and, in some cases, breaching exist in the literature, notably from studies of Pleistocene lava flows in the Colorado River basin, Arizona (Duffield et al., 2006; Fenton et al., 2004; Fenton et al., 2006) and Pliocene–Pleistocene examples in eastern Oregon (Ely et al., 2012). The evolution of a knickzone resulting from a 65-m base-level fall during Pleistocene deglaciation has been studied in detail on the Le Sueur River, Minnesota (Gran et al., 2013). However, each of those events was inferred from geological and topographic evidence, not observed from the onset of the event. Other instances of major waterfall collapse have also been reported (e.g., Do et al., 2022), but none to our knowledge that suddenly forced a river channel to evolve toward equilibrium grade due to loss of a knickpoint at the scale occurring on the Río Coca.
The patterns of geomorphic change upstream and downstream of the former Cascada San Rafael are generally consistent with those expected after a sharp reduction in base level. Regressive erosion is migrating up the mainstem and tributary channels in response to high shear stress on the riverbed above a retreating knickpoint, accompanied by valley-wall retreat. The Río Coca therefore exhibits the complex response to base-level fall that Schumm (1973) envisioned, that physical models have shown (Baynes et al., 2022; Hasbargen & Paola, 2000), and that have been inferred to be occurring over thousands of years based on modern topography (Gran et al., 2013). Schumm's complex-response model predicted that sediment yield following stream “rejuvenation” will not progress as a simple function of rainfall or specific flows but will evolve episodically. Bank and valley-wall collapse add pulses of material and channel flows erode stored alluvium as the channel accesses new sediment sources, such that “the behavior of the basin itself introduces a new degree of complexity into the geomorphic processes” (Schumm, 1977). These erosional processes are all evident on the Río Coca (Figures 5, 7, 10, 11; Gibson et al., 2023), illustrating the non-monotonic evolution of sediment yield due to crossing of thresholds—namely, the critical shear stress needed to erode materials at the headcut location (Figures 5, 14, 15) and failure criteria for riverbanks and valley walls. The observed patterns of erosion and deposition follow spatial and temporal patterns consistent with the classic “Lane balance” in which the dynamic, relative proportions of sediment supply and flow (transport capacity) determine channel grade and bed-elevation changes (Dust & Wohl, 2012; Lane, 1955). For example, the temporal transition at rkm 18–20 from initial degradation to re-aggradation after mid-2020 (Figure 7) reflected the shift to a sediment-supply-rich system as eroded material from upstream reached this part of the river corridor; by September 2021 that same area was degrading once again.
The sediment pulse generated by massive erosion upstream of the Cascada San Rafael site is depositing downstream, temporarily changing the river from single-thread, pool-and-riffle morphology to a multi-thread channel as flow divides around newly formed bars. This geomorphic shift was apparent in the first two years after knickpoint failure, as in the braided conditions shown in Figure 12c, but is only locally evident as of 2023 (e.g., Figure 13). The destabilization of pool-riffle morphology is consistent with field and laboratory studies of streams with greatly increased sediment supply (Recking et al., 2012), and further promotes bedload transport, including of large particles (Recking, 2012). The observed conditions of recent valley-wide deposition on a braidplain represent the initial phase of strath terrace formation (Finnegan & Balco, 2013). Sediment sources downstream of the base-level change also affect the river evolution, including mass wasting inferred to be a result of valley-wall-to-valley-wall deposition (Figures 12b, 13). This style of marginal mass wasting, resulting from aggradational-style avulsion (Mohrig et al., 2000), develops when a sufficiently large quantity of sediment deposition allows dynamic channels to migrate into the valley walls.
5.2 Comparison with anthropogenic dam removals
The fluvial responses upstream and downstream of the former lava dam are analogous to those that follow intentional dam removals but with key differences in sediment composition and accommodation space. Base-level lowering drives river response in anthropogenic dam removals, as on the Río Coca, causing regressive erosion through a reservoir deposit (Collins et al., 2017; Major et al., 2012; Randle et al., 2015; Wilcox et al., 2014; Wildman & MacBroom, 2005). However, the sedimentary deposits upstream of the Cascada San Rafael lava dam were more complex, compositionally and stratigraphically, than those of anthropogenic reservoirs. Reservoirs impounded by human-built dams for decades to centuries typically accumulate sediment with a “Gilbert delta” form, grading from top set to foreset to bottom set strata with grain sizes that fine downstream. Although depositional patterns in reservoir deltas reflect fluctuations in river discharge and lake level, they comprise fairly well-understood stratigraphic units usually accumulating in a quiescent setting (Snyder et al., 2006; Stratton & Grant, 2019). The Cascada San Rafael provided grade control over much longer time scales (104 years), spanning a complex history of sediment accumulation: not only fluvio-lacustrine deposits of sediment from upstream but also coarse, poorly sorted volcanic avalanche and breccia material delivered laterally by mass wasting from the flanks of El Reventador volcano. Additional material from landslides presumably also entered the steep-walled river corridor over centuries to millennia while the lava dam existed. Prior to knickpoint failure, the Río Coca upstream was an alluvial river rather than a lake or reservoir (the accommodation space impounded by the Cascada San Rafael was full), and so the river had been reworking exposed sediment. This long, complex history of sediment accumulation and alluvial reworking upstream of the Cascada San Rafael resulted in source materials more difficult to characterize, and erosion progression that is more difficult to predict, than would occur with anthropogenic reservoir deposits.
The extent of valley-wall retreat and mass wasting since 2020 also greatly exceeds any landscape response after even the largest anthropogenic dam removals (Randle et al., 2015; Wilcox et al., 2014). Because the eroding valley walls consist of avalanche, breccia and lacustrine material with some cohesion (Figures 14, 15), the lower erodibility of those units compared to non-indurated modern reservoir sediment lengthens the time scale over which the Río Coca sediment pulse will persist and somewhat limits the analogy with intentional dam removals.
Comparison with dam removals can inform understanding of the downstream response of the Río Coca and the evolution of its sediment pulse. Morphology in the alluvial reaches downstream from the former Cascada San Rafael resembles the riverbed downstream from dam-removal sites on the Elwha River, Washington (USA), after the world's largest intentional dam removal (two dams, 64 m and 32 m high), although the sediment mass released on the Elwha River was less than 5% of that on the Río Coca (20 Mt in the first five years after dam removal; Ritchie et al., 2018). In both cases, the sediment pulse caused aggradation in the downstream river corridor that led to wide, multi-thread, locally poorly channelized flow paths separated by numerous new sediment bars (cf. East et al., 2015, 2018). However, whereas the morphology of the Elwha River was influenced by large wood accumulations after dam removal (East et al., 2018), we have not observed large wood deposits affecting the Río Coca's evolution.
Similar to the unvegetated sand and gravel deposits that span the entire width of the Río Coca corridor along rkm 19–46, the flow along the aggraded Elwha River spread into former floodplain areas even at non-flood discharge, reflecting the transition from a sediment-supply-limited to a transport-limited state at peak sediment-pulse conditions (East et al., 2018). As mentioned above, the morphology of the Río Coca from rkm 20.39 to 46 comprised wide, shallow, locally poorly channelized flow as of early 2023 (Figures 12, 13). Transport-limited reaches of gravel-bed rivers exhibit finer grain sizes in surface exposures than supply-limited reaches because the surficial sediment has not yet been winnowed to develop a gravel armour layer (cf. East et al., 2018). Extensive exposures of sand and fine gravel were apparent in our limited, qualitative observations of the Río Coca downstream from the former lava dam and we did not see major boulder concentrations or well-developed rapids there in February 2023, although such features were present in the upstream reach then.
5.3 Comparison with other volcaniclastic sediment pulses
The transport-limited conditions on the Río Coca downstream of the former lava dam are also similar to those observed in newly aggraded stream channels processing sediment pulses after volcanic eruptions (Figure 12d, inset photo), where sand and gravel move as bedload through wide, shallow, braided channels (Gran & Montgomery, 2005; Major et al., 2016; Montgomery et al., 1999; Ulloa et al., 2016). Similar to our finding that more than 80% of the Río Coca erosion results from lateral channel adjustment and valley-wall failure, lateral sources also contribute large amounts of fluvial sediment supply for decades after volcanic eruptions (Gran et al., 2011; Major et al., 2018).
Sediment yield from the Río Coca after lava-dam failure is comparable to that of a moderate-sized volcanic eruption (Figure 16; Pierson & Major, 2014), given our calculation that the mobilized sediment mass was ~250 Mt in the first year after knickpoint failure and 500 Mt over three years. If we consider that mass to be generated by the upper watershed, above the lava-dam site (i.e., from a drainage area of 3,700 km2), that equates to ~70,000 t/km2 and ~130,000 t/km2 after one and three years, respectively (Figure 16). If we consider that 500 Mt of sediment has been produced from an actual erosion area just smaller than 3 km2 (Figure 7), the one- and three-year sediment yields become 83.3 million and 167 million t/km2. The Río Coca is not a direct analogue to basins with recent volcanic eruptions (coloured points on the Pierson and Major plot; Figure 16). However, it is useful to recognize that its sediment export after three years has a comparable volume to the fluvial sediment transported 35 years after the Mount St. Helens eruption of 1980 (250 million m3; Major et al., 2019), and is about a third of the amount transported by the Pasig-Potrero and Sacobia Rivers in the 18 years after the 1991 Mount Pinatubo eruption in the Philippines (750 million m3; Gran et al., 2011).
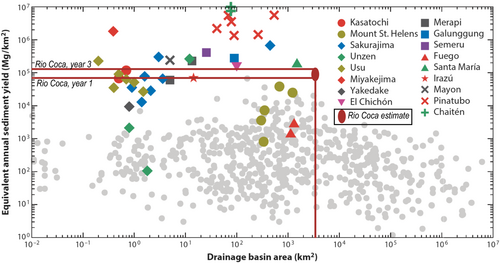
The Río Coca estimate is not directly comparable with the other sediment yields in Figure 16 because most of the Pierson & Major (2014) data were derived from suspended-sediment measurements and the Río Coca sediment pulse presumably has a large bedload component (Río Coca sediment fluxes have not been measured directly). However, placing the Río Coca into the context of these volcanic sediment pulses indicates that this is one of the largest sediment pulses of recent times, and this, together with the erodibility and erosion-regime data presented in Figures 14 and 15, will provide guidance for anticipating and modelling future fluvial evolution there.
5.4 Comparison with sediment loads of large rivers
To provide further context for the Río Coca sediment pulse, its total mass is comparable to the annual sediment load of large continent-draining rivers and its sediment yield is orders of magnitude higher. The ~500 Mt of sediment eroded from the Río Coca since February 2020 is 25% greater than the annual sediment load of the Mississippi River (400 Mt/yr) and is about 42% of the annual load of the Amazon River (1,200 Mt/yr; Milliman & Farnsworth, 2011). Because much of the Río Coca sediment pulse is presumably transported as bedload, we surmise that little or none of it has actually reached the mouth of the Amazon River. The Río Coca sediment pulse is comparable to the annual sediment loads of the Brahmaputra River (540 Mt) and Changjiang River (470 Mt) and much larger than that of the Orinoco River (210 Mt), which also drains the Andes (Milliman & Farnsworth, 2011). The total (three-year) sediment yield of 105 t/km2 from the Rio Coca far exceeds the annual yields from any of those river basins, which range from 120 t/km2/yr (Mississippi River) to 810 t/km2/yr (Brahmaputra River) (Milliman & Farnsworth, 2011).
5.5 Future evolution of the Río Coca
If the longitudinal profile of the Río Coca continues to evolve toward equilibrium grade (Figures 1b, 7), incision is expected to proceed another ~28 km upstream from where the headcut was in early 2023 (rkm 7.7), at decreasing magnitude, to upstream of the confluence of the Río Quijos and Río Salado (Figure 1b). Regressive erosion to equilibrium grade will lead to substantial additional erosion of the tributary and mainstem valley walls. Based on the geometry of the river profile upstream of the current knickpoint location at rkm 7.7 (Figure 1b), and assuming the ratio of erosion from the channel vs. banks and valley walls remains similar to what we obtained from our HEC-RAS modelling (82% from lateral erosion), then evolution of the profile to equilibrium grade would erode another ~73 Mt from upstream of rkm 7.7. Additional material will continue to erode from between rkm 7.7 and 21, increasing the overall sediment pulse by, we speculate, potentially another 100 to 200 Mt. Results of this study, particularly the new erodibility data, will be used to continue tracking the erosion and to support morphological modelling of future conditions (cf. Barrera Crespo, 2023a, 2023b).
Although the Río Coca morphology is consistent with transport-limited conditions below rkm 23, the sediment pulse is apparently waning in the upper part of the downstream reach. The single, narrow channel around rkm 19–20 (Figure 12d) indicates that this area is returning to more supply-limited conditions at least temporarily, incising and degrading the new riverbed after the sediment-pulse peak. We expect the incision of this new strath terrace to continue and perhaps accelerate over years to decades. The Río Coca sediment pulse will evolve irregularly for many years, though, as waves of sediment arrive after new mass-wasting events or erosion into new tributaries. Future sediment-pulse evolution will depend on flow sequencing (high-flow magnitude and duration), with high, bedload-transporting flows more likely during the wetter season (Figure 5), and also on substrate erodibility (Figures 5, 14, 15). Ultimately the sediment pulse will continue to progress downstream into the 80-km-long, lower-gradient anastomosing reach that begins around rkm 76 (downstream of the study region), where substantial deposition is likely. Sand and finer material are expected to reach the Río Napo confluence (approximately rkm 160), whereas the river may not have sufficient capacity (stream power) to transport a coarser bedload through the anastomosing reach.
We surmise that different grain sizes within the sediment pulse will move downstream at different rates, with fine sediment translating as suspended or wash load and coarser bedload (gravel and some of the sand) dispersing (Castro-Bolinaga et al., 2020; Cui et al., 2003; Lisle et al., 2001), although sediment-transport data are not currently available to measure this differentiation. As the Río Coca has a natural grade close to 0.01 between rkm 20.39 and 65, we infer that the wash load would include some sand-sized material. The Río Coca sediment supply is so large and presumably will continue for many years, with nonlinear changes in the supply of material from banks and valley walls, that even with direct transport measurements it might not be possible to distinguish between translating and dispersing components.
In trying to anticipate the decadal- to century-scale evolution of the Río Coca we can also look to literature examples, although with some caveats. Fluvial responses to sediment pulses on the order of 107 to 108 m3 vary with sediment load and grain size, valley topography, channel slope and hydrology (Gran & Montgomery, 2005; Lisle et al., 2018; Major et al., 2019; Pierson et al., 2011; Pierson & Major, 2014), and no well-studied examples share enough of these characteristics with the Río Coca to support a detailed comparison. Additionally, cohesion in the Río Coca substrates (Figure 14) is slowing the rate of sediment mobilization relative to some analogues in the literature (e.g., those involving newly erupted volcaniclastic materials). Predicting the rate of sediment export as a function of base-level fall and knickpoint migration is difficult (Gran et al., 2013), even under relatively controlled experimental conditions (Hasbargen & Paola, 2000).
Some comparisons are possible using sediment load and channel slope, and these suggest that the Río Coca could export its sediment pulse relatively efficiently. For example, within only four years after the volcanic eruption of Chaitén, Chile, in 2008–2009, rivers with slopes mostly steeper than 0.004 exported as much as 70 million m3 of volcaniclastic sediment and bed elevations had largely returned to pre-eruption levels (Major et al., 2016). The Mount Pinatubo sediment pulse (much larger than that of the Río Coca, currently) initially aggraded the Pasig-Potrero River by 200 m locally (20–40 m broadly) and increased the basin sediment yield by orders of magnitude. Its signal decayed substantially, with channels incising and the bed stabilizing seasonally, within 10 years after the 1991 eruption, although the Pasig-Potrero River has a gradient of 0.01 to 0.04, steeper than the 0.009 for the Río Coca study reach (Gran et al., 2011; Gran & Montgomery, 2005; Pierson & Major, 2014). In contrast, the less steep Sandy River, Oregon, which has a gradient of 0.002, took 40–90 years to export a substantial proportion of a 107-m3 volcaniclastic sediment pulse after an eruption of Mount Hood (Pierson et al., 2011). The bed of the Sandy River remains elevated by 3 m more than 200 years later (Pierson et al., 2011).
These examples suggest that the Río Coca disturbance signal could wane substantially within a decade. However, sediment deposition upstream of the bedrock slot canyon at rkm 43 will inhibit downstream transport of the coarse material and, as mentioned above, coarse sediment that does pass the slot canyon may not pass through the 80-km-long anastomosing section downstream of our study reach (gradient ~0.003). Both of those reaches disrupt connectivity by storing sediment within the drainage network, an important factor controlling the rate of sediment export and landscape recovery after disturbance (Fryirs, 2013; Lane et al., 2017; Wohl et al., 2019). The Río Coca sediment supply depends mostly on rates of valley-wall erosion, which will release sediment to the river more slowly than did erosion of unconsolidated volcanic deposits at Mount Pinatubo, Chaitén and Mount St. Helens, prolonging the timescale of landscape disturbance. As with volcanic eruptions, much of the new sediment on the Río Coca probably will remain in the river corridor long-term even though rates of geomorphic adjustment will decrease and bed configuration will gradually stabilize.
5.6 Natural-hazard implications
The regressive erosion and sediment mobilization since the loss of the Cascada San Rafael knickpoint have created acute and long-term hazards for the Río Coca valley. This event is unequivocally a natural disaster, with widespread consequences. Expansion of the new canyon along rkm 8–20 has removed 287 ha of land (Figure 10), destroying more than 10 buildings and a bridge that crossed the river at rkm 12 (Figure 8). Erosion into the Piedra Fina 2 and Marker tributary basins that join the Río Coca around rkm 14 and rkm 16, respectively, destroyed two more bridges and made impassable the only road (the E45 road) connecting this rural region to urban areas farther west. Since late 2022 the only means to cross the eroded road section has been by a small passenger cable car. To drive to the capital city of Quito from the downstream side of the main road collapse now requires a 10-hour detour to the north, hindering residents' access to medical facilities, job sites and other resources. Erosion also destroyed four pipelines that carry oil from the Amazon basin to refineries on the coast of Ecuador. The oil pipelines as well as drinking-water pipes had to be rerouted over much higher bedrock slopes to the west of the river corridor. The instability of the rapidly eroding valley walls creates a substantial risk to mitigation efforts and personal safety. A landslide at the north end of the cable-car crossing at the breach in the E45 road caused a fatality in February 2023. Recent mainstem erosion in the Río Coca between rkm 9 and 9.50 has exacerbated headcuts on the Río Loco and Río Malo tributaries that are threatening bridges and construction access for the potential mitigation responses. Water-quality impairment from high turbidity and flooding attributed to recent bed aggradation have been reported from the city of Coca, 90 km downstream of our study reach (approximately rkm 155).
Riverbed incision is expected to threaten the Coca Codo Sinclair dam and diversion intake at rkm 0 within the next few years. The dam and the diversion outlet at rkm 63.5, where hydropower is generated, began operating in 2016 and constitute Ecuador's largest hydropower facility, designed to produce 1,500 MW of electricity. Currently operated to generate around 1,100 MW, the Coca Codo Sinclair (CCS) hydropower project produces one-quarter of the electricity used in the country. The CCS diversion is not designed to withstand the additional 30–40 m of incision expected at rkm 0 as the longitudinal profile continues to downcut toward equilibrium grade. Operation of the diversion outlet at rkm 63.5 will become compromised with 2 m or more of bed aggradation and would have to cease if aggradation reaches 6 m there. New deposition at the outlet has been managed successfully thus far by dredging sand, but long-term strategies are necessary to anticipate and manage the large bedload pulse working its way downstream. Mitigating these threats to critical infrastructure is a high priority for the government of Ecuador, and efforts are ongoing to model future sediment transport and geomorphic evolution (Barrera Crespo, 2023a, 2023b) in combination with geotechnical investigations (this study) to support the re-engineering of these facilities.
5.7 Implications for interpreting transient landscapes and the stratigraphic record
The situation unfolding on the Río Coca provides ample opportunity for additional future studies. In addition to further data collection and modelling to inform engineering decisions, the unusual events on the Río Coca could support new investigations into transient landscape evolution. Observations of these rapid changes in real time could lead to new understanding of river incision and the thresholds that control it, the role of extreme events, and interactions among base level and sediment supply in shaping fluvial morphology (Gasparini et al., 2006; Whipple, 2004), how transport- vs. detachment-limited state shifts as the river flow changes and different substrates are accessed (Whipple & Tucker, 2002), and what modelling approach could best represent evolution of the river profile (Gran et al., 2013).
Geologists are taught that the present is the key to the past, and so learn to interpret the geologic record in light of landscape processes witnessed in modern times. The sudden failure of a major fluvial grade control on the scale occurring on the Río Coca is exceedingly rare. This process and the subsequent resetting of a landscape expand the palette of contemporary geomorphic processes with which we can interpret events in the distant past. Commonly studied landscape disturbances that deliver large amounts of sediment to rivers include human land use (e.g., Madej & Ozaki, 1996; Tarolli & Sofia, 2016), earthquakes (Francis et al., 2022; Hovius et al., 2011), extreme storms (Collins et al., 2020) and, as already discussed, dam removal and volcanic eruptions. We are not aware of any previous examples in the literature of a similarly large fluvial sediment pulse caused by sudden base-level drop through an entirely autogenic process. The Río Coca event therefore has important implications for understanding the sedimentary record. Sedimentologists interpreting stratigraphy in lacustrine or marine cores offshore of volcanic terrain would likely interpret a thick ‘event’ deposit as representing some tectonic or climatic disturbance, i.e., a major earthquake (Hill et al., 2022) or storm rainfall and flooding associated with a strong El Niño episode (Covault et al., 2010). Even if enough sediment cores were available to reveal that the deposit was spatially localized rather than extending along a continental margin (as expected from a megathrust earthquake or climatic disturbance), it would seem reasonable to attribute a thick volcaniclastic deposit to a large volcanic eruption (Kataoka & Nagahashi, 2019; Manville et al., 2009). It is unlikely that scientists interpreting the downstream sedimentary record would arrive at the interpretation of a rare, autogenic, stochastic watershed process involving a collapse of grade control and major regressive erosion. Therefore, the most significant lesson from the Río Coca disaster may be that it can happen at all.
6 CONCLUSIONS
The failure of a 144-m-high lava dam on the Río Coca, Ecuador, in February 2020 initiated a catastrophic watershed reset upstream and downstream. This sudden failure of fluvial grade control, and the regressive erosion that followed, are processes familiar to geomorphologists but that have not been observed previously at this field scale during the historical era. Over the first three years after knickpoint failure the erosion front migrated almost 13 km upstream, at rates controlled by variable resistance of underlying substrates and the sequence of flows. Erosion of the mainstem and tributary valleys upstream of the lava dam generated a sediment pulse estimated to be ~500 Mt over three years—one of the largest in modern times—which deposited sediment up to tens of meters thick over tens of kilometres downstream from the former waterfall site. In contrast to the deeply incised canyon opening upstream of the failed knickpoint, the river morphology downstream transitioned to shallow flow in wide, multi-thread channels, resembling the response of other rivers experiencing transport-limited conditions caused by sediment pulses from volcanic eruptions or dam removals. The riverbed at the upstream end of the aggraded reach is beginning to incise and to form a more channelized flow path, but the Río Coca will likely require a decade or more to export most of the sediment pulse. Additional supply from erosion and the presence of sediment-storing reaches in the downstream river corridor will slow the recovery time. Geomorphic adjustment of the Río Coca represents a highly unusual natural disaster threatening life, property, major infrastructure and energy security as it compromises oil pipelines and Ecuador's largest hydroelectric facility. However, this rare event creates valuable opportunities to learn how a large autogenic watershed disturbance and recovery evolve, with important lessons for understanding geomorphic transience and the sedimentary record of volcanic landscapes.
ACKNOWLEDGEMENTS
The authors express their gratitude to CELEC EP and the entire staff of the CELEC-Río Coca Executive Commission (CERC) for their valuable collaboration throughout this study's development. A special acknowledgment is extended to CERC Director Roque Proaño for closely overseeing the research's progress and offering crucial information. The authors also thank Calvin Creech and Adriel McConnell, U.S. Army Corps of Engineers, for U.S.-based project initiation and leadership, and Chris Nygaard, Tim Randle, Dan Levish, Chris Haring, Dana Moses, Todd Loar, Jeremy Sharp, David May, Gabrielle Lyvers, Molly Wood, Steven Slaughter, Faith Fitzpatrick, and Darcy Gaechter for insights into geologic and geomorphic processes on the Río Coca. Chris Dunn and Kristy Riley provided comments that improved the manuscript. The in-situ jet erosion tests were funded through U.S. Government Interagency agreement No. CESAM-USDA-CCS-22-01 between USACE and USDA, ARS. Dr. Martin Locke and Mr. Michael Ursic (USDA, ARS, National Sedimentation Laboratory) are thanked for their assistance in conducting the jet erosion tests. The paper was improved through peer reviews by Jon Major and two anonymous reviewers. The authors have no conflicts of interest to declare. The findings of this paper do not necessarily reflect the official position of the U.S. Army Corps of Engineers. Any use of trade, firm, or product names is for descriptive purposes only, and does not imply endorsement by the U.S. Government.
Open Research
DATA AVAILABILITY STATEMENT
Digital topographic data are not permitted to be released publicly due to their association with critical energy infrastructure. Geotechnical data are in the process of being archived in a public data repository through the U.S. Department of Agriculture.


