Geomorphological evolution of a debris-covered glacier surface
Abstract
There exists a need to advance our understanding of debris-covered glacier surfaces over relatively short timescales due to rapid, climatically induced areal expansion of debris cover at the global scale, and the impact debris has on mass balance. We applied unpiloted aerial vehicle structure-from-motion (UAV-SfM) and digital elevation model (DEM) differencing with debris thickness and debris stability modelling to unravel the evolution of a 0.15 km2 region of the debris-covered Miage Glacier, Italy, between June 2015 and July 2018. DEM differencing revealed widespread surface lowering (mean 4.1 ± 1.0 m a-1; maximum 13.3 m a-1). We combined elevation change data with local meteorological data and a sub-debris melt model, and used these relationships to produce high resolution, spatially distributed maps of debris thickness. These maps were differenced to explore patterns and mechanisms of debris redistribution. Median debris thicknesses ranged from 0.12 to 0.17 m and were spatially variable. We observed localized debris thinning across ice cliff faces, except those which were decaying, where debris thickened. We observed pervasive debris thinning across larger, backwasting slopes, including those bordered by supraglacial streams, as well as ingestion of debris by a newly exposed englacial conduit. Debris stability mapping showed that 18.2–26.4% of the survey area was theoretically subject to debris remobilization. By linking changes in stability to changes in debris thickness, we observed that slopes that remain stable, stabilize, or remain unstable between periods almost exclusively show net debris thickening (mean 0.07 m a-1) whilst those which become newly unstable exhibit both debris thinning and thickening. We observe a systematic downslope increase in the rate at which debris cover thickens which can be described as a function of the topographic position index and slope gradient. Our data provide quantifiable insights into mechanisms of debris remobilization on glacier surfaces over sub-decadal timescales, and open avenues for future research to explore glacier-scale spatiotemporal patterns of debris remobilization. © 2020 The Authors. Earth Surface Processes and Landforms published by John Wiley & Sons Ltd
Introduction
Debris-covered glaciers are common features of glacierized regions and are characterized by a mantle of surface debris in their ablation zones. Surface debris exerts important controls on glacial ablation and mass balance through its capacity to insulate ice from fluctuations in air temperature where debris cover is continuous, and enhancing ablation where cover is thin and discontinuous (Østrem, 1959; Nakawo et al., 1999; Takeuchi et al., 2000; Benn et al., 2003). The role of supraglacial debris cover has received renewed attention from the geosciences community in the last decade or so, not least because of the increasing areal coverage of supraglacial debris cover in many glacierized regions in response to climatically influenced glacier recession (e.g. Kirkbride, 2000; Kirkbride and Deline, 2013; Scherler et al., 2018) and the capacity of expanding debris cover to modify glacier mass balance and modulate meltwater production (e.g. Stokes et al., 2007; Bolch et al., 2008; Kellerer-Pirklbauer, 2008; Quincey and Glasser, 2009; Shukla et al., 2009; Glasser et al., 2016; Mölg et al., 2019).
Debris from subaerial sources is supplied from glacier-adjacent slopes and sediment is also produced via bedrock erosion in the subglacial zone (Boulton, 1978; Iverson, 1995; Kirkbride, 1995). Large (> 106 m3) infrequent rock avalanches and landslides (e.g. Evans and Clague, 1988; Huggel et al., 2005; Deline and Kirkbride, 2009; Uhlmann et al., 2013; Deline et al., 2014, 2015) and the failure of lateral moraines (Nakawo et al., 1986; van Woerkom et al., 2019) can also transport debris to a glacier surface. Debris which falls onto glacier surfaces in the accumulation zone is buried by seasonal snow over successive years or enters open crevasses which act as a conduit for debris ingestion. Englacial flow paths in the ablation zone of valley glaciers are typically positive (or ‘upward’) in the vertical dimension due to the downglacier reduction in flow velocity, which leads to a negative flux divergence (Raymond, 1971; Cogley et al., 2011); a phenomena often termed ‘emergence’. Following ingestion in the accumulation zone, where flux divergences are typically positive, debris is thereafter transported englacially, where it can remain, or is elevated to the supraglacial zone via thrusting along debris septa (Anderson, 2000; Benn and Owen, 2002; Hubbard et al., 2004) and other uplift mechanisms, such as folding (e.g. Moore et al., 2013).
‘Primary dispersal’ relates to the mechanism by which debris is spread across a melting ice surface as the result of its emergence from migrating outcrops of septa (Kirkbride and Deline, 2013). Debris may emerge from such septa where adjacent glacier flow units converge and elevate sediment to the supraglacial zone to form medial moraines (e.g. Small and Clark, 1974; Eyles and Rogerson, 1978; Anderson, 2000; Mölg et al., 2020), and from numerous discontinuous debris bands associated with rockfall delivery to the glacier surface in the accumulation zone. Debris may also emerge from flow-transverse debris septa hypothesized to form as the result of the elevation of subglacial sediment or crevasse-fill (Kirkbride and Deline, 2013). However, the most likely origin for much of the emerging debris is via passive melt-out of englacial, foliation-parallel debris septums, rather than thrusting. For glaciers with a negative mass balance, an imbalance exists between rates of debris supply to the glacier and the glacier's ability to evacuate this debris at its margins (Kirkbride, 2000). In turn, a debris cover may develop and expand. Ice ablation is retarded once the debris reaches a critical thickness (Østrem, 1959; Mattson et al., 1993; Kayastha et al., 2000; Kirkbride and Dugmore, 2003; Nicholson and Benn, 2013), triggering an increase in relief relative to adjacent debris-free surfaces. Thereafter, gravity-driven secondary dispersal mechanisms redistribute debris across the glacier surface to form a continuous debris mantle.
The advection of supraglacial debris is classically regarded as a ‘passive’ form of glacial sediment transport, in so far as it relates to the evolution of clast morphologies (Boulton, 1978). However, this classification masks the geomorphological dynamism of debris-covered glacier surfaces, which, topographically and sedimentologically, are continuously evolving due to the interplay of ablative (e.g. Immerzeel et al., 2014; Buri et al., 2016; Miles et al., 2018), mass movement (Benn and Owen, 2002; Moore, 2018), and weathering processes (Owen et al., 2003), as well as ice flow and dynamics (e.g. Kraaijenbrink et al., 2016; Mölg et al., 2019). Key processes in the glacial debris transport cycle remain poorly understood, including the quantification of historical, contemporary and future rates of catchment debris supply (e.g. Heimsath and McGlynn, 2008; Scherler, 2014; Banerjee and Wani, 2018), precise supraglacial and englacial debris transport pathways and fluxes (e.g. Kirkbride and Deline, 2013), and the extent and significance of primary dispersal and secondary debris remobilization on glacier surfaces and bounding moraines (e.g. van Woerkom et al., 2019) for dictating spatial patterns of debris cover thickness, which in turn control sub-debris ablation rates.
The various gravitational, often meltwater-aided, processes which redistribute debris locally across glacier surfaces (so-called ‘secondary dispersal’) have been observed (e.g. Thompson et al., 2016) and quantified (Moore, 2018; Nicholson et al., 2018) to a limited degree. Ice cliff backwasting, including cliffs at the margins of supraglacial streams, would appear, at least qualitatively, to be an efficient mechanism of debris remobilization and redistribution, as debris cover at the cliff line is progressively destabilized and cascades down bare-ice faces to be deposited at its base or in an ice-contact melt pond, a process which is mentioned incidentally in the glaciological literature (e.g. Benn et al., 2012; Brun et al., 2016; Buri et al., 2016; Miles et al., 2016; Mölg et al., 2019). Thompson et al. (2016) found that patterns of surface evolution on Ngozumpa Glacier, Nepal, were consistent with the redistribution of surface debris, including the infilling of topographic lows and debris accumulation at the base of retreating, non-calving ice cliffs, where rates of mass wasting outpace rates of debris exhumation and accumulation (Herreid and Pellicciotti, 2018). Similarly, Mölg et al. (2020) analysed the surface evolution of debris-covered Zmuttgletscher, Switzerland, and found that it is possible for high relief topography, characterized by incised supraglacial streams, local depressions, ice cliff complexes, and a heterogeneous debris distribution to develop from a relatively smooth glacier surface over the course of two decades, and which was driven initially by meltwater incision. Recently, Moore (2018) presented a theoretical framework for deriving spatially distributed maps of debris transport mode on glacier surfaces, based on slope stability and meltwater balance analysis, and which we utilize later in this article.
Quantifying the spatiotemporal evolution of supraglacial topography and patterns and mechanisms of debris redistribution remains a challenge. We are steadily moving toward a paradigm whereby distributed energy balance and glacier evolution models, which can be used to predict the response of debris-covered glaciers to climatic change, will be improved to the point where discrete debris transport processes, including surface debris redistribution, can be simulated (e.g. Rowan et al., 2015; Anderson and Anderson, 2016; Wirbel et al., 2018). There is thus a need to further develop empirical understanding of these processes at the site scale, so that these observations might, in time, be used by the modelling community. This article explores patterns of secondary debris remobilization across a 0.15 km2 sub-region of the debris-covered Miage Glacier, Italy, over a three-year observation period, and sets these patterns in the wider context of the geomorphological evolution of supraglacial topography.
Study Site
Miage Glacier has an area of approximately 11.5 km2 (Brock et al., 2010; Shaw et al., 2016) and is located on the southwest flank of the Mont Blanc massif, Italy (Figure 1). The glacier possesses a continuous debris mantle across the lowermost ~4.5 km2 of the ablation zone (Shaw et al., 2016). Debris sourced from rock fall and rock avalanching accounts for > 75% of the debris load, and at least three rock avalanches > 0.1 × 10⁶ m3 have delivered debris directly to the supraglacial zone in the twentieth century (Deline, 2009). Medial moraines which originate below tributary confluences have been identified on the glacier from cartographic maps dating to the late eighteenth century (de Saussure, 1774), and successive decades saw the up-glacier expansion of a continuous debris cover.
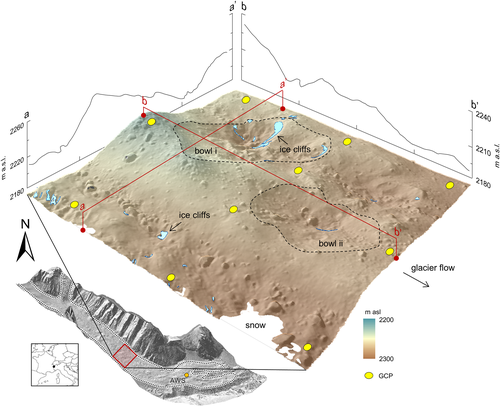
The present-day debris-covered area extends from ~1770 m above sea level ( a.s.l.) to ~2400 m a.s.l. (Deline, 2005). Debris thicknesses commonly exceed 0.5 m at the glacier terminus (Diolaiuti et al., 2005; Brock et al., 2010) and debris thickness increases towards the terminus (Mihalcea et al., 2008). Supraglacial debris is composed predominantly of schists and granites and can be divided into flow-parallel (medial moraine origin) and irregular rock avalanche deposits whose areal outlines are independent of flow (Deline, 2009; Deline et al., 2014). High (~10°) surface gradients and flow velocities (> 20 m a-1) likely limit the growth of melt ponds in the ablation zone (cf. Reynolds, 2000; Quincey et al., 2007), although ice cliffs are common.
We focus on a ~0.15 km2 area located 3 km from the glacier terminus (Figure 1; centroid 45.790° E, 6.857° N) and selected this location primarily for its topographic complexity, which was deemed appropriate for investigating debris redistribution. The study area is characterized by marginal lateral troughs, bowl-shaped depressions (which can be > 20 m deep relative to adjacent topographic highs), and medial moraine ridges. The grain size distribution of supraglacial debris encompasses the full range of clast sizes and ranges from silt to large (> 10 m diameter) boulders. Field observations suggest that the surface armour layer of debris is dominated by cobble-sized (64–256 mm) material.
Methods
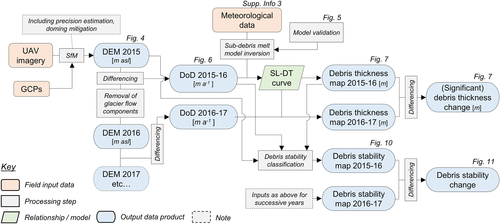
Our workflow is summarized in Figure 2. Briefly, our methods comprised: (i) low-altitude aerial photography of the survey area using a small unpiloted aerial vehicle (UAV); (ii) generation of digital elevation models (DEMs) using structure-from-motion with multi-view stereo (SfM-MVS) photogrammetry; (iii) the correction of these DEMs to remove three-dimensional (3D) glacier flow components; (iv) the generation of DEMs of difference (DoD) for surface change detection; (v) derivation of repeat, spatially distributed maps of debris thickness using numerical modelling and driven by DEM differencing and meteorological data; (vi) debris thickness differencing, incorporating uncertainty analysis, and (vii) debris stability modelling.
UAV survey design
Aerial photographs of the glacier surface were captured using a DJI Phantom 3 Professional UAV at 12.4 MP resolution, generating 4000 × 3000-pixel RGB (red–green–blue) images using a fixed focal length of 20 mm (35 mm equivalent) and automatic focusing and exposure settings. UAV surveys took place at the beginning of the ablation season in successive years from 2015 to 2018, comprising return intervals of 349, 356, and 372 days, respectively (Table 1). Flight plans comprised parallel flight lines flown manually at ~40 m above the glacier surface, each of which traversed the glacier perpendicular to glacier flow (i.e. cross-valley). UAV altitude remained constant for each cross-glacier transect; camera-feature distances therefore varied according to surface topographic amplitude for a given cross-glacier flight line. The maximum amplitude for an individual flight line was ~40 m. We progressively increased the drone's altitude in an up-glacier direction to compensate for glacier surface slope. Minimum forward and side overlaps were 80% and 50%, respectively. The mean ground sampling distance (GSD) was 1 pixel = 50 mm. We additionally acquired imagery from higher altitude flight lines (~70 m above ground level), where the GSD was ~1 pixel = 90 mm. Due to time constraints, we acquired predominantly nadir-oriented imagery and we discuss the photogrammetric implications of this in the next section.
| Survey date | Number of photographs | Number of ground control points | Residual transformation error (m; pixel) | Median point precision (mm) | ||||||
| Pre-optimization | Post-optimization | Maximum z deformation (m) | Full | Shape only | Relative precision | |||||
| 9 July 2015 | 1052 | 10 | 0.271 | 0.772 | 0.179 | 0.794 | 0.32 | 48.01 | 7.27 | 1:1060 |
| 22 June 2016 | 718 | 10 | 0.800 | 1.093 | 0.331 | 1.006 | 0.02 | 50.33 | 15.84 | 1:1800 |
| 13 June 2017 | 1623 | 10 | 0.703 | 1.414 | 0.299 | 1.368 | 0.62 | 48.19 | 9.70 | 1:969 |
| 20 June 2018 | 1569 | 16 | 0.358 | 0.407 | 0.296 | 0.069 | 0.02 | 6.38 | 5.94 | 1:4390 |
Ground control points (GCP) were distributed in a quasi-uniform configuration across the survey area prior to each survey (n = 10 for 2015 to 2017 and n = 16 for 2018; Figure 1). We additionally recorded the xyz location of 19 check points during the June 2016 survey. GCP and check point locations were recorded using total station in all years except 2018, when differential global positioning system (GPS) was used (accuracy in xyz ±0.12 m). Total station location and orientation was established using a differential GPS-assisted re-section, accurate to ±0.15 m. All data used for georeferencing were acquired in the UTM Zone 32 N coordinate system, and use the WGS84 datum.
SfM-MVS reconstruction
UAV photosets were imported into Agisoft PhotoScan Professional software (v. 1.2.6), where UAV GPS geotag data and bundle adjustment were used to generate an initial estimation of camera network geometry, followed by the manual removal of obviously erroneous points, automatic removal of tie points with a reprojection error > 1.0 pixels, and the removal of tie points which were retrieved from fewer than three photographs. After identifying GCPs in the aerial photographs we re-ran the bundle adjustment to improve camera pose estimation and model geometry, in line with recommendations made by James et al. (2017). GCP coordinate data were subsequently assigned to each GCP and were used for project georeferencing using a rigid-body transformation (Table 1).
We hypothesized the existence of surface doming due to the nadir orientation of the input SfM photosets, which can introduce systematic model distortion (e.g. Rosnell and Honkavaara, 2012). We employed methods proposed by James and Robson (2014) to identify and mitigate topographic distortion and expand on these methods in Supporting Information Data S1. Mean 3D point precision after the mitigation of surface doming was < 50 mm. Model georegistration errors were comparable between survey dates; mean xy error was 0.265 m, and mean z error was 0.173 m. Methods exist for accounting for spatially distributed variability in point precisions and georegistration errors in 3D surface differencing operations, but we do not consider this further given that the vertical surface change between our survey dates is around two-orders of magnitude greater than the mean compound precisional and georegistration error for any two DEM differencing pairs. We used check points to independently verify the accuracy of the surface heights of the June 2016 data after mitigating against model doming. We found the mean and median z accuracy (or bias) to be 0.036 m with a standard deviation (σSfM) of 0.232 m, and assume that this error is representative of the other 3D models. Finally, we generated dense point clouds and generated 2.5D raster DEMs at 1 m grid resolution using CloudCompare software (v. 2.9.1), where the cell elevation represents the mean elevation of the 3D points contained within each 1 m cell footprint.
Corrections for glacier flow
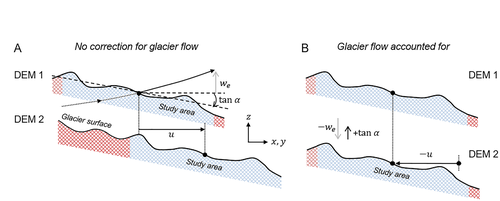
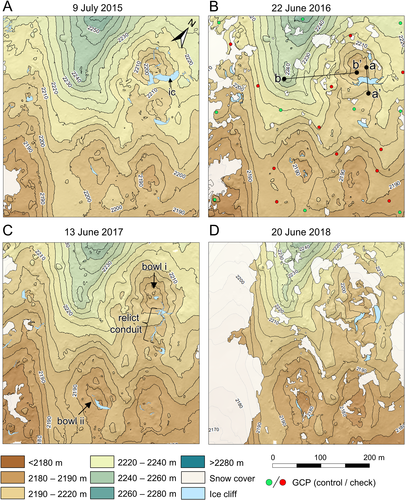
To arrive at a set of DEMs which can be differenced to yield vertical surface change on an actively flowing glacier it is necessary to isolate and account for the components of glacier flow and their uncertainties, namely horizontal surface movement, u, and vertical displacement due to valley slope, ɑ, and flux divergence, we (Figure 3). We modified a method proposed by Vincent et al. (2016) and Brun et al. (2018). In summary, we applied a horizontal displacement to account for xy downglacier surface translation between survey dates, applied a positive z shift to account for valley slope, and applied a negative z shift to account for flow emergence (Figure 3) to produce a series of flow-corrected DEMs (Figure 4) and associated uncertainties. We undertook 2.5D DEM differencing to produce DoDs for successive surveys and converted these to show annual change. We refer to these DoDs as ‘period 1’ (July 2015–June 2016), ‘period 2’ (June 2016–June 2017) and ‘period 3’ (June 2017–June 2018). These data represent surface change, which is the product of net ablation, englacial debris emergence and surface debris layer thickening, and surface debris redistribution, which can manifest as either debris thickening or thinning. We fully describe these methods in Supporting Information Data S2.
Distributed debris thickness mapping
We inverted a sub-debris melt model (Rounce et al., 2018) to develop high-resolution, spatially distributed maps of surface debris thickness. The approach utilizes a forward model of sub-debris melt (Rounce et al., 2015) and inverts this model such that debris thickness is adjusted so the modelled sub-debris ablation agrees with observed ablation. The energy balance model computes the latent heat flux by assuming the surface of the debris is saturated whenever it rains, otherwise the surface is assumed to be dry. Additionally, a modified version of Tarboten and Luce's (1996) snow accumulation and melt model has been added to the energy balance model to account for snow accumulation.
 (1)
(1) (2)
(2) :
:
 (3)
(3)This approach has methodological limitations that affect both their accuracy and our subsequent interpretation. Gridded debris thicknesses represent mean debris thickness for a given differencing period and are not therefore specific to a given date. Accordingly, we have the most confidence in our debris thickness estimates in areas where debris cover has remained relatively stable and experienced no significant debris redistribution during the differencing period. In contrast, debris instability within a differencing period complicates this signal such that debris thickness patterns represent the mean thickness in areas of corresponding mass loss and gain. For example, a cell located at a topographic low surrounded by steep topography could gain debris at any time during the survey period, but the model cannot account for this; hence, the debris thickness estimate is the mean debris thickness over that survey period. We analysed distributed debris thickness maps resampled to 5 m grid resolution to account for the residual error attributable to horizontal displacement of our DEMs, and restrict later data comparison to a common spatial extent, namely the snow-free area in June 2018 (Figure 4C).
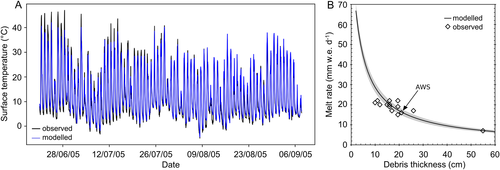
Debris thickness measurements on Miage Glacier (see figure 1 in Brock et al., 2010) are sparsely distributed across the glacier surface and only two are located within our study area. Due to field constraints and the fact that debris thickness varies considerably over short spatial scales (e.g. McCarthy et al., 2017; Nicholson et al., 2018), we were unable to collect a set of debris thickness measurements across our study site that were spatially representative. Thus, we chose to validate the performance of our debris thickness modelling through a comparison of observed sub-debris melt from various debris thicknesses using data from Reid and Brock (2010), which represents the most extensive ablation-debris thickness time series acquired on Miage Glacier, as well as a comparison with observed surface temperature data. We used Reid and Brock's (2010) meteorological data and ablation stake data from the lower on-glacier AWS (Figure 1) and our own uncertainty estimates for debris properties. The modelled sub-debris melt agrees well with the ablation stake data (Figure 5), thereby justifying the use of the energy balance model and method for estimating the debris thickness in this study. In line with Reid and Brock (2010) we stop short of providing a measure of goodness-of-fit between our model and the observed debris thickness-ablation data, since the latter were obtained from various positions on the glacier, and are thus subject to variations in altitude, aspect, and shadowing, which affect local-scale meteorological conditions.
Debris stability mapping
To map the susceptibility of supraglacial debris to instability, we applied a framework for assessing slope stability and gravitational mass transport in a debris-covered ice setting proposed by Moore (2018). Application of this framework enables the identification of areas of a glacier surface which are theoretically susceptible to one or more types of debris instability, namely: (i) simple oversteepening; (ii) meltwater saturation-excess of the debris layer, and (iii) destabilization by meltwater-induced reduction of the stable repose angle.
Model input comprises surface slope angle (in degrees) and upslope contributing area (in m2 m), which we retrieve from our SfM-DEMs, alongside estimates of h, b, and the friction coefficient, μ, for sliding along the debris-ice interface, and the saturated hydraulic conductivity, Ks, of the debris (in m d-1). In contrast to existing studies (Moore, 2018; Nicholson et al., 2018) we used our spatially distributed maps of h and b for input to debris stability modelling. Following Barrette and Timco (2008) and Moore (2018) we specified μ as 0.5, giving an effective friction angle of 26.6°, with the assumption that the static intergranular friction angle within the debris cover likely exceeds this value. Since we do not know Ks for Miage Glacier, we apply a uniform value of 40 m d-1 after Nicholson et al. (2018), which assumes that the debris is well-drained and which we corroborate with field observation. In reality, Ks of a debris layer is depth-dependent (e.g. Eyles and Rogerson, 1978) and is difficult to quantify in the field (Nicholson et al., 2018), and is thus associated with significant uncertainty. Where localized water pressures approach or exceed Ks due to ablation, or meltwater concentration, there exists the potential for triggering debris instability (Moore, 2018). As such, where our uniform value underestimates local Ks, we expect an overestimation in the spatial extent of our mapped debris instabilities, and vice versa. We carried out debris stability mapping in ArcGIS software and differenced successive debris stability maps to quantify the spatiotemporal evolution of these instabilities.
Results
Patterns of surface lowering
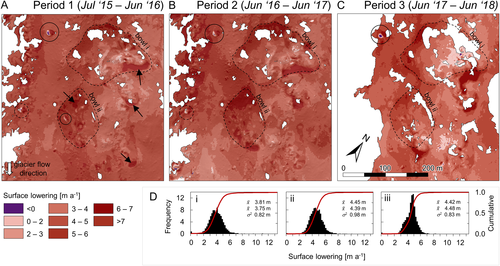
We adopt ‘surface lowering’ instead of ‘net ablation’ to describe our topographic change detection results since these data represent both sub-debris and bare-ice ablation, and debris redistribution signals. We observed widespread surface lowering across the entire study site in all differencing periods with rare (< 0.11% of survey area) surface gain outliers attributable to the downslope movement of large boulders (Figure 6A). The site-wide mean surface lowering ± one standard deviation (and 95th percentile) was 4.49 ± 0.84 m a-1 (5.8 m a-1), 4.57 ± 1.10 m a-1 (6.1 m a-1) and 3.81 ± 1.15 m a-1 (5.2 m a-1) for periods 1–3, respectively. Maximum surface lowering was 10.18 m a-1, 12.56 m a-1 and 13.58 m a-1, respectively; spatially, these coincide with enhanced ablation attributable to ice cliff backwasting (Immerzeel et al., 2014; Buri et al., 2016; Brun et al., 2018; Mölg et al., 2019). Surface lowering data were normally distributed around the mean in all years, with the data exhibiting moderate and high positive skewness (ɣ1) in period 2 and period 3 (ɣ1 = 0.73, and ɣ1 = 1.39, respectively), with no significant skew present in the period 1 data (Figure 6B).
 ,
,
 and σ2 are sample mean, median and standard deviation, respectively. Black circles in (A) show downslope movement of large boulders. The topographic depressions referred to as ‘bowl i’ and ‘bowl ii’ in the text are identified with dashes in (A). In (D) i–iii = periods 1–3. [Colour figure can be viewed at wileyonlinelibrary.com]
In all periods, the minimum recorded surface lowering occurs in the centre of a bowl-like depression in the north of the site and near the largest ice cliff complex (identified as bowl i in Figure 6A). Here, we find that slope processes actively deliver debris, including large (Ø > 2 m) boulders to the base of this depression, where it concentrates and further suppresses ablation relative to surrounding areas. We record high surface lowering (> 5 m a-1) at the western margin of the depression (centre-top, Figure 6A), a pattern which reflects the lateral expansion of the bowl via backwasting of its steep (> 30°) eastern- and southeastern-facing slopes and coincides with where the debris mantle is locally at its thinnest. Similarly, we observed high rates of surface lowering across the southeastern-facing slopes of bowl ii in periods 1 and 2 which diminishes into period 3.
In late spring and early summer, a supraglacial stream enters at the north-western sector of the site and flows to the southeast. Surface lowering can exceed 5 m a-1 in stream-adjacent areas between period 1 and period 2 (Figure 6A); the area was snow-covered in period 3 (2018). We attribute these rates and patterns to thermo-erosional migration of the channel over successive years and links to ice-cliff inception. Stream migration also has implications for debris stability, and in turn, debris thickness on adjacent slopes. We also observed enhanced mass loss in proximity to very large (Ø > 10 m) individual boulders and boulder clusters, which, due to their mass, can retain and emit large amounts of longwave radiation to their immediate surroundings, thereby locally increasing the ablation rate. Elsewhere, we observe slight spatial variations in annual surface lowering across our monitoring period which may be due to meso- and micro-scale effects, such as proximity to snow patches, which exert a local net cooling effect, and topographic shadowing, which varies between periods.
Ice cliffs accounted for 1.00%, 0.87%, 0.72% and 0.87% of the two-dimensional (2D) snow-free surface area from 2015 to 2018, respectively, and accounted for 1.98%, 1.90% and 1.24% of volumetric loss in successive differencing periods. Ice cliffs possessed a mean net ablation rate of 8.60, 10.93 and 8.65 m w.e. a-1 against non-ice cliff ablation rates of 4.33, 4.96 and 5.01 m w.e. a-1 for periods 1–3, respectively. We observed the full continuum of ice cliff evolution, including ice cliff inception, expansion, and decay. The largest ice cliff in the survey area (Figure 4A) attained a maximum crest length and height of 70 m and 10 m, respectively, (June 2017 survey) and already appeared in a mature state (i.e. maintenance of a large, bare ice face) in the earliest (July 2015) survey. By June 2016 we observed the onset of ice cliff decay, characterized by decreasing slope angle of the cliff face and progressive debris cover thickening. By June 2017 it was almost entirely buried. During its final phase, surface lowering exposed a relict englacial conduit (Figure 4C) which served as the focal point for the inception and expansion of a new ice cliff complex in June 2017 (Figure 4C); the ‘inheritance’ of englacial features has been documented elsewhere as a driver of geomorphological change on debris-covered glacier surfaces (Miles et al., 2017).
Debris thickness modelling
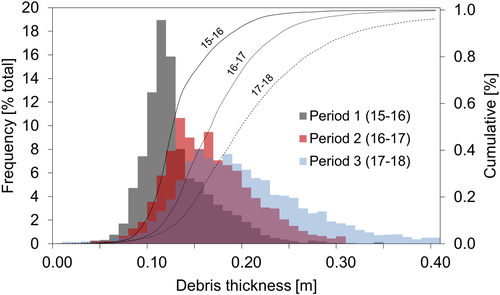
The mean (and median) modelled h was 0.13 m ± 0.04 m (0.12 m), 0.17 m ± 0.05 m (0.16 m) and 0.20 m ± 0.05 m (0.19 m) for periods 1–3, respectively (Figures 7A–C, 8). The interquartile range in h for successive periods is 0.11–0.14 m, 0.11–0.17 m and 0.14–0.22 m. We find h > 0.25 m at the base of bowl i (excluding individual large boulders, where h > 1 m), and greater thicknesses in the base of topographic depressions more generally. We also find locally elevated debris thicknesses in the southern sector of the site in the period 2 and, to a lesser extent due to the snow cover, in the period 3 data (Figure 7B, C). This signal coincides with the surface expression of the most visibly prominent debris septa in the study area which delivers sediment to the glacier surface (lower-left, Figure 7B). Debris in this region is sedimentologically distinct from that in the surrounding area by virtue of its grain size; field observation confirmed that clasts were generally finer, and debris was predominantly grey and saturated, compared to the rust-coloured or oxidized, well-drained material which is otherwise characteristic of the wider site.
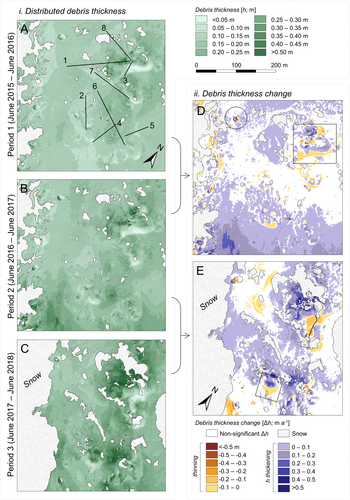
Our debris thickness differencing change data revealed an increase in the mean (median) ∆h of 0.06 ± 0.11 (0.05) m a-1 between periods 1 and 2, and 0.07 ± 0.14 (0.07) m a-1 between periods 2 and 3. Debris thickening is recorded at the base of bowl i in the earliest dataset (Figure 7D) and this thickening signal is spatially amplified in the later data (Figure 7E). The most extreme thickening (i.e. ∆h > 0.5 m a-1), e.g. at the base of bowl i in Figure 7(E), is perhaps anomalous; as for all current debris thickness estimation methods, uncertainties in these estimates are much higher for thick debris. And so, whilst these estimates of ∆h exceed our change detection threshold, they may be reflective of this uncertainty.
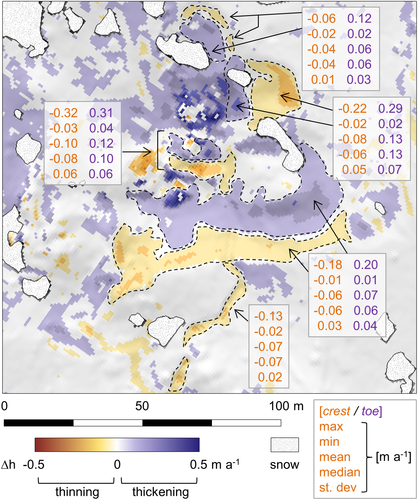
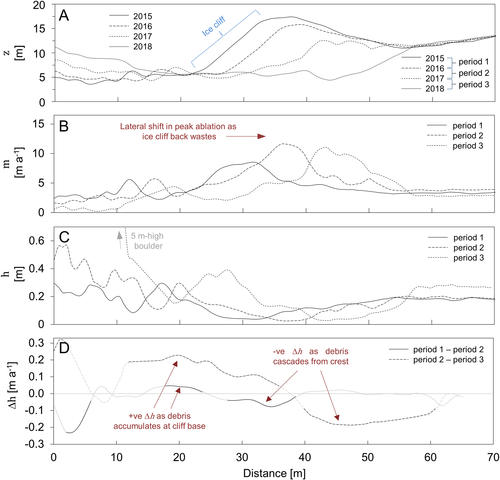
We observed isolated thickening-thinning pairings caused by downslope movement of large boulders (Figure 7D) and also observed such pairings at ice cliff complexes (Figure 9), which are characterized by debris thinning, where debris is lost from the crest area as the cliff retreats, and thickening, as debris is deposited at its base after cascading down the cliff face. Median ∆h at the ice cliff crests for the sub-sample of cliffs shown in Figure 9 are in the range from −0.04 to −0.08 m a-1, with associated standard deviations in the range 0.01–0.06 m a-1; ∆h is in the range 0.06–0.10 m a-1 at ice cliff toes. The vast majority of significant debris thickness change data show debris thickening (Figure 7D, E), rather than an approximately equal balance between thickening and thinning, as might expected. However, we note that most insignificant change showed debris thinning, and this thinning was generally recorded on the steepest topography, which is logical. It is possible that small-magnitude debris thinning is countered by debris thickening which would serve to reduce the debris thinning signal to a level that is below our change detection threshold, which may account for the widespread thickening signal that we resolve in our thresholded change maps.
The exception to our general observation of debris thickening at the base of slopes is a zone of extensive debris thinning in the range 0.10–0.21 m a-1 adjacent to an englacial conduit that surface lowering exposed between June 2016 and June 2017, and which bisects a decaying ice cliff (Figure 7E). We hypothesize that such a homogeneous pattern of thinning without any contiguous thickening represents the ingestion of this material by the conduit as it is gradually exposed, and adjacent slopes steepen. The conduit had become blocked and buried by June 2018. Another area of note is the lower-left (south-western) portion of the site, which records substantial debris thickening (> 0.2 m a-1) between periods 1 and 2, followed by considerable thinning of a similar magnitude between periods 2 and 3 (Figure 7D, E). We previously highlighted the presence of a prominent debris septa which emerges at the glacier surface in this location, which would account for the enhanced rates of debris thickening (Figure 7D). The most likely explanation for the substantial thinning in the subsequent period is the progressive or sudden destabilization of this debris by slope oversteepening (Figure 10), with the corresponding downslope deposit obscured by seasonal snow in period 3.
Debris stability modelling
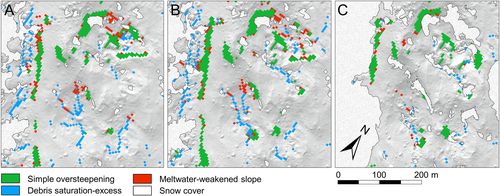
The area theoretically subject to one or more types of debris instability (after Moore, 2018) was 20.4%, 24.8% and 13.9% for periods 1–3, respectively (Figure 10, Table 2). Of these instabilities, slopes subject to meltwater-weakening were the most prevalent and also include all slopes subject to simple oversteepening, whilst slopes subject to debris saturation-excess were the least extensive (Table 2). The extent of debris saturation-excess-affected areas decreased year-on-year from 3.7% to 1.3%, whilst we observe no sustained increase or decrease in the areal coverage of simple oversteepening or meltwater-weakened slopes.
| Year/differencing period | Percentage survey area | |||
| Simple oversteepening | Debris saturation-excess | Meltwater-weakened slope | Total | |
| Period 1 (2015–2016) | 6.0 | 3.7 | 10.7 | 20.4 |
| Period 2 (2016–2017) | 8.4 | 3.4 | 13.0 | 24.8 |
| Period 3 (2017–2018) | 5.5 | 1.3 | 7.1 | 13.9 |
| Period 1–2 | ||||
| Remains unstable | 3.9 | 0.5 | 5.3 | |
| Destabilized | 2.8 | 1.3 | 4.3 | |
| Stabilized | 1.2 | 1.5 | 3.0 | |
| Net change | -1.6 | 0.2 | -1.3 | |
| Period 2–3 | ||||
| Remains unstable | 3.8 | 0.1 | 4.3 | |
| Destabilized | 1.9 | 1.1 | 3.0 | |
| Stabilized | 2.9 | 1.7 | 5.3 | |
| Net change | 1.1 | 0.6 | 2.3 | |
We observed strong oversteepening and meltwater-weakening signals in the vicinity of ice cliff complexes, across the north-western slopes of bowl i, and along the western edge of the study site, which traces the flank of the large medial moraine that spans the length of the glacier's wider debris-covered area (Figure 10). We also observed clear debris saturation-excess signals, which trace the supraglacial stream that bisects the western edge of the study area, and on the northern slopes of bowl ii. In the case of the former, upslope contributing areas were subject to instability via both simple oversteepening and meltwater-weakening and hints at wider stream-slope connectivity as lateral migration of the stream serves to erode the slope toe, thus decreasing the buttressing effect of material at the base of adjacent slopes and triggering upslope instability. Such feedback mechanisms have been documented at various scales in glacial (e.g. McColl and Davies, 2013) and off-glacier environments (e.g. Simon, 1989).
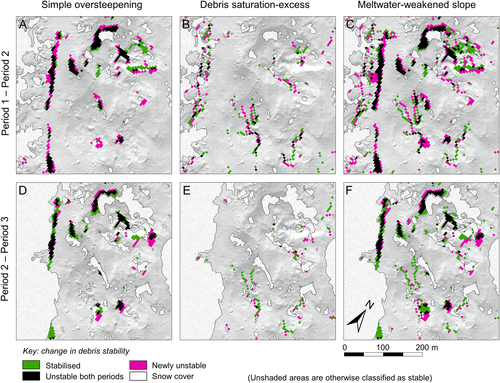
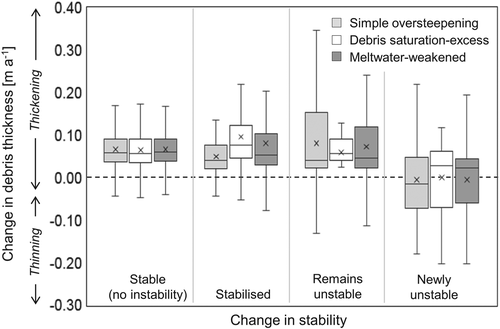
We additionally quantified the spatiotemporal evolution of these instabilities (Figures 11, 12). Between periods 1 and 2 we observed a very slight (0.2%) net increase in the area subject to debris saturation-excess instability, and small net decreases (~1.5%) in the extent of areas subject to simple oversteepening or meltwater-weakening (Table 2). In contrast, we observed small net increases (maximum 2.3%) in the extent of all modes of instability between periods 2 and 3. Ice cliff backwasting manifests as debris stabilization–destabilization pairings (Figure 11), consistent with modelled debris thickening-thinning pairings (Figure 9) as face ablation destabilizes the debris layer at the cliff crest whilst debris cover at the base of the cliff progressively stabilized. A similar signal was observed across slopes that were actively backwasting but were not associated with ice cliffs. We also observed the lateral migration of debris saturation-excess (Figure 11B) and meltwater-weakened ‘channels’ (Figure 11C), notably in the southern sector of the site (bowl ii) where these zones can shift by up to 15 m a-1 laterally, a finding which is commensurate with Mölg et al. (2020) who found that in the absence of extreme topographic confinement, supraglacial streams on debris-covered Zmuttgletscher migrated laterally and did not reactivate in the same position each summer.
Discussion
The discussion that follows revisits the overall aim of the study, which was to develop empirical understanding of secondary debris redistribution processes on a glacier surface over a multi-annual period and set these patterns in the wider context of the geomorphological evolution of supraglacial topography. Such empirical studies, which commonly employ some combination of detailed fieldwork, analytical or numerical modelling, and remote sensing, are crucial for advancing our understanding of debris-covered glaciers and the processes affecting their evolution.
Patterns and drivers of glacier surface evolution
Our surface lowering results show that patterns of ablation vary over space and time and can vary by over an order of magnitude over relatively short spatial scales (Figure 6), primarily due to variations in debris thickness (Figure 7). Overall year-to-year variations in ablation for a given location are determined firstly by annual variations in meteorological forcing, and debris thickness, and secondly by more localized effects, such as proximity to patches of snow cover (which can exert a net cooling effect), topographic shadowing, and other various meso- and micro-scale controls on the surface energy balance, which we do not consider due to computational limitations, and a lack of empirical knowledge of these effects.
By analysing our debris thickness and debris thickness change data (Figure 7) we found no significant relationships between h or ∆h and topographic variables including aspect, slope and terrain curvature (cf. Nicholson et al., 2018). We found the thinnest debris cover on steep, western-facing slopes, and the thickest on slopes with a northerly aspect, which broadly mirror the findings of Nicholson et al. (2018) who found that debris tended to be thicker on slopes with a north-westerly aspect on Khumbu Glacier. We attribute these patterns to the dominant direction of incoming shortwave solar receipt, which, due to the site's location and surrounding topography, is broadly from the south. Slopes with a southerly aspect possess a higher solar radiation receipt, and enhanced meltwater production, which in turn promotes debris instability and enables downslope debris redistribution (Moore, 2018). However, this inference is tentative; it is difficult to quantify how much of an impact slope and aspect have on debris thickness without directly accounting for these effects in our modelling workflow, which would have been computationally unfeasible. It is possible that we underestimate ablation on south-facing slopes (by modelling less incoming radiation than is actually received by these surface) and therefore underestimate debris thickness, and vice versa for north-facing slopes. However, these relative underestimations or overestimations are consistent such that they should cancel out in our debris thickness differencing results and have a minimal impact on our overall analysis and interpretation.
Ice cliff evolution serves as an efficient mechanism for debris remobilization (e.g. Nicholson and Mertes, 2017). Most ice cliffs whose inception was not obviously linked to supraglacial stream activity (Mölg et al., 2020) in the study area occupy north- to northwest aspects, which conforms to published ice cliff inventories (e.g. Watson et al., 2017a) and modelling (Buri and Pellicciotti, 2018). These studies found that, in the absence of an adjoining melt pond, incoming shortwave solar radiation receipt is the dominant control on ice cliff aspect. We observed ice cliff inception via slope oversteepening (Sakai et al., 1998; Benn et al., 2007) and ice cliff renewal via the exposure of englacial features (Kirkbride, 1993; Benn et al., 2012; Immerzeel et al., 2014; Watson et al., 2017a, 2017b). As ice cliffs move from a mature to decaying regime, their face angle decreases (Figure 13A), and the local ablation peak translates laterally across the glacier surface (Figure 13B). In a first attempt to quantify rates of debris redistribution enabled by the evolution of these features, we observed quantifiable thickening of the debris layer at the cliff toe, and associated thinning at the crest (Figures 9, 13C, D). Mass conservation suggests that rates of loss and gain should cancel each other, however, re-sorting of material as it cascades down the cliff face may go some way to ‘undoing’ the compaction that debris cover may experience over time by reducing layer density (Anderson and Anderson, 2018), and may account for the thicker mean debris thicknesses at ice cliff toes compared to their crest source areas (Figure 9).
Improving empirical understanding of debris redistribution
Our data provide quantifiable insight into the relationship between debris instability and its effect on debris thickness. Areas which remain stable, stabilize, or remain unstable (Figure 11) are almost exclusively associated with debris layer thickening (mean 0.07, 0.08 and 0.07 m a-1, respectively), whilst slopes which have transitioned from stability to instability exhibit both thickening and thinning signals (mean 0.00 m a-1) (Figure 12). We therefore demonstrate a tendency for areas identified as unstable in one differencing period to exhibit appropriate changes in debris thickness that indicates transport away from instability, or towards greater stability.
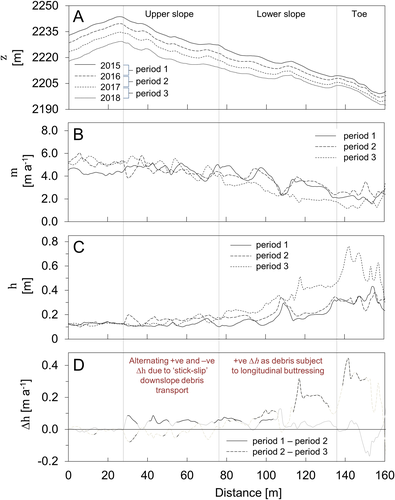
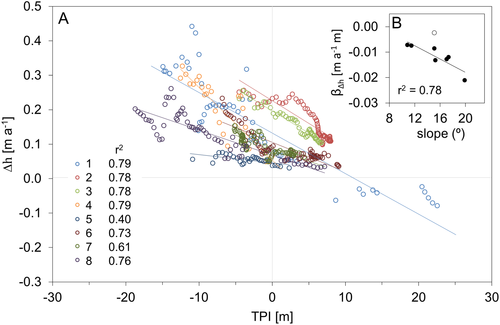
To further unravel the complexities of how, and at what rate, debris is redistributed across debris covered glacier surfaces, we quantified downslope changes in debris thickness, and debris thickness change. Initially, we plotted Δh and topographic position index (TPI) for the entire site, but found no discernible relationship. To refine the approach, and to test the assumption that such relationships emerge when investigated at the scale of individual slopes, we identified a series of slopes that are representative of the range of slope angles and lengths in the study site, and extracted values of Δh and TPI for each cell that the profile intersected (Figures 14, 15). We discovered that: (i) debris thickness generally increases with slope-distance (i.e. distance from a slope crest along the path of steepest descent; Figure 14C) and (ii) the rate at which the debris layer thickens also increases with slope-distance (Figure 14D).
 (4)
(4)Broader implications and future directions
In this work we have isolated and quantified the efficacy of various mechanisms for remobilizing supraglacial debris. Our study is the first to combine high resolution field surveying, including remote sensing components, and numerical modelling to quantify distributed patterns of debris thickness and debris thickness change across a glacier surface at the meso-scale. It therefore represents an important methodological benchmark from which future studies can explore relationships between debris redistribution at high resolution.
Some of our more anomalous findings, such as the location of thicker debris concentrations at the crest of hummocks, fit within the scope of conceptual models of topographic inversion; the infilling and thickening of the debris layer in topographic lows (e.g. Thompson et al., 2016) serves to suppress melt relative to the surrounding area. This localized ablation differential contributes to eventual topographic inversion. Previous studies (e.g. Sharp, 1949) have posited that topographic inversion operates over decadal timescales. Based on the spatiotemporal patterns of topographic evolution in our data, such estimates appear sound; over a three-year period, we clearly observe the progression of various mechanisms that contribute to topographic inversion. These findings conform with those of Mölg et al. (2020) who found that high relief areas on a debris-covered glacier surface can develop from an initially smooth glacier surface over a period of two decades. The acquisition and analysis of longer-term (decadal), high-resolution DEM and meteorological time series’ using approaches such as those presented in this article may shed additional light on these processes.
Future work might focus on both methodological improvements, and spatiotemporal upscaling. Specifically, we highlight the importance of further reducing uncertainties in the debris thickness modelling workflow by (i) measuring spatial and temporal variations in debris properties to further reduce uncertainties in our debris thickness estimation model, and (ii) exploring, and ideally quantifying, the role that local-scale topographic and meteorological factors play in determining debris thickness. Advances in either, or both aspects may serve to further reduce uncertainties in the debris thickness estimation workflow and in turn reduce the signal-to-noise ratio that we observe in some of our results (e.g. Figure 7D, E). We further suggest that future work might seek to apply our methods, or improvements thereof, across larger temporal scales (e.g. decadal) and spatial domains (e.g. glacier-scale, and across multiple glaciers), and incorporate historical debris distribution and debris thickness data where these are available. In this way such work might begin to bridge the gap between those studies which focus on debris cover expansion and redistribution at timescales ranging from a few months to a few years (i.e. this study, Fyffe et al., 2020), and the centennial scale (e.g. Deline, 2005; Mölg et al., 2020).
Conclusion
We quantified the geomorphological evolution of a debris-covered glacier surface over a three-year period. Differencing of high-resolution DEMs provided insight into spatiotemporal patterns of surface change, which was characterized by widespread surface lowering which exceeded 3.5 m a-1 across all years. Ice cliff backwasting dominated the surface change signal, and we observed all stages of ice cliff development, including inception or renewal via englacial conduit exposure. Debris thickness mapping, and the thresholded differencing of these data, provided insights into the distribution of debris thicknesses across the site and allowed us to identify areas which experience debris thinning, predominantly ice cliff faces and other backwasting slopes, and thickening, such as at the base of slopes. We corroborated these findings through debris stability modelling, which revealed that slopes which become newly unstable are associated with either debris thickening or thinning, whilst those which remained stable, stabilize, or remained unstable were associated almost exclusively with net thickening. The rate at which debris cover thickens can be described as a function of the topographic position index, and, ultimately, local slope gradient. These empirical data contribute to the knowledge foundation of how, and at what rates, secondary debris redistribution occurs over glacier surfaces. We suggest that future work might focus on (i) reducing uncertainties in the debris thickness modelling workflow and (ii) quantifying secondary debris redistribution across larger temporal scales (e.g. decadal) and spatial domains (e.g. one or more entire glaciers) to explore the role that debris remobilization plays in controlling glacier surface evolution more widely.
Acknowledgements
MJW acknowledges receipt of an ECR Grant from the British Society for Geomorphology, and additional financial support from the Department of Geography and Environmental Sciences, Northumbria University. DRR acknowledges support from the National Aeronautics and Space Administration's NASA-ROSES programme (grant NNX17AB27G). The authors thank Philip Deline for providing a copy of his doctoral thesis, which contained bed topography data for Miage Glacier as inferred from geophysical surveys and which were used as part of the glacier flow corrections. The authors thank Mark Allan and Clare Webster for assistance with data collection in July 2015. PlanetScope imagery is used under the terms of Planet's Education and Research Programme. Aerial LiDAR data were provided by the Natural Environment Research Council (NERC) Airborne Research and Survey Facility (projects GB07-09 and GB07-10). Off-glacier meteorological data were retrieved from the Centro Funzionale Regione Autonoma Valle d'Aosta (https://cf.regione.vda.it) and are used under the terms of their licence for reuse of public data. The authors are grateful to the Chief Editor, Associate Editor, and two anonymous reviewers for their constructive comments on the manuscript.
Data availability statement
Key datasets produced and analysed during the current study are available at dx.doi.org/10.5281/zenodo.3970666. Reasonable requests to access the data will be granted by the corresponding author.
Conflict of interest
The authors declare no conflict of interest.


