Processes at the margins of supraglacial debris cover: Quantifying dirty ice ablation and debris redistribution
Abstract
Current glacier ablation models have difficulty simulating the high-melt transition zone between clean and debris-covered ice. In this zone, thin debris cover is thought to increase ablation compared to clean ice, but often this cover is patchy rather than continuous. There is a need to understand ablation and debris dynamics in this transition zone to improve the accuracy of ablation models and the predictions of future debris cover extent. To quantify the ablation of partially debris-covered ice (or ‘dirty ice’), a high-resolution, spatially continuous ablation map was created from repeat unmanned aerial systems surveys, corrected for glacier flow in a novel way using on-glacier ablation stakes. Surprisingly, ablation is similar (range ~5 mm w.e. per day) across a wide range of percentage debris covers (~30–80%) due to the opposing effects of a positive correlation between percentage debris cover and clast size, countered by a negative correlation with albedo. Once debris cover becomes continuous, ablation is significantly reduced (by 61.6% compared to a partial debris cover), and there is some evidence that the cleanest ice (<~15% debris cover) has a lower ablation than dirty ice (by 3.7%). High-resolution feature tracking of clast movement revealed a strong modal clast velocity where debris was continuous, indicating that debris moves by creep down moraine slopes, in turn promoting debris cover growth at the slope toe. However, not all slope margins gain debris due to the removal of clasts by supraglacial streams. Clast velocities in the dirty ice area were twice as fast as clasts within the continuously debris-covered area, as clasts moved by sliding off their boulder tables. These new quantitative insights into the interplay between debris cover characteristics and ablation can be used to improve the treatment of dirty ice in ablation models, in turn improving estimates of glacial meltwater production. © 2020 The Authors. Earth Surface Processes and Landforms published by John Wiley & Sons Ltd
Introduction
Ablation of partially debris-covered ice (dirty ice) is thought to be higher than ablation of both clean and completely debris-covered ice (Reid and Brock, 2010; Evatt et al., 2015). On debris-covered glaciers, dirty ice areas exist up-glacier from the margin of the continuous debris cover, where the ablation rates are some of the highest found across the glacier (Fyffe et al., 2014). The increase in the spatial extent of supraglacial debris covers, which typically operates over decadal timescales (Kirkbride and Warren, 1999; Stokes et al., 2007; Bolch et al., 2008; Bhambri et al., 2011; Thakuri et al., 2014) occurs by the up-glacier migration of the margin of the continuous cover, so understanding melting processes here is crucial to be able to predict future changes in debris cover and glacier mass balance. Robust predictions of glacier mass balance are imperative for accurate forecasting of future glacier runoff that considers the combined influence of climate change and changing supraglacial debris cover.
The Østrem curve describes the relationship between debris thickness and sub-debris ablation (Østrem, 1959, 1965). When the cover of debris is thin (defined by being less than the ‘critical thickness’), ablation is higher than the ablation rate for clean ice, whereas debris thicker than the critical thickness reduces ablation compared to clean ice (see figure 2 in Kirkbride and Dugmore, 2003). This critical thickness is dependent on weather conditions and the bare ice albedo (Hagg et al., 2008; Lejeune et al., 2013). The debris thickness resulting in the highest ablation is termed the ‘effective thickness’; represented by the peak of the Østrem curve (Kirkbride and Dugmore, 2003). Thin debris increases melt by (a) decreasing albedo, allowing greater absorption of incoming solar radiation, and (b) allowing the fast conduction of heat energy to the ice surface (Mattson et al., 1993). Meanwhile, thick debris reduces melt because heat is lost from the surface of the debris to the atmosphere, and because the diurnal cycle is attenuated by the debris so it is reduced in amplitude at the ice–debris interface (Reznichenko et al., 2010).
Østrem curves have been derived for several glaciers worldwide [e.g. Khan, 1989; Mattson et al., 1993; Konovalov, 2000; Popovnin and Rozova, 2002; Lukas et al., 2005; Mihalcea et al., 2006; Nicholson and Benn, 2006; Hagg et al., 2008; Reid and Brock, 2010; Wang et al., 2011; Brook et al., 2013 (including studies on rock debris not tephra)], usually from ablation stake measurements at sites with naturally varying debris thicknesses or at artificial plots. However, thin debris covers are rarely continuous due to variations in clast thickness and redistribution by meltwater (Østrem, 1959, 1965). Ablation in areas of discontinuous debris cover is suspected to be very spatially variable, because clast thicknesses vary around the critical thickness (especially for rock debris, typically 1–3 cm, see Table 1), and stake measurements cannot adequately capture this variability. Enhanced melting below small clasts forms cryoconite holes (e.g. Bøggild et al., 2010), whereas thicker clasts form boulder tables, from micro-tables under small clasts to examples several metres tall under large boulders.
| Reference | Glacier | Findings on increased ablation |
|---|---|---|
| Østrem (1959, 1965) | Isfallsglaciären, Tarfala, Swedish Lapland | Melt water erosion meant that measurements of enhanced ablation beneath thin layers were difficult to obtain. Critical thickness around 0.5 cm of sand |
| Loomis (1970) | Kaskawulsh Glacier, Yukon | Ablation beneath thin debris resulted in an ablation rate 129% of bare ice ablation |
| Small and Clark (1974) | Tsidjiore Nouve, Valais, Switzerland | Ablation beneath patches of debris 2–3 cm 117.3% of bare ice, bare ice between dispersed debris patches 125.7% of bare ice. 1 cm fine debris also increases ablation (172.3 and 121.9% of bare ice for sites 2 and 4, respectively) |
| Khan (1989) | Barpu Glacier, Karakoram Himalaya | Critical thickness 3 cm and effective thickness 1 cm, with ablation almost doubled under 1 cm debris thickness compared to bare ice |
| Mattson et al. (1993) | Rakhiot Glacier, Punjab, Himalaya | Critical thickness 3 cm and effective thickness 1 cm. Debris movement was greater where debris was thinner and ablation higher |
| Syverson and Mickelson (1993) | Burroughs Glacier, Alaska | Enhanced ablation seen initially (after 2–4 days) for plots with 0.5 cm sand, 0.5 cm till and 1 cm till but by the end of the study period ablation was retarded or the same as clean ice (0.5 cm sand). This lack of enhanced ablation thought due to the maritime climate. Heavy rainfall removed most of the debris from the plots |
| Adhikary et al. (2000) | Lirung Glacier, Nepal Himalaya | Critical dust thickness 1.33 mm (0.6 kg m−2), effective dust thickness 0.25 mm (0.112 kg m−2). Dust particles were washed off the surface due to meltwater. The dust reduced albedo values, although they then increased over time. The influence of dust on ablation was greater on a cliff compared to a flat surface |
| Kayastha et al. (2000); Takeuchi et al. (2000) | Khumbu Glacier, Nepal Himalayas | Critical thickness 5 cm, effective thickness 0.3 cm |
| Konovalov (2000) | Glaciers of central Asia, Caucasus and Altai | Critical thickness 1 cm and effective thickness 0.2 cm |
| Popovnin and Rozova (2002) | Djankuat Glacier, Caucasus | Critical thickness 7–8 cm, effective thickness 2 cm, with ablation under 2 cm 135% of clean ice. Critical thickness thought high due to packing of debris |
| Hagg et al. (2008) | Southern Inylchek Glacier, Tian Shan | Clean ice ablation was not exceeded at any of the plots with debris, however the bare ice plots were not completely clean |
| Mihalcea et al. (2008) | Baltoro Glacier, Karakoram | Mention that where debris was very thin the variable debris cover altered ablation rates |
| Brook et al. (2013) | Franz Josef Glacier, New Zealand | Clean ice ablation was not exceeded at any of the plots with debris, thought due to bare ice plots not being completely clean |
| Anderson (2014) | Kennicott Glacier, Alaska | Enhanced ablation detected with effective thickness 1 cm, although ablation rates variable when debris <3 cm thick |
Ablation modelling of partially debris-covered areas remains in its infancy. Most energy balance models presume a continuous debris cover, with ablation increasing with decreasing debris thickness, and so do not replicate the decrease in ablation for thicknesses below the effective thickness, which forms the peak in the Østrem curve (Nicholson and Benn, 2006; Zhang et al., 2011; Reid et al., 2012; Collier et al., 2014; Rounce et al., 2015). However, Reid and Brock (2010) were able to replicate the peak in the Østrem curve by varying both debris thickness and the ratio of ice to debris (or ‘patchiness’). The ice–debris ratio decreased with increasing debris thickness, simulating the decrease in exposed ice as the debris thickens. Evatt et al.’s (2015) melt model simulates porous debris layers, and this model replicated the peak in the Østrem curve by either varying the proportion of debris cover, or by reducing the evaporative heat flux as the debris thickens. However, neither of these models have been evaluated using field data from partially debris-covered ice due to a lack of suitable data on spatially continuous ablation, the key model input variables (especially clast size and thickness, debris patchiness and albedo), and how these variables interact with each other.
Furthermore, a challenge for debris-covered glacier research is to determine future change in debris cover extent and thickness, which is complicated by the complex relationships between debris supply, debris thickness, sub-debris melt, surface topography and glacier dynamics. Existing studies of debris cover formation are theoretical or restricted to the glacier centre line (Anderson, 2000; Kirkbride and Deline, 2013; Anderson and Anderson, 2016; Wirbel et al., 2018). Rowan et al. (2015) created a mass balance model that simulates debris transport (following ice flow) and the subsequent evolution of supraglacial debris cover thickness, thereby allowing the integration of the influence of debris cover on glacier mass balance. However, the local-scale supraglacial debris redistribution processes were not accounted for. Moore (2018) provides a methodology for predicting instability in supraglacial debris using a theoretical approach, but current understanding of the mass movement processes relevant to supraglacial debris remains limited, mainly due to a lack of field data describing rates of debris movement and change in debris cover extent over time.
- What is the influence of percentage debris cover, albedo, clast size and clast thickness on dirty ice ablation rates, and how do these variables interact?
- How can clast thickness and albedo be determined from UAS outputs to facilitate modelling of dirty ice ablation?
- What are the processes that control debris supply and remobilization in dirty ice areas?
Methodology
Study site
Miage Glacier is completely debris-covered over its lower tongue, with a mean debris thickness of 0.25 m (Foster et al., 2012). The study site is a ~180 × 200 m area of dirty ice situated between 2453 and 2484 m a.s.l., above the continuous debris cover, and between a left-lateral and medial supraglacial moraine (Figure 1). The lower portion of the site is bounded by debris deposited from an ice avalanche that originated from a gully on the northern margin of the central (Dome Glacier) tributary. The supraglacial debris at the study site is composed of a mixture of schists, gneiss and tectonic breccia (Deline, 2002), derived originally from rock fall and snow/rock avalanches from the steep valley sides (Deline, 2009). The dirty ice region between the moraines has a discontinuous cover of dust- to boulder-sized clasts, with patches of more complete cover (Figure 1). Debris is supplied to this region directly via dirt cones and the melt-out of transverse debris-filled crevasse traces, and indirectly from the surrounding moraine slopes, although occasionally rock fall and avalanches supply debris from adjacent bedrock slopes. Supraglacial streams follow the base of the left-lateral moraine (towards the north east of the study site), and the base of the medial moraine (towards the south west of the study site), and confluence to the south of stake S15 (see Figure 1).

Field data collection
Survey stakes and their use as ground control points
Visits to Miage Glacier were conducted in July and August 2017. Prior to the first UAS survey, 16 white plastic ablation stakes were drilled into the ice using a Heucke stream drill and were distributed across the study area so that they could be used as ground control points for subsequent georeferencing of the UAS imagery. Stakes were cut flush with the ice surface and a ground marker was added to identify stake locations in the UAS imagery (Figure 1c). Stakes were surveyed in July using a combination of a Leica VIVA GS10 differential global navigation satellite system (GNSS) and Leica Builder 500 total station (up to 0.0015 m accuracy over 100 m), whereas in August solely the GNSS was used. The GNSS was composed of a base station situated on a stable boulder near Miage Lake (near the terminus of the glacier) and a roving system operating in static mode. The ablation at each stake during the study period was also measured.
The mean quality of the July reference stake GNSS positions (as reported by Leica Geo Office software) was ≤0.002 m in XY and Z, with the ambiguities being successfully resolved in all cases. In August, the positions of two stakes were not resolved successfully. However, stakes were still sufficient in number and spatial distribution to allow georeferencing of the UAS imagery, and the quality of the successfully occupied positions was satisfactory (mean quality of ≤0.005 m in XY and Z).
An independent estimate of the GNSS survey error was given by occupying the S4 reference stake twice, with the difference in positions equating to 0.021 m in XY and 0.006 m in Z. These errors are notably larger than the software estimates, likely due to the operator-induced errors involved in maintaining the GNSS staff stable over the stake location. As a result, we conservatively estimate horizontal (XY) and vertical (Z) GNSS survey errors of 0.02 and 0.01 m, respectively. Later, these errors, and others, are used to estimate the total error in the ablation maps.
UAS image acquisition and processing
A small rotary-winged UAS, the DJI Phantom 4 Pro (P4P) quadcopter, was deployed to acquire high-resolution imagery of the site on 17 July and 22 August 2017. The P4P was flown c. 30 m above the glacier, which permitted the acquisition of imagery with a spatial resolution of c. 0.01 m. The P4P integrated camera is a 1-inch CMOS sensor, capable of recording standard optical imagery in RGB. Imagery was collected with sufficient overlap (c. 80%) to ensure successful image matching using structure from motion (SfM) photogrammetry. Images were acquired predominantly at nadir, with the inclusion of a smaller proportion of images (25–30% depending on the survey date) acquired at oblique angles to mitigate against the introduction of systematic elevation errors which can result from the use of solely nadir imagery (James and Robson, 2014). Images affected by blurring or other visual artefacts were excluded, returning a total of 182 and 361 usable images for the July and August surveys.
Imagery was processed using SfM photogrammetry within Agisoft PhotoScan Pro version 1.4.0 (now known as Agisoft Metashape) to produce a digital elevation model (DEM) at 0.04 m ground sample distance (GSD) and an orthophoto at 0.009 m GSD for each survey date. The mean residual errors associated with the spatial positioning of the DEM and orthophoto were computed by comparing the known positions of four reference stakes (S1–S4) which had been surveyed using the GNSS with the corresponding positions on the DEM and orthophoto. These errors equate to the spatial accuracy of these data products in XYZ and were −0.024 and −0.010 m for the July and August surveys, respectively. The mean residual errors in Z only (i.e. mean elevation errors) were −0.065 and −0.038 m for the July and August surveys, respectively.
Data collected on the ground
Fifty 0.5 × 0.5 m quadrats were established during the July field campaign only (Figures 1a and b). Close-range quadrat photographs (hereafter ‘ground truth photographs’) were taken on 19 and 22 July 2017, after the acquisition of UAS imagery. The four corners of the quadrats were georeferenced using the total station and GNSS. The quadrat corner locations were then used to georeference the close-range ground truth photographs into ArcGIS v10.5.1 using a projective transformation.
The albedo of 25 of these quadrats was measured using a Kipp and Zonen CM7B albedometer (sensitive in the wavelength range 0.3–2.8 μm, with a pyranometer accuracy of ±2%) held level at a height of 1 m from the surface, around 0.5 m from the fieldworker, while ensuring the sensors were not shaded. Albedo measurements were made between 13:08 and 15:15 on 22 July under mainly cloudy conditions. While ice albedo is observed to increase under cloudy conditions, due to a shift in the incoming solar radiation to shorter wavelengths, the effect is small for light to moderately cloudy conditions and for ice affected by light-absorbing impurities (Brock, 2004). Based on observations of albedo under cloudy conditions by Brock (2004), which were made on bright, clean ice where cloud effects are enhanced, we estimate the uncertainty of the albedo measurements to be ±5%.
At seven quadrats the dimensions of all but the smallest clasts (A-axis less than ~0.01 m) were measured by hand. The A- and B-axes (as seen from above) and the clast thickness (not necessarily the C-axis) were measured. Once measurements were complete, the clasts were redistributed over the ice surface within the quadrat.
Sample points within each quadrat were selected by placing a regular 0.05 × 0.05 m grid across each quadrat in ArcGIS (Figure 1b). At each point the surface was classified as ice or debris by eye, based on the ground truth photographs. The A- and B-axis dimensions of each clast which fell beneath a sample point were also measured using the scaled and georeferenced photograph. The clast axes were digitized by hand. Some clasts were not measured, either because they fell partially outside of the quadrat, were too small to identify or were obscured by other clasts. On average, 29 clasts were measured per quadrat. The A- and B-axis measurements identified from the ground truth photographs give information only on the surface clasts. Grain size statistics (mean, D50 and D84) were calculated for each quadrat.
Data analysis
Spatially continuous ablation
To calculate continuous ablation over the 1-month interval between UAS surveys, corrections to the August DEM were required to take account of the horizontal and vertical components of glacier flow. To achieve the horizontal shift, the August DEM was spatially repositioned to align with the July DEM, using a first-order polynomial (affine) transformation based on the horizontal (XY) change in location of the stakes between the two surveys. The spatial variation in horizontal velocity and the residuals from the affine transformation are shown at the stake locations in Figures S1a and b in the online Supporting Information.
- The mean XY error associated with transforming the August DEM to align with the July DEM (α = 0.129 m).
- The residual XY errors for each epoch (i.e. the difference between the positions of markers S1, S4, S8 and S12 from the GNSS data and their corresponding positions on the ortho-imagery generated from the UAS-SfM approach; see Table S1 in the online Supporting Information). Equation 1 was used to compute combined XY residual errors for each survey epoch (φ) rather than individual X and Y values, with Equation 2 used to propagate the residual error across both survey epochs (β = 0.048 m):
 (1)
(1) (2)
(2)- The GNSS survey error of θ = 0.02 m (as reported above).
The sum of these three errors (α, β and θ) equates to 0.197 m, which gives a conservative estimate of the total XY error associated with the ablation map.
To determine ablation, it was necessary to account for the elevation change caused by down-valley glacier flow and the ice emergence velocity (which describes the vertical component of glacier flow in the ablation zone). This was computed as the difference between measured stake ablation and the vertical height change measured at each stake using the GNSS-total station data. Using ablation stakes as control points allowed the combined slope and emergence value to be quantified explicitly, instead of estimating these terms (cf. Rounce et al., 2018). The variation in the combined slope and emergence value did not show a clear spatial pattern across the survey area (see Figure S1c in the online Supporting Information) and ranged from 0.59 to 0.67 m. As a result, the mean value (0.62 m) was applied as a uniform positive vertical shift to the August DEM.
We calculated ablation between the two surveys by subtracting the repositioned and vertically corrected August DEM from the July DEM using 2.5D differencing. Mean ablation was calculated at a range of scales, specifically ×50, ×100 and ×150 multipliers of the orthophoto GSD (equating to cell sizes of ~0.47, 0.95 and 1.42 m, respectively). We restrict our analysis of ablation data to ×50 GSD and above (or mean values within the 0.5 × 0.5 m quadrats) because this multiplier exceeds the horizontal error of the ablation data (0.197 m).
To assess the overall accuracy of the spatially continuous ablation map, measured stake ablation was compared with the mapped ablation values, giving a root mean square error (RMSE) of 1.45 mm w.e. per day, equating to 0.059 m over the 36-day study period, or 2.7% compared to the mean stake surface loss. Ablation values may be influenced by boulder movement, producing artificial ‘ice loss’ (July) and ‘ice gain’ (August) pairings. To remove this effect for large boulders, ablation within the dirty ice region (see Figure 1a) of <40 or >70 mm w.e. per day was excluded from further analysis, equating to 3.3 and 2.6% of the ablation data within the dirty ice region, respectively. These threshold values were determined after iteration to allow the removal of ablation data which were obviously attributable to boulder movement, while maintaining the majority of the ablation data. The removed ablation data (see Figure S2 in the online Supporting Information) is restricted to boulder-shaped pairs, except for some areas of very high melt following the main streams, small areas of low melt where the debris is continuous near the boundary of the region, and at the stream confluence where boulders accumulated in the channel. The movement of small clasts is unlikely to have a significant influence on the mapped ablation values, since the mean measured clast thickness (0.014 m) was lower than the error in the ablation map, and clast movement into a cell will be balanced by clast movement out of a cell, so that the overall influence on ice loss should be minimal. Negative ablation values outside of the dirty ice area were also removed. Ablation within the quadrats was checked for clast movement: this resulted in quadrats QAP and QD being excluded from analysis. Other quadrats were excluded due to georeferencing issues (QAS) or because they fell outside of the spatially continuous ablation map (QAX and QO).
Percentage debris cover
Percentage debris cover was determined for each survey using two methods: ‘point’ and ‘orthophoto’. The point’ method involved determining the percentage debris cover from the ice/debris classification of the surface beneath each of the sample points within each quadrat (see ‘Data collected on the ground’ and Figure 1b). The ‘orthophoto’ method involved classification of the July and August orthophotos into debris or ice using a maximum probability method. Training sites for the classification were located within the quadrats, using a similar number of ‘ice’ and ‘debris’ cells. The July and August orthophotos were classified separately to account for differences in illumination. The training sites used for classification were similar in number and distribution across both survey epochs. The resulting debris/ice classifications (cell size ~0.01 × 0.01 m) were then used to determine the percentage debris cover at a range of scales.
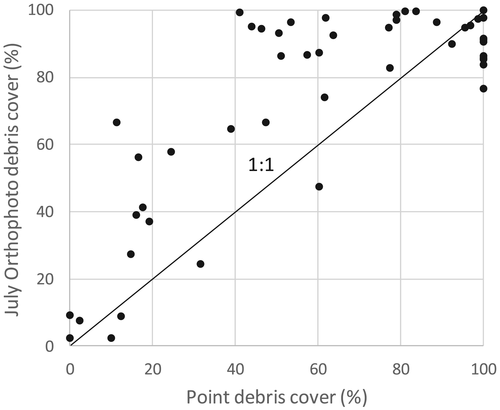
The point method of deriving the percentage debris cover is more reliable since the surface cover beneath each point is known, although the surface cover is only sampled. The orthophoto method was evaluated by classifying the orthophoto by eye for each image at 249 equally spaced points, giving a producer's accuracy (derived from the number of correctly classified points divided by the number of points known to be in that class) for the July (August) classification of 89% (95%) for debris and 49% (49%) for ice. Ice cover is therefore under-represented by the classification approach due to relatively dark ice being misclassified as debris. This explains why the orthophoto method overestimates the percentage cover compared with the point method (Figure 2). The exception to this is when the point method estimates 100% debris cover, and lower values are given within the orthophoto method, a consequence of misclassification of light-coloured debris as ice. However, the orthophoto method allows the determination of the percentage debris cover across the entire study area.
Debris cover change
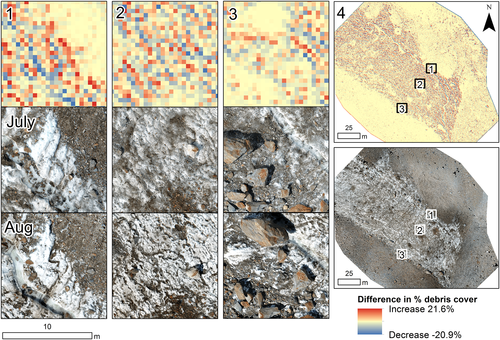
The change in debris cover between the two surveys was quantified using three approaches. First, the difference in orthophoto percentage debris cover between July and August was calculated at three scales (50×, 100× and 150× orthophoto GSD). Second, the change in cover type was quantified by manually delimiting the boundary between the dirty and continuously debris-covered area (e.g. Figure 1a). Finally, individual clast movement was manually tracked. Clasts were chosen by creating sample points extracted from a 7.46 m regular grid created over the study area. At each sample point, the nearest clast which could be clearly identified as the same clast in both the July and August ortho-images was tracked by creating a line joining the same point on the clast in both images, which produced 295 individual clast tracks. These tracks were used to determine the clast velocity, directional bearing, boulder a-axis length (from the July orthophoto) and surface slope, to explore their influence on clast movement. The surface slope was extracted at the July boulder position from the August DEM (resampled to 1 m cell size), to reduce the likelihood of the slope value being influenced by surface expression of the clast in the DEM data. To examine small-scale clast movement dynamics at the debris/ice boundary, clast tracking was repeated at a smaller scale over a region of debris-cover gain.
Results
Spatially continuous ablation
The high-resolution (0.04 m GSD) map of spatially continuous ablation is presented in Figure 3. The efficacy of the ‘ablation stakes as control points’ methodology is clearly demonstrated by the excellent visual correspondence of ablation with the surface cover shown in the orthophotos (Figure 3). Surface melt rates vary from c. 30 mm w.e. per day on areas of thick and continuous debris on the moraine crests to c. 60 mm w.e. per day on areas of partial debris cover. Thinner but continuous debris on moraine edges and cleaner ice within the inter-moraine area have slightly lower ablation rates of c. 50 mm w.e. per day.
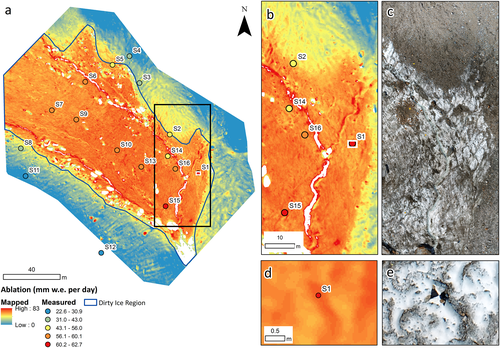
The highest melt rates of up to 65 mm w.e. per day occur along the supraglacial streams. Stream locations remained stable due to incision, shown by the narrow bands of high melt following the channels. Drainage lines in areas of complete debris cover are also observed as lines of increased ablation, which manifest as downslope-oriented stripes on the south-western moraine, a radial pattern in the central part of the north-eastern moraine, and an almost anabranching network on the moraine towards the east of the study site (Figure 3). These drainage lines represent the locations of sub-debris supraglacial streams, which can be observed emerging at the base of the moraines and in areas of thinner debris following the ablation patterns. Previous dye tracing and debris excavation revealed sub-debris streams/preferential flow paths under complete debris lower on the glacier (Fyffe et al., 2019). Increased ablation may be a result of heat transfer from the supraglacial stream water, or the local reduction in debris thickness due to the removal of debris by hydraulic action.
The influence of surface characteristics on dirty ice ablation
Percentage debris cover and ablation
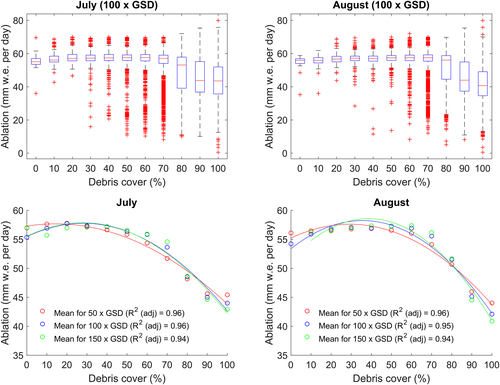
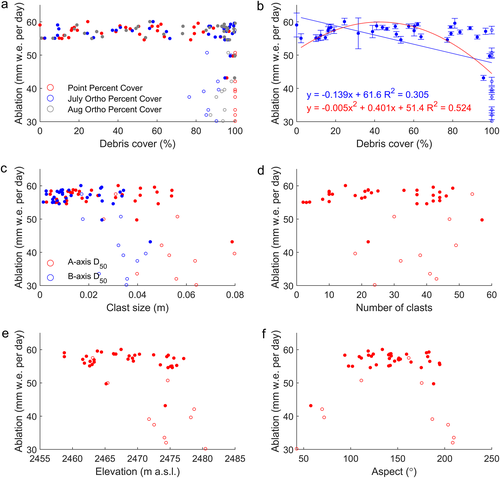
A surprising finding is the remarkably constant ablation across a wide range of percentage debris covers (Figure 4). A near-complete debris cover comprised of a layer of single clasts has an ablation rate similar to much lower percentage covers (e.g. QE with a 97% single-clast cover has almost the same ablation as QL with a 19% cover; Figure 4). At moderate percentage debris covers (c. 30–80%), ablation is enhanced compared to both the cleanest and more debris-covered ice, but there is no clear peak in melt rate where the enhancement is maximized. Melt rate values in the quadrat data range between 55 and 60 mm w.e. per day (mean 57.3 mm w.e. per day, σ 1.5 mm w.e. per day) (Figure 4). A similar pattern is also found in the continuous data (Figure 5), with ablation high but very similar where the debris cover is less than approximately 60%, and the variability in ablation within each 10% debris cover band being noticeably lower for moderate percentage covers.
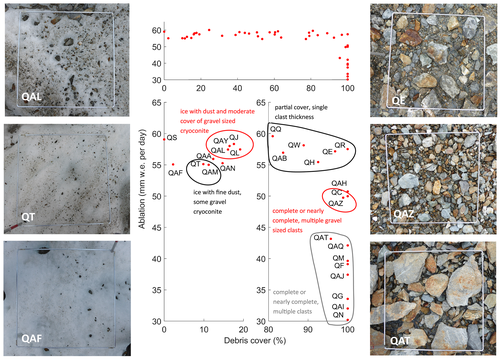
The quadrat data also show a very abrupt decrease in ablation when the debris cover is close to complete and, importantly, is multiple clasts thick (Figure 4). This can be quantified by comparing the mean ablation of the quadrats with a 30–80% cover (57.3 mm w.e. per day) with the mean ablation of the quadrats with a 100% cover (35.5 mm w.e. per day), giving a melt reduction compared to the partially covered quadrats of 61.6%. Ablation decreases as soon as the debris layer is multiple clasts thick, with quadrats with smaller clasts (and therefore likely thinner debris thicknesses) exhibiting higher ablation rates compared to those with larger clasts (see QAZ and QAT in Figure 4). This decrease in ablation when the cover becomes close to complete is not as abrupt in the continuous data, likely due to misclassification of lighter-coloured debris as ice (Figure 5).
When the percentage debris cover is very low (<15%), there is evidence that ice melts at slightly lower rates than in areas with a higher percentage debris cover (15 to ~80%). This is shown in Figure 4, where quadrats with point percentage debris covers up to 15% (QAA, QAF, QAM, QAN and QT; QS excluded as a stream-influenced ablation) have a mean ablation of 55.3 mm w.e. per day (range 55.0–55.9 mm w.e. per day). In contrast, quadrats with 15–20% cover (QAL, QAY, QJ and QL) have a mean ablation of 57.8 mm w.e. per day (range 57.4–58.3 mm w.e. per day) and quadrats with a 30–80% debris cover have a mean ablation of 57.3 mm w.e. per day (range 54.6–59.3 mm w.e. per day). If the 0–15% cover is taken as ‘clean ice’ and the 30–80% cover taken as ‘dirty ice’, the melt enhancement due to an incomplete debris cover is 3.7% compared to clean ice. The difference in ablation is small but measurable, given the RMSE of the continuous ablation map is 1.45 mm w.e. per day. As the percentage cover increases, the quadrat data show a gradual increase in melt rate, corresponding to an increase in clast size (from a mean A-axis D50 of 8 mm for the 0–15% group, to 12 mm for the 15–20% group and 23 mm for the 30–80% group). At low percentage covers, clasts tend to be thin enough to melt into the ice surface, with the intervening ice maintaining a white colour (and presumably high albedo) due to the formation of a weathering crust (Figure 4). The continuous data also show lower mean ablation at the smallest percentage debris covers (rounded to 0%) compared to mean ablation at moderate percentage debris covers (10–30% or greater) at 50× and 100× GSD (Figure 5). However, this pattern is not seen at 150× GSD (although there were only eight cells in the 0% group using the July orthophoto and none in August) (Figure 5).
The overall relationship between ablation and percentage debris cover (using the quadrat data shown in Figure 6b) is quadratic [R2 (adj) = 0.524, p < 0.01, excluding QS]. A negative linear relationship is also significant, but is not as strong [R2 (adj) = 0.305, p < 0.01, excluding QS]. This better fit of the quadratic relationship compared to the linear relationship lends confidence to the interpretation of lower ablation occurring at the smallest percentage debris covers, since the linear fit cannot describe the decrease in ablation at small percentage covers and is instead dominated by the low ablation of the quadrats with the highest percentage debris covers. A quadratic relationship also better describes the relationship between mean ablation and percentage debris cover for each 10% debris cover group using the continuous data (Figure 5). However, we note that the relative rarity of very clean ice in the continuous data, and the fairly small decrease in ablation measured in both the quadrat and continuous datasets, means that there is some uncertainty whether the cleanest ice really has a lower ablation than that with a moderate percentage cover.
The influence of clast size, clast thickness and albedo on ablation
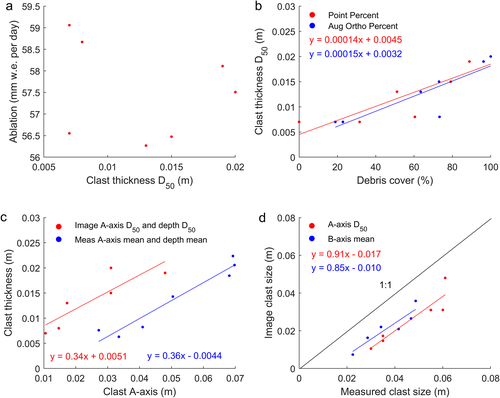
Ablation correlates significantly with clast size, albedo and elevation for all quadrats (column A, Table 2), but these relationships collapse when only partially debris-covered quadrats are included (Figures 6 and 7a, column B in Table 2). Therefore, none of these debris characteristics determines dirty ice ablation rates on its own. When completely debris-covered quadrats (which have larger clasts, lower albedo and higher elevations) are included, their lower ablation influences result (see Table 2). Albedo was found to negatively correlate with ablation of partially covered quadrats, but only if the quadrats included had a percentage cover less than 50% [r = −0.635, p < 0.05, R2(adj) = 0.329]. Measurements of clast thickness at seven quadrats revealed no significant relationship with ablation (Figure 8a), likely because of the differences in percentage cover and albedo.
| (A) Ablation of all quadrats | (B) Ablation of partially covered quadrats | (C) Albedo | |
|---|---|---|---|
| Percentage debris cover |
Point percentage* rs = −0.498, p < 0.01; R2(adj) = 0.312, p < 0.01 |
July ortho percentage rs = 0.134, p = 0.134 |
Point percentage rs = −0.811, p < 0.01; R2(adj) = 0.751, p < 0.01 (quadratic) |
|
July ortho percentage** rs = −0.631, p < 0.01; R2(adj) = 0.611, p < 0.01 (linear) |
|||
| Image clast size |
B-axis D50 rs = −0.390, p < 0.01; R2(adj) = 0.367, p < 0.01 |
A-axis D50 rs = 0.104, p = 0.564 |
B-axis mean rs = −0.774, p < 0.01; R2(adj) = 0.500, p < 0.01 |
| Number of measured clasts | rs = −0.110, p = 0.484 | rs = 0.095, p = 0.600 |
rs = −0.701, p < 0.01; R2(adj) = 0.571, p < 0.01 |
| Albedo |
rs = 0.461, p < 0.05; R2(adj) = 0.089, p = 0.096 |
rs = 0.258, p = 0.286 | |
| Elevation |
rs = −0.440, p < 0.01; R2(adj) = 0.236, p < 0.01 |
rs = −0.249, p = 0.149 | |
| Aspect | rs = −0.078, p = 0.609 | rs = −0.033, p = 0.849 |
- * The point percentage measure of percentage debris cover was the only measure which correlated significantly with ablation; note also that in these statistics QS was included.
- ** Higher correlations/regressions were found with the August orthophoto but since the albedo was measured in July, the relationships with the July orthophoto are given.
Determining clast thickness and albedo from imagery
Albedo and its relationship with clast size and percentage debris cover
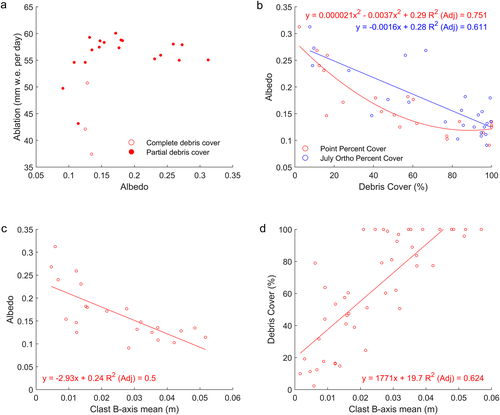
Albedo and percentage debris cover have a strong negative relationship (column C in Table 2 and Figure 7b). However, it is noteworthy that a second-order polynomial provides a stronger relationship between albedo and point percentage cover than a straight line [R2(adj) = 0.751 and 0.661 for a quadratic and linear relationship, respectively], demonstrating that the change in albedo is greatest at small percentage covers (~0–40%). As the percentage cover increases further, albedo declines more slowly. Albedo has a negative relationship with clast size (Table 2, Figure 7c). However, there is an important inter-relationship between percentage debris cover and clast size (Figure 7d), with the strongest correlation being between point percentage cover and mean B-axis (rs = 0.798, p < 0.01). The partial correlation between albedo and point percentage cover controlling for mean B-axis remains strong and significant (r = −0.567, p < 0.01), whereas the partial correlation between albedo and mean B-axis controlling for percentage cover becomes insignificant. The percentage cover is therefore the key determinant of albedo, rather than the clast size.
Determining clast thickness
Clast thickness is an important variable when simulating dirty ice melt (Evatt et al., 2015), which cannot be determined directly from either ground or aerial imagery. However, the field measurements of mean and D50 values of clast thickness within the quadrats (0.5 × 0.5 m) showed strong correlations with both measured and ground truth image clast size, with strong correlations also between clast thickness and percentage cover (Figure 8, Table 3). Clast thickness could therefore be inferred from either clast size or percentage debris cover at a 0.5 × 0.5 m scale.
| Image clast size (ground truth) | Measured clast size | Percentage debris cover | |
|---|---|---|---|
| Clast thickness |
A-axis D50 and thickness D50 r = 0.868, p < 0.05; R2(adj) = 0.691, p < 0.05 |
A-axis mean and thickness mean r = 0.966, p < 0.000; R2(adj) = 0.921, p < 0.01 |
Point percentage and thickness D50 rs = 0.955, p = 0.001; R2(adj) = 0.721, p = 0.01 |
|
August ortho percentage and thickness D50 r = 0.869, p < 0.05; R2(adj) = 0.707, p = 0.05 |
|||
|
Image clast size (ground truth) |
– |
A-axis D50 r = 0.925, p < 0.000; R2(adj) = 0.819, p < 0.01 |
– |
|
B-axis mean r = 0.927, p < 0.01; R2(adj) = 0.823, p < 0.01 |
Debris supply and remobilization
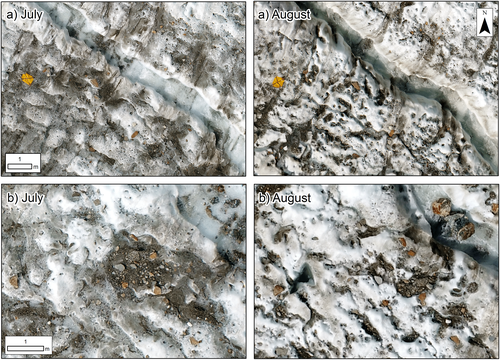
No overall increase in the percentage debris cover between July and August was detected. However, close inspection of Figures 9 and 10 reveals a pattern of ice surface evolution. Fine debris and melt-retarding clasts were washed into hollows and stream channels, increasing debris cover there. The location of the debris-trapping hollows in August matches with areas of higher percentage debris cover in the July imagery. Meanwhile, the intervening ice hummocks experienced a decrease in percentage cover, with clasts thin enough to melt into the ice forming cryoconite holes. Overall, the concentration of debris in the hollows increases while the intervening ice becomes cleaner, with the transverse crevasse traces becoming less distinct as a result (Figure 10). Primary supply of debris from melt-out of crevasse traces therefore has not resulted in a uniform increase in debris cover.
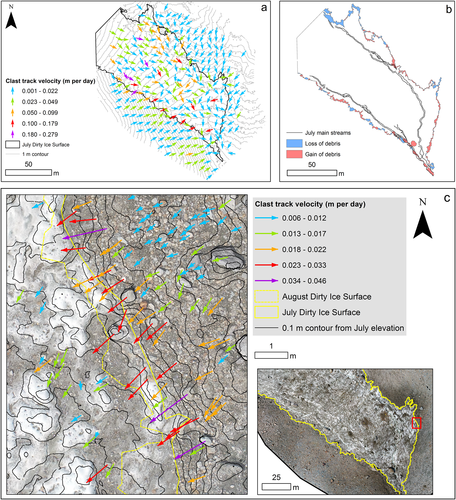
Clast feature tracking demonstrates that clasts move by different mechanisms in the debris-covered and dirty ice areas (shown in Figures 11a and 12). Clast velocity in the debris-covered area had a strong histogram mode (0.015 m per day, based on a 0.01 m per day bin size), with a similar median (0.016 m per day) and small standard deviation (0.026 m per day). Clast velocity is only very weakly influenced by slope [R2(adj) = 0.070], and moderately influenced by clast A-axis length [R2(adj) = 0.371]. These findings are consistent with a gradual downslope creep of the debris matrix, where clasts slide downslope due to gravity over the melting ice surface, but with their velocities impeded by their downslope neighbours. Small-scale clast feature tracking (Figure 11c) demonstrates the increase in clast velocity as clasts are released from the debris matrix and into the dirty ice area.
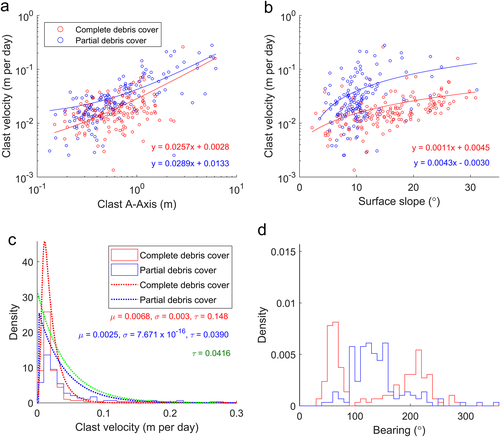
In the dirty ice area, the average clast velocity (0.042 m per day) was twice that in the debris-covered area (0.022 m per day) and had a larger standard deviation (0.047 m per day). However, the histogram mode (0.015 m per day) was the same as for the debris-covered area. The relationship between clast velocity and clast A-axis length is stronger than in the debris-covered area [R2(adj) = 0.526] and the slope has a greater (if still very weak) influence [R2(adj) = 0.132]. The greater clast velocities are not an artefact of sampling larger clasts in the dirty ice area, since Figure 12a shows that the clast velocity remains higher in the dirty ice area compared to the debris-covered area for a given clast A-axis length. This suggests clasts move via a topple-walk mechanism, whereby clasts retard ablation beneath them and build an ice pedestal, before sliding off this pedestal and coming to rest downslope. Larger ice pedestals will be formed by larger (and likely thicker) boulders, resulting in longer travel distances, explaining the relation of clast velocity with clast size. The more erratic slide direction evident in Figure 11a, compared to on the debris-covered slopes, is further evidence of this movement mechanism.
Debris creep from moraine slopes supplies material to the dirty ice area. However, there are areas of debris loss as well as debris gain along the moraine margins. Overall, 284 m2 of debris-covered area became dirty ice, whereas 342 m2 of dirty ice area became debris-covered, resulting in a net gain of 58 m2 of debris cover (Figure 11b). The mean debris gain distance (calculated from the minimum bounding rectangle for each area of gain or loss) was 1.26 m, equating to a rate of change of 0.035 m per day, similar to the debris clast velocities measured through feature tracking. The mean debris loss distance was 1.01 m, equating to 0.028 m per day. The loss of debris is caused by stream erosion removing debris during floods, since areas of gain and loss were found along the south-western medial moraine, whose margin is close to the main western stream, whereas debris was consistently gained along the margin of the south-eastern moraine which is far from any streams. Note that by August the branch of the eastern stream closest to the north-eastern moraine had been diverted further west.
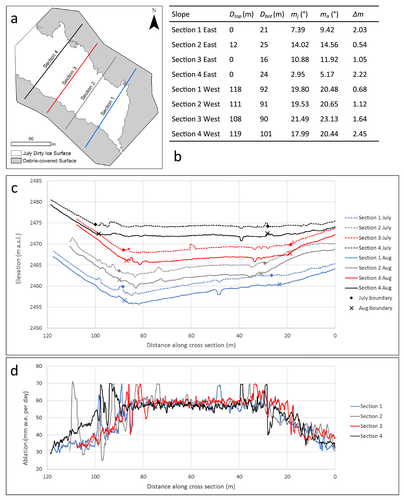
Faster melting of dirty ice resulted in a greater lowering of this surface compared to the debris-covered moraine slopes (Figure 13), with a consequent increase in the gradient of the moraine slopes over time (by 1.5° on average). This increase in gradient decreased with distance down-glacier, except for section 1 of the eastern slope. An increase in slope gradient could be caused by an increase in ablation with distance downslope, which is evident in Figure 13d. This suggests that the debris thins with distance down the moraine slopes.
Discussion
Understanding ablation in dirty ice areas
The high-resolution ablation map gives a new insight into the melting of partially debris-covered ice (Figure 3). There is some evidence that only the cleanest ice (less than ~15% debris cover) has lower ablation than partially debris-covered ice. This may explain why some studies (Hagg et al., 2008; Brook et al., 2013) did not detect enhanced ablation beneath a thin debris cover: their ‘clean ice’ may not have been sufficiently free of debris. A slight covering of cryoconite (similar to QAL in Figure 4) or a layer of dust on the surface (Adhikary et al., 2000) would be enough to enhance ablation compared to completely clean ice. The initial increase in ablation with percentage debris cover up to ~20% is due to an increasing cover of small clasts which decrease albedo. At low percentage debris covers, albedo decreases most sharply with increasing cover (Figure 7b) and there is an inverse relationship between albedo and ablation (Figure 7a). Under moderate covers (~30–80%) ablation is remarkably constant, and it is inferred that this is due to the contrasting role of albedo and clast size. As the percentage debris cover increases, albedo is reduced (Figure 7b), which is known to increase ablation by increasing the net shortwave radiation received by a surface (Brock et al., 2000). However, simultaneously the clast size tends to increase (Figure 7d), corresponding to thicker clasts which are likely to reduce ablation, given the known reduction in ablation with increasing debris thickness (e.g. Østrem, 1959, 1965).
The quadrat data showed that melting reduces significantly as soon as the debris cover becomes close to complete and multiple clasts thick (Figure 4). Østrem curve theory suggests that very thin debris covers enhance ablation compared to clean ice (Østrem, 1959). However, a thin continuous cover which increased ablation compared to clean ice was rarely observed. Instead, partial debris cover enhanced melting compared to clean ice, but melting reduced as soon as the debris cover was near complete (which seemed to correspond to a layer multiple clasts thick). This suggests that the ‘patchiness’ approach devised by Reid and Brock (2010) holds promise, since many of the characteristics of their modelling were also displayed in the data collected (debris thickness increased with percentage debris cover following an exponential delay function, and albedo also decreased with percentage cover).
Providing a basis for modelling melt in dirty ice areas
The field data provide a basis for simulating dirty ice ablation. Percentage debris cover has been determined successfully from orthophotos using a maximum probability classification, although the spectral signatures of ice and debris do overlap. More complex methods, such as object-based image analysis (e.g. Kraaijenbrink et al., 2016), could be employed instead. A strong relationship between albedo and percentage debris cover allows albedo to be derived from mapped percentage debris cover, although it could also be determined directly from orthophoto brightness (following Corripio, 2004). Clast thickness correlates strongly with both percentage debris cover and clast A-axis, meaning that it could be estimated from percentage debris cover or clast size distribution maps. Clast size has been derived for river environments from both point cloud roughness and image texture (Carbonneau et al., 2005; Woodget and Austrums, 2017; Woodget et al., 2017). If this methodology were applied to dirty ice environments, it would allow clast size (and therefore clast thickness) to vary independently of percentage cover. This might be useful for modelling, as it would allow situations such as smaller clasts forming a near complete cover to be modelled correctly.
Mapping spatially continuous ablation using ‘ablation stakes as control points’ could revolutionize the validation of spatially distributed melt models. Testing models against a map of ablation will give a clear picture of where they are performing successfully or not. The map (Figure 3) highlights the importance of supraglacial streams on ablation, including hidden sub-debris streams. Melt models do not routinely include melting along supraglacial stream courses, but this phenomenon could be significant to overall melt volumes.
Ice surface and debris cover evolution
The detailed analysis of clast movement and surface change presented contributes to a coherent understanding of the glaciological and slope processes leading to debris cover formation and evolution, as shown in Figure 14. Primary debris supply to the dirty ice area is from the melt-out of crevasse fills and dispersed englacial debris. Debris released from crevasse traces is rapidly remobilized by melt and rainwater and concentrated into hollows and streams (Figure 10). Downslope clast movement from moraine flanks provides debris to the margins of the dirty ice area. Overall, there was a net gain of debris along the moraine/dirty ice margins, but locally, removal of debris also occurs.
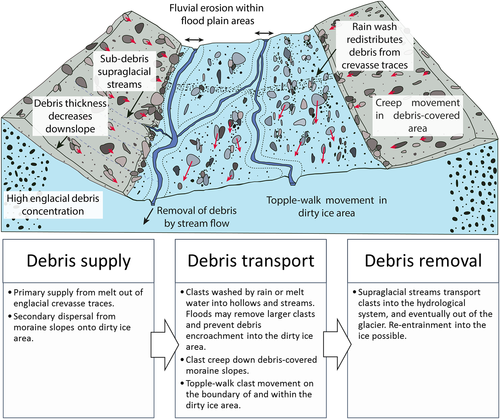
In models of debris cover evolution (Anderson, 2000; Rowan et al., 2015; Anderson and Anderson, 2016), ablation rate and englacial debris concentration determine the rate of supraglacial debris accumulation. Mechanisms of debris removal from the surface are not accounted for: such models conserve debris until it either reaches the margins or the glacier tongue becomes stationary. Observations at Miage Glacier show that rainfall and meltwater remove fine debris from the dirty ice surface and wash clasts from ice hummocks into hollows. Overbank flows in supraglacial streams will remove clasts from their adjacent ice surfaces (Figure 14). Debris entrained by surface streams will be transported through the supraglacial–englacial–subglacial stream network to eventually leave the glacier, although some may return to glacial transport (e.g. Kirkbride and Spedding, 1996). Future modelling of debris cover evolution should therefore account for loss as well as gain of supraglacial debris, especially in transitional areas of high melt and partial debris cover. This could be incorporated in a simple manner (e.g. by applying that a fraction of debris gained on an ice surface is lost to the hydrological network), but more work is needed to quantify the importance of hydrological transport within the debris–glacier system.
The transition from a partial to a complete debris cover not only reduces ablation, but also reduces the removal of the fine fraction of the debris. Fine debris trapped within a complete cover is less likely to be removed, since any rain or meltwater will be forced to travel slowly through the debris matrix. The fines fraction affects the debris thermal conductivity and moisture content, which are likely to differ markedly from a single clast layer. At the study site, a continuous debris cover is caused mainly by the encroachment of debris from moraine slopes, rather than by melt-out of englacial debris. This contrasts with nearby Glacier d'Estelette, where transverse debris bands have a high rate of debris emergence, sufficient to cause complete debris cover formation (Kirkbride and Deline, 2013). This difference is explained by the location of the Miage Glacier study site, which although below the ELA, is relatively high in the ablation area. Kirkbride and Deline (2013) found that debris outcrop emergence was enhanced down-glacier for reasons including slower ice flow and shallower, more closely spaced debris septa.
Analysis of the clast velocities suggests that clasts travel down moraine slopes by creep (slow continuous sliding) processes, whereas clasts within the dirty ice area move by the topple-walk mechanism (see ‘Debris supply and remobilization’ and Figure 14). Anderson (2000) modelled topple-walk movements down moraine slopes. Although this was observed on the margins and within the dirty ice area, this mechanism was not observed on the debris-covered moraine slopes where there is no differential ablation or boulder table formation. Future modelling work should therefore adjust the movement mechanism, depending on the surface type. The modal clast velocity values and velocity distributions from Miage Glacier provide a basis for simulating clast velocities in future work.
Although Moore (2018) focuses on modelling the location of debris instability rather than all mass movement mechanisms (including creep, which does not require instability), the prediction of movement down the face of moraine slopes and hydraulic erosion in the valleys between moraine ridges do agree qualitatively with our data. Moore's (2018) analysis assumes a constant debris thickness, inconsistent with the decrease in debris thickness found with distance down the moraine slopes (Figure 13d). However, Moore's (2018) Z value (the ratio of debris transmissivity to meltwater supply rate) becomes smaller (equating to greater instability) as the debris thickness decreases, which may explain the increase in clast velocities near the moraine toe (Figure 11). Equally, however, these faster velocities could be explained by local destabilization at the foot of the slope (due to fluvial erosion or debris thinning reducing the buttressing effect of the debris matrix on the upslope debris), which invalidates the assumption of negligible longitudinal forces in the infinite slope analysis (Moore, 2018).
The increase in ablation downslope in Figure 13d implies that the debris thickness decreases downslope, causing a gradient in ablation. The downslope thinning of the debris cover may be the result of debris transfer to the dirty ice area at the foot of the slope and/or higher debris supply rates near the moraine crest. The gradient in ablation down the moraine slope causes the moraine to steepen over time (Figure 13). This process of moraine steepening exemplifies the ‘waxing’ stage of medial moraine development of Small and Clark (1974), a morphological response to differential ablation between the debris-covered moraine and adjacent clean ice. In contrast, these results do not agree with Anderson (2000), in which the medial moraine slope angle and down-slope debris thickness were prescribed constant values. Anderson's (2000) modelled moraine slopes therefore grew inward, increasing the debris cover at the expense of clean ice. Future models of moraine evolution should therefore include a down-slope decrease in debris thickness.
Future recommendations
The above analysis results in a series of recommendations for future modelling of ablation and debris cover evolution. Spatially continuous ablation maps constructed by the ‘ablation stakes as control points’ methodology would provide an excellent validation dataset for distributed ablation models. Distributed modelling of dirty ice ablation is clearly possible, since percentage debris cover can be determined from the classification of UAS orthophotos, with albedo relating strongly to the percentage debris cover. Mean clast thickness can be determined from mean clast size, which can be found from percentage debris cover, although clast size could be determined separately via other methods (e.g. point cloud roughness or image texture; Carbonneau et al., 2005; Woodget and Austrums, 2017; Woodget et al., 2017) if it was required to vary separately from percentage debris cover in the modelling regime. The consistent increase in ablation across debris covers from 30 to 80% could allow a simpler modelling approach whereby these areas are identified and ablation enhanced uniformly relative to clean ice. Results from plot scale studies, where clean ice is artificially loaded with debris of different thicknesses to infer its influence on melt rate, should be interpreted with caution. In reality, thin debris covers are rarely continuous and the interactions between albedo, percentage debris cover and clast size/thickness, which have an important impact on melt rate, may be neglected.
The clast velocity statistics for the dirty ice (median 0.025 m per day) and debris-covered areas (median 0.016 m per day), or the exponentially modified Gaussian distributions found, could be used in future models of debris cover evolution. It is also clear that different debris movement mechanisms should be applied for different surface covers. Moraine slopes are also likely to have a downslope decrease in debris thickness. The loss of debris from the dirty ice surface due to stream erosion results in not all debris transported to the ice surface contributing to debris cover creation. Future work is necessary to quantify the percentage loss of debris to the glacier hydrological system.
Conclusion
Detailed analysis of repeat UAS-SfM ortho-imagery and DEMs acquired over an area of dirty ice has provided a unique insight into the influence of a partial debris cover on ablation and the processes of debris movement and cover formation. It was found that very high-resolution (0.04 m GSD), accurate (RMSE 1.45 mm w.e. per day) and spatially continuous maps of ablation can be produced by combining repeat UAS imagery with field measurements of the horizontal and vertical components of glacial flow (the ‘ablation stakes as control points’ methodology). The resulting ablation map was of a high enough quality to distinguish patterns of ablation attributed to variations in percentage debris cover and the influence of sub-debris streams.
A traditional Østrem curve approach, where ablation is related to debris thickness, is not appropriate for regions with a partial debris cover under high melt conditions, because of the complex inter-relationships between clast thickness, clast size, percentage debris cover and albedo. These inter-relationships result in ablation remaining remarkably consistent (quadrat ablation ranged from 54.6 to 59.3 mm w.e. per day) across a range of percentage debris covers (30–80%). This consistency is likely due to the competing effects of albedo and clast thickness: albedo decreases with an increase in percentage debris cover (increasing ablation), meanwhile clast size (which correlates with clast thickness) increases with percentage cover (decreasing ablation). However, there is evidence that partially debris-covered ice had higher ablation (by 3.7%) than the cleanest ice (<15% debris cover). This initial increase in ablation with increasing percentage debris cover is due to a decrease in albedo. Conversely, when the debris is multiple clasts thick and forms an almost continuous cover, ablation decreases by 61.6% compared to a partial cover. The completion of the debris cover is therefore a key threshold, because the subsequent trapping of finer debris will result in further changes to the thermal conductivity and moisture properties of the layer.
Analysis of clast movement and debris cover change between surveys revealed that debris is transferred down moraine slopes to dirty ice areas via creep processes, producing areas of debris gain at the moraine–dirty ice margin. Areas of debris loss also occurred due to stream water erosion. In the dirty ice area, debris travels across the ice surface via a topple-walk mechanism. Debris emerging from fine transverse crevasse traces was redistributed by melt and rainwater into hollows and streams in the dirty ice area. Ablation increased down the moraine slopes, implying a downslope decrease in debris thickness, which is the likely cause of the progressive steepening of the moraine slopes over time.
Acknowledgements
We would like to thank the British Society for Geomorphology for funding this work and the NERC Geophysical Equipment Facility (loan 1087) for providing the loan of two GNSS receivers. The authors are also grateful to Gwilym Luckett (employed through the University of Worcester VRAS scheme), John Barrow (supported by the University of Worcester), Amelia Andrews and Fiona White for their invaluable help in the field. We also thank the team of the Fondazione Montagna Sicura for their assistance during the August field trip. We are grateful to an anonymous reviewer and Ann Rowan for their helpful and constructive comments on the manuscript.
Conflict of Interest
The authors declare no conflict of interest.
Open Research
Data Availability Statement
The datasets produced and analysed during the current study are available at 10.5281/zenodo.3749317. Reasonable requests to access the data will be granted by the corresponding author.


