Experimental investigation of the impacts of coherent flow structures upon turbulence properties in regions of crescentic scour
ABSTRACT
This study examines the spatial distributions of third-order moments of velocity fluctuations, the turbulent kinetic energy (TKE) fluxes, and the conditional statistics of Reynolds shear stress across the equilibrium crescentic scour structures generated upstream of short horizontal static cylinders. Detailed velocity data were collected using three-dimensional (3D) micro-acoustic Doppler velocimeter (ADV) across and within the equilibrium scour marks. The analysis reveals that the positive and negative values of third-order moments associated with the level bed surface and the scour holes are directly related to coherent structures. The components of TKE flux are discussed for the near-bed region of the level bed surface and scour holes in relation to sweep–ejection events. A cumulant-discard method is applied to the Gram-Charlier probability distribution of two variables to describe the statistical properties of the term u′w′. The conditional statistics of the Reynolds shear stress show a good agreement with the experimental data. The distribution of the joint probability density function in the near-bed region changes cyclically along the scour hole depending on the bottom fluid velocity, which implies a change from upward to downward flux of momentum and vice versa. Both the ejection and sweep events at near-bed points on the level surface are more important than within the scour region; and in contrast, both events are stronger for the scour marks than the level bed surface at the outer layer. Sweeps dominate over ejections for the scour hole induced by smaller diameter and ejections dominate for larger diameter. Copyright © 2013 John Wiley & Sons, Ltd.
Introduction
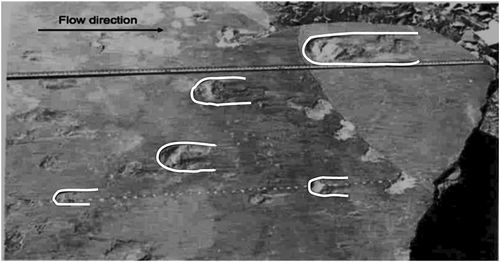
When flow of water passes around immovable objects or obstacles like shells, pebbles or wood fragments placed on a sandy bed, scour marks around the obstacle usually result from the interaction of the local flow field with the sediment bed. The object/obstacle restricts the flow in the stream channel developing the excavation of sand on the upstream side of the object accompanied by a series of vortices downstream. A crescentic type scour trough commonly develops around the obstacle with its deepest part on the upstream side and the tail pointing downstream, and consequently the eroded materials from the upstream are deposited downstream. Obstacles immersed on the boundary of a flow induce eddies, like horseshoe vortices causing frontal scour that influence the level of turbulence. The larger obstacle, the more turbulence is generated and the more energy is absorbed causing retardation of the flow. In general, the flow across a bluff body is itself a complex phenomenon, and this complexity is further enhanced due to the scour mark generated by individual natural body/obstacle placed on the erodible bed. Investigations have been made to quantify the scour depths, and the mean flow across the scour marks generated by different types of bluff bodies/obstacles placed on non-cohesive sand beds (Kirkil et al., 2008; Kirkil and Constantinscu, 2010; Mazumder et al., 2011; Euler and Herget, 2011, 2012). In depositional sedimentary structures, scour holes may be termed obstacle marks or comet marks and used as an indicator of palaeo-current direction (Dzulynski and Walton, 1965; Sengupta, 1966, 2007; Karcz, 1968; Melville, 1975; Johansson, 1976; Werner et al., 1980; Allen, 1982; Collinson and Thompson, 1982; Bhattacharya, 1993). For example, Figure 1 shows the current crescents in the bedding plane of ancient sedimentary structure. The formations of crescentic scour marks are clear in cross-bedded sediments depending on the orientation and plunge of the long axes of the pebbles / bluff bodies.
In order to understand the basic mechanisms of formations of crescentic scour marks, Sengupta (1966) carried out field experiments placing pebbles on the loose sand bed in a recent stream to form a replica (Sengupta 1966, figure 4; Collinson and Thompson, 1982), to estimate ancient flow conditions in the light of modern analog. Kjeldsen et al. (1973) developed scour holes in a laboratory setup. They concluded that the equilibrium scour depth was dependent on both the geometry and the flow velocity, and then proposed a formulation to determine the equilibrium scour depth based on the velocity and the cylinder diameters. Werner et al. (1980) made field observations and flume experiments on the nature of comet marks. Field observations suggest that the comet marks are observed typically in shallow seas and these are obstacle-induced. Flume experiments were also performed to study the flow characteristics in the wake of obstacle marks. In his study, Mao (1986) performed laboratory experiments to measure the time-scale, size and shape of scour marks in a steady current and under waves. He proposed that two small vortices, one at the upstream and one at the downstream of the cylinder, remove sediments from the area around the cylinder.
Extensive investigations relevant to a variety of scientific disciplines have been made over the last few decades in laboratory settings under controlled conditions on the scour holes around vertical cylinders or piers embedded in sediment beds (Melville, 1975; Melville and Raudkivi, 1977; Raudkivi and Ettema, 1983; Darghai, 1989; Melville and Chiew, 1999; Graf and Istiarto, 2002; Sheppard et al., 2004; Ettema et al., 2006; Unger and Hager, 2007; Debnath et al., 2012), underwater pipelines (Sumer and Fredsoe, 2002a, 2002b) and around abutments (Kwan and Melville, 1994; Ahmed and Rajaratnam, 2000; Dey and Barbhuiya, 2005; Dey et al., 2008). Local scour around short/finite horizontal cylinders placed in non-cohesive sediment beds have also been investigated (Voropayev et al., 1999, 2003; Sengupta et al., 2005; Cataˇno-Lopera and Garcia, 2006, 2007; Cataˇno-Lopera et al., 2007; Mazumder et al., 2011, Maity et al., 2013).
The problems of scour around and subsequent burial of short horizontal cylinders placed on a sandy bed under progressive waves were studied by Voropayev et al. (2003). The motivation of their study was to observe possible scour and burial effects of cylindrical objects in coastal environments, where non-linear progressive waves play a significant role. Sengupta et al. (2005) performed flume experiments to generate the crescent-shaped scour marks using horizontal short cylinders placed in a sandy bed for a possible verification of field observations in a recent stream (Sengupta, 1966). They found the positive correlation between the flow velocity and the scour-width irrespective of cylinder diameter and sand size. Cataˇno-Lopera and Garcia (2007) investigated experimentally the geometry of the scour hole and the flow structure around short cylinders under the action of wave alone and combined wave and current. Their experimental evidence showed that both width and length of the scour hole generated due to the short cylinder primarily depends on the Keulegan–Carpenter number KC (= um Tw /Dc) and the aspect ratio ( L/Dc ), where um is the maximum velocity, Tw is the wave period, Dc is the cylinder diameter and L is the length of the cylinder. Their study was aimed at understanding the dynamics of pipelines and short cylinders placed on a sandy bed under the action of oscillatory flows, which occurs in shallow water regions of coastal area.
Recently, Mazumder et al. (2011) presented the mean flow and turbulence characteristics associated with nearly equilibrium scour geometry developed around a static short cylinder placed over a sand bed transverse to the flow. They reported the processes of evolution of scour marks around the objects using a digital camera. Results showed that the width of the scour hole depends on the cylinder Reynolds number  , the densimetric Froude number
  and the cylinder aspect ratio
  , where ν is the kinematic viscosity, g is the acceleration due to gravity, d50 is the median particle diameter, and γs is the specific gravity of the sediment. The Fs is a measure of the ratio of tractive force acting on the sand bed particle to the submerged specific weight of the particle. They apparently showed that for a fixed value of Fs ranging from 3.5 to 6.0, dimensionless scour-width
  increases with increase of Rcyl; and proposed a relation for dimensionless scour-width
  as a function of Dc and Fs, where ws is the width of the scour hole. Subsequently, Maity et al. (2013) developed a statistical model for spatio-temporal evolution of scour width around short cylinders due to fluid flows.
However, in spite of considerable success in the study of scour around piers, cylinders or abutments, no attempts have been made to investigate the turbulence statistics and coherent flow structures over and within the frontal scour hole developed due to short horizontal cylinders or obstacles, where horseshoe-like vortices cause the frontal scour. Laboratory investigations have indicated that the turbulent flow across the deepest part of frontal scour marks is associated with intermittent large-scale coherent flow structures. The influence of strong eddies upon flow within the scour structure has not been considered, including linkages between the turbulent kinetic energy (TKE) budget, conditional statistics and the Reynolds shear stress. Brodkey et al. (1974) provided a unifying terminology for turbulent bursting events: ejections, sweeps, inward and outward interactions; and their statistics have been analyzed for a variety of flows over different conditions, e.g. experiments in open-channel flow (Nakagawa and Nezu, 1977; Nelson et al., 1995; Hurther and Lemmin, 2000; Venditti and Bauer, 2005; Hurther et al., 2007; Ojha and Mazumder, 2008; Mazumder et al., 2009), in wind-tunnel (Raupach, 1981), under an-ice boundary layer (Fer et al., 2004), in atmospheric boundary layers (Katul et al., 1997, 2006; Sterk et al., 1998), and scour around vertical circular cylinders (Kirkil et al., 2008; Debnath et al., 2012). In turbulent boundary layers, coherent structures with large flux events have been proposed to explain the ‘bursting’ phenomena responsible for most turbulence production, hence mixing, through two types of motions described as ejections and sweeps (Cantwell, 1981; Robinson, 1991). These events are identified by conditional sampling through quadrant analysis (Lu and Willmarth, 1973).
The present study aims at understanding the turbulence, third-order moments of velocity fluctuations, the TKE fluxes, and the fractional contributions of burst–sweep cycles to the Reynolds shear stress over and within the equilibrium crescentic scour holes that form around short horizontal static cylinders. More precisely, how the TKE fluxes and conditional shear stress statistics vary within and across the deepest part of the equilibrium frontal scour is considered. It hitherto remains unclear whether the quadrant dynamics are locally affected by scour marks or it merely reflects the results of previous studies for standard smooth- and rough-wall flows. The study of scour marks around the objects on the sandy bed under the action of turbulent flows in natural environments has the potential to be useful to researchers who consider the dynamics of pipelines and short cylinders placed on river-beds, sea-beds and shallow water regions of coastal areas (Voropayev et al., 1999, 2003; Sumer and Fredsoe, 2002a, 2002b); and who examine the formations of crescentic scour marks in a recent stream (Sengupta, 1966, 2007) to establish palaeo-current directions. Therefore, in the present study, the use of submerged horizontal short cylinders justifies the design of experiments for understanding the physics of fluids around the objects. The quadrant threshold technique is used for direct estimation of observed data of conditional statistics of Reynolds shear stress for three crescentic scour depths and level surface; and subsequently, a theoretical model of probability density function of momentum flux variable (Nakagawa and Nezu, 1977; Raupach, 1981) is employed to verify the threshold technique. The theoretical model shows good agreement with the experimental estimates.
Experimental Setup and Procedure
Laboratory facility
Experiments were conducted in a re-circulating ‘closed circuit’ laboratory flume (Mazumder et al., 2005) especially designed at the Fluvial Mechanics Laboratory (FML) of the Physics and Earth Science Division, Indian Statistical Institute, Calcutta. Both the experimental and the re-circulating channels of the flume have identical dimensions of 10 m length, 0.50 m width and 0.50 m height. The flume walls were made of Perspex windows over a distance of 8 m. One centrifugal pump providing the discharge was located outside its main body. The outlet pipe was fitted with a by-pass and a valve, so that the discharge was adjusted to a desired velocity. An electromagnetic discharge meter with digital display was fitted with the outlet pipe to facilitate continuous monitoring. The inlet and outlet pipes were freely suspended from an overhead structure to allow tilting of the flume. The upstream end of the channel was divided into three sub-channels of equal dimensions, and a honeycomb cage placed at each end of the sub-channels to ensure smooth, vortex-free uniform water flow.
Experiments
To perform the tests, a plane sand bed of known grain-size distribution having a thickness h′ = 0.04 m and 5 m long covering the entire width (0.50 m) of the flume was prepared at the bottom (Figure 2). The d50 value of the sand was 0.25 mm and the standard geometric deviation σg = 0.685. The γs of sediments was 2.65. The water depth was kept constant at Hw = 0.3 m from the flume base for all the experiments. The effective flow depth was h = Hw – h' = 0.26 m. The flow discharge Q = 0.015 m3/s was chosen in such a way that the bottom shear stress was below the threshold value for sediment movement, i.e. when there was no sediment transport at the bed, which indicated clear water scour conditions (Raudkivi, 1976; Raudkivi and Ettema, 1983). The hydraulic slope of the flume was negligible, and of the order of 0.0001. The vertical velocity profiles were taken at three different horizontal locations at the flume central line using a SonTek 5 cm down looking three-dimensional (3D) micro-acoustic Doppler velocimeter (ADV) for three minutes (180 seconds) at a sampling rate of 40 Hz to ensure fully developed flow over the plane bed surface (without the obstacle). Since the fluid contained lots of particulate matter of size of the order of micron, the transmitted pulses from the ADV were backscattered by the particulate matter in water within the transmitter acoustic beams, and hence the ADV measured the fluid velocity fluctuations. The sampling volume of ADV was located 5 cm below the transmitter probe and the precise distance depends on the individual probe geometry. The ADV is a high precision piece of equipment that measures all three components of velocity with fluctuations. The sampling volume is approximately cylindrical oriented along the transmitter beam axis. It has a diameter equal to that of the 6 mm ceramic of the transmitter, and the vertical length is 3.2 mm. The size of the sampling volume of 16 MHz ADV is 0.09 cm3. Factory calibration of the ADV is specified to be 1.0% of the measured velocity (i.e. an accuracy of 10 mm/s on a measured velocity of 1000 mm/s).
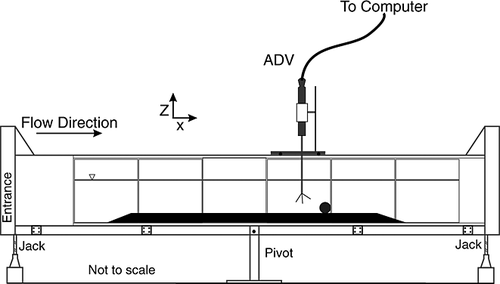
The velocity data were collected at several vertical positions starting from the lowest level 0.35 cm above the bed level surface and the highest level at about 18 cm for each profile for the flow Reynolds number  and the Froude number
  , where um is the maximum fluid velocity and ν is the kinematic viscosity of fluid. No measurements near the free surface were made in the present study. The ADV data were processed to remove spikes using a phase space threshold despiking method described by Goring and Nikora (2002). The velocity data were analyzed for all three horizontal locations and found almost no change amongst the results of those velocity data. The dimensionless stream-wise mean velocity profile
  over the plane bed surface exhibited a log-law up to flow depth about 18 cm from the sand bed (Figure 3), where u* = 1.451 cm/s is friction velocity determined from the log-law.
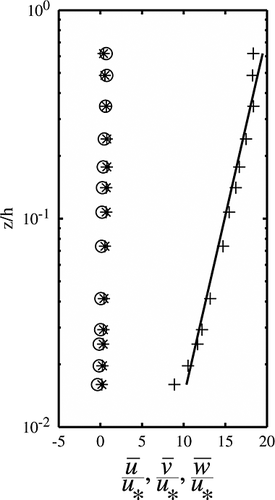
 , ∘ for
  and ∗ for
  .
.Yang et al. (2004) and Absi (2011) reported that the velocity dip phenomenon, the position where the maximum velocity appears below the water surface, occurred even if the aspect ratio of the channel width to water depth was less than a certain value about six. Yang et al. (2004) showed from the analysis of several researchers' data that the dip phenomenon appeared for narrow channel even for smaller aspect ratio around 2.0. Cardoso et al. (1989) attributed the dip phenomenon to weak secondary currents. According to Long et al. (1990) and Tachie et al. (2004), a two-dimensional flow in the central portion of the flume was achieved with width/depth ratio (≈ 2). Since in the present study the width/depth ratio was ≈ 2.5 with the occurrence of maximum velocity at the flow depth δ ≈ 20 cm, it could be ascertained the two-dimensional flow at the central portion at the flume, and hence the effect of secondary currents on the flow is negligible. Therefore, it was ensured that the flow was free from the secondary currents at the central line of the flume. The quantitative evidence of lateral and vertical mean velocity profiles  throughout the depth is shown in Figure 3.
A series of experiments was conducted at the laboratory by placing individually short static horizontal cylinders of different diameters Dc and fixed length L on the sand bed with their axis transverse to the flow at the centerline of the flume. For each experiment, a cylinder was placed over the smooth sand bed at a distance 600 cm downstream of the channel inlet (see Figure 2). The length of the cylinder was shorter than the width of the channel and hence flow was essentially 3D. Though the flow discharge Q = 0.015 m3/s was not sufficient to reach the threshold value of the bottom shear stress far away from the cylinder, at the vicinity of the cylinder it was sufficiently strong to cause sediment motion. In fact, no bed forms, such as, ripples and dunes were observed in the stream-wise direction on the sediment bed except in the area of local scour and deposition around the cylinder/obstacle. The discharge was kept undisturbed to form a scour structure at upstream of the cylinder, and eventually after a certain time, it attained nearly equilibrium condition in the scour mark around the short cylinder. Formation of scour marks upstream of the cylinder showed a crescentic scour structure, which is morphologically akin to the current crescent preserved in geological record (Sengupta, 1966, 2007). During the process of evolution of scour marks at the upstream edge due to blockage in the flow, the geometry of the structure was recorded at an approximately equal interval of time using a digital camera (Mazumder et al., 2011; Maity et al., 2013). It may be noted that two basic forms of erosion took place around obstacles − bluff erosion, which occurred at the upstream side of the obstacle caused by an eddy formation; and lee erosion occurred at the downstream side of the obstacle with turbulent wakes at the both ends. A partial burial of the cylinder was observed during the process of evolution of the scour mark to the equilibrium state, but the effect of burial was not considered in this study. During the collection of velocity data after the equilibrium state, no burial effect was observed.
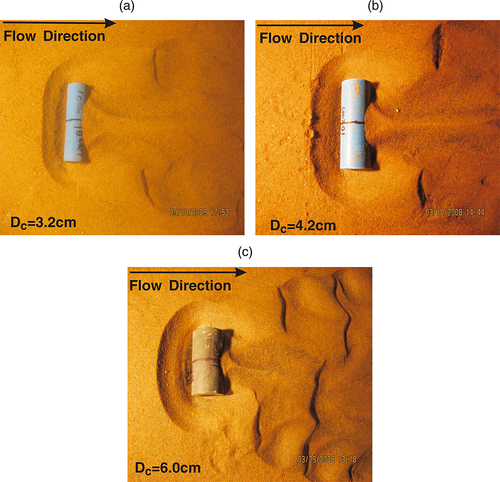
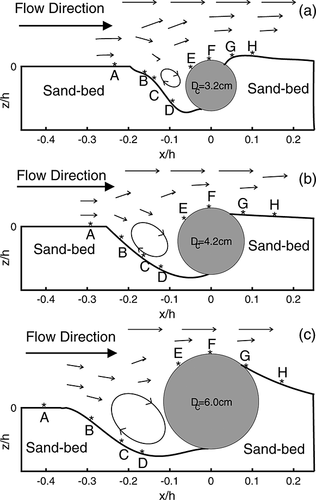
Altogether, 38 experiments were conducted at identical settings for different discharges ranging from 0.011 to 0.022 m3/s using eight different cylinder diameters of fixed length. A near equilibrium scour mark was attained after a couple of hours with a development of bedform structures downstream of the short cylinder. The scoured structure seemed to reach a nearly steady state in size and shape. This was confirmed by critically observing the size and shape of the scour mark continuously running the flume for a longer period of time (about 500 minutes) even after reaching a steady state, which showed very little change in the size and shape of the mark. From the visual observations and then measurements, it was ascertained that there were no further effects of the cylinder-induced to the scour-hole. The photographs of nearly equilibrium scour holes developed in the upstream sides for three different cylinder diameters (Dc = 3.2, 4.2, and 6.0 cm) with fixed length (L = 10 cm) at different times te = 178, 195, and 300 minutes respectively are reproduced (Figure 4). The velocity data along the vertical lines across and within the equilibrium scour mark from upstream to downstream at the flume centerline were recorded using ADV for three minutes (180 seconds) at the same sampling rate. During the collection of velocity data, burial effects were almost negligible. The schematic diagrams of scour marks with measuring locations (A, B, C, …, H) for all three different cylinders are shown (Figure 5). Using the similar filtering technique of Goring and Nikora (2002), the velocity data were analyzed. The ranges of flow parameters used for the experiments conducted over three cylinder diameters (Dc = 3.2, 4.2, and 6.0 cm) are provided in Table 1. For this paper, only these three cases are discussed.
| Dc (cm) | ar | Q × 10−2 (m3/s) | um (cm/s) |  |
Fs |  |
ws (cm) |
|---|---|---|---|---|---|---|---|
| 3.2 | 0.32 | 1.472 | 26.63 | 0.167 | 4.19 | 69238 | 3.5 |
| 4.2 | 0.42 | 1.472 | 26.20 | 0.164 | 4.12 | 68120 | 4.5 |
| 6.0 | 0.60 | 1.472 | 26.45 | 0.166 | 4.16 | 68770 | 6.5 |
Experimental Results
Mean velocity components and turbulence characteristics
The velocity data were primarily collected along the vertical lines at an upstream location A away from the cylinders/obstacles on the centerline of the flume above the plane sand bed surface. The time averaged velocity components in (x, y, z) directions are represented by  , where x, y and z are the horizontal, lateral and vertical coordinates respectively. Examination of velocity data at A on the plane surface away from each cylinder diameter reveals that the stream-wise mean velocity profile
  followed the log-law up to flow depths about 18 cm from the sand bed, and the lateral and vertical mean velocity profiles
  , were almost zero throughout the depth. The turbulence intensities
  ,
,  along the x and z directions matched well (Nezu and Rodi, 1986; Clifford, 1998; Ojha and Mazumder, 2008, 2010; Mazumder et al., 2009). Therefore, a reasonable uniformity in the flow was observed under the given flow conditions. Subsequently, collected velocity data were analyzed along the horizontal direction at all different locations B to H across the nearly equilibrium scour holes. The analysis identified the spatial changes of distributions of mean flows
  , turbulence intensities
  ,
,  ; and the Reynolds shear stress
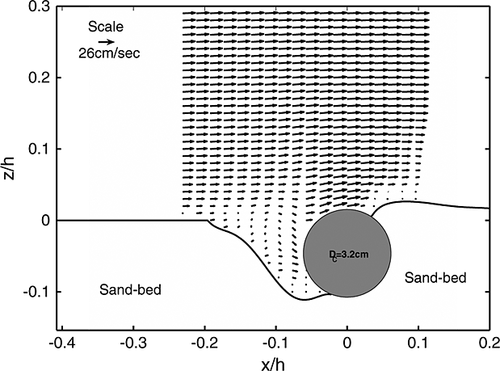
  associated with the scour hole structures; and facilitated a comparison with different cylinder diameters (Mazumder et al., 2011). They observed that the logarithmic velocity distribution was not applicable close to the cylinders upstream or downstream. Moreover, the velocity distributions deviated significantly from the log-law within the scour holes. The flow reversal occurred at the scour holes due to the formation of horseshoe vortices causing frontal scouring at locations C and D (close to the cylinder) and resulting in flow instability in the near-bed region. The measuring location D was as close as possible to the obstacle or cylinder. Within the scour holes, the vertical mean velocity component
  was directed downward for the small cylinder diameters, while
  was directed upward for the large diameter of the cylinder (Dc = 6.0 cm). The change in direction of
  along the vertical depth implied a circulation within the scour holes. Thus, vertical mean velocity
  played an important role within the scour holes. The mean velocity vector plot along the uw-plane surface over the scour hole due to cylinder diameter Dc = 3.2 cm is reproduced in Figure 6 for clearer view of recirculation region. The turbulence intensities
  and
and  are discussed (Mazumder et al., 2011). It was also noted that the turbulent shear stress (τ0bl) at the level surface (z/h = 0.018) along the horizontal direction is always higher than the bottom shear stress (τ0) at the scoured region (z/h = −0.080). The overall trend of Reynolds shear stress was negative at the bottom surface of the scour holes resulting in the outward flux of momentum and to positive values at the level surface resulting in the inward flux of momentum.
Third-order moments of velocity fluctuations
The third-order moments provide a measure of skewness, which is an important criterion for measuring the degree of symmetry of the distribution of velocity fluctuations with respect to mean velocity components. The positive or negative values of skewness represent the useful statistical information of the distributions, in terms of right or left tails respectively. The coefficients of skewness in the directions of u and w are defined as  and
and  ; and these are computed across the scour marks from the location A to H. From the definitions of skewness of the velocity fluctuations along stream-wise and vertical directions, they may be interpreted as the fluxes of the Reynolds normal stresses of u′ and w′ respectively. The third-order moment is sensitive to the occurrence of burst–sweep cycles and turbulent flux contributions (Nagano and Tagawa, 1988); and hence it is directly related to coherent structures through turbulence characteristics (Gad-El-Hak and Bandyopadhyay, 1994).
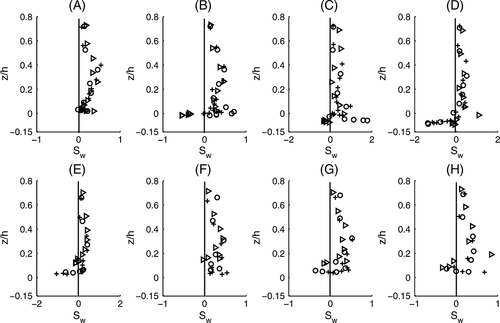
The distributions of the skewness coefficient Su of u are plotted against the normalized vertical coordinate (z/h) in Figure 7 across the equilibrium scour holes generated by the cylinder diameters (Dc = 3.2, 4.2, 6.0 cm) along the locations A to H. The distributions of skewness coefficient Sw of w are plotted in Figure 8 for all identical parameters. Figures 7 and 8 show the variations of skewness of u and w respectively across the scour holes from the location A (at the bed level surface) to the location H (downstream from the cylinder). At location A, the skewness Su starts with negative values with ≈ −0.05 near the bed and reaches to zero at the mid-depth (z/h = 0.5), and then almost zero throughout the depth. At the locations C and D (within the scour marks), Su is initially positive near the scoured beds, then changes to negative at the level bed surface (z/h = 0.018). At location B near the edge of the scour, Su starts with positive values for Dc = 4.2 cm and negative values with ≈ −0.5 for Dc = 3.2, 6.0 cm and again approaches to zero at the level z/h = 0.5. At the locations E and F above the cylinders, Su starts with negative values near the boundary and reaches almost zero at the level z/h = 0.5; and at locations G and H (on the deposited materials), first it is positive near the bed and changes to negative with zero at the level z/h = 0.1. It is interesting to note that the values of Su at the locations B and G are scattered in nature, which is due to the edges of the boundary. It seems that the change in Su is observed only within the region (z/h ≤ 0.5), while in the region z/h > 0.5, the Su is almost zero.
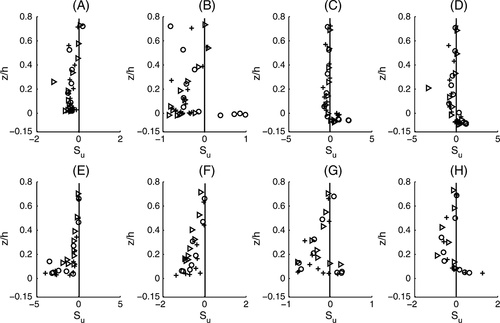
At location A, a negative value of Su is observed within the level 0 < z/h < 0.05 representing the arrival of low-speed fluid streaks from the bed, i.e. occurrence of ejection events. At the locations B, C, and D, positive Su occurs at the near-bed region of scour marks indicating the occurrence of high-speed fluid streaks at the bottom, i.e. occurrence sweeping events. Within the equilibrium scour holes, occurrence of high-speed fluid close to the bottom up to the level surface z/h = 0.018 and the low-speed fluids away from the level surface are observed, which is similar to surface roughness effect in the turbulent boundary layer structures (Keirsbulck et al., 2001). The arrival of low-speed fluid streaks generated from bed resistance is associated with the inward interactions, while arrival of high-speed fluid streaks is associated with outward interactions. Similar results are also seen at G and H downstream of the cylinders.
Figure 8 shows that within the region below z/h < 0.05 the variation of the skewness factor Sw along the stream-wise direction is qualitatively almost similar to Su with a change of sign. Within the scour or recirculation region at B, C, and D, the skewness Sw is initially negative at near boundary and zero at the level z/h = 0.0, then again it is positive throughout the depth with approaching zero at the free surface. It may be clearly noted that the magnitude of Sw close to the free surface remains non-zero, which shows ejection events persist at a greater distance from the wall. Here the positive and negative values of Sw indicate respectively the dominance of ejection (low-speed fluid streaks) and sweep (high-speed fluid streaks) events; and opposite results are obtained for positive and negative values of skewness Su. The variation with the cylinder diameters leads to almost similar skewness for both components.
Stream-wise and vertical fluxes of turbulent kinetic energy (TKE)
The stream-wise and vertical fluxes of TKE are defined as  and
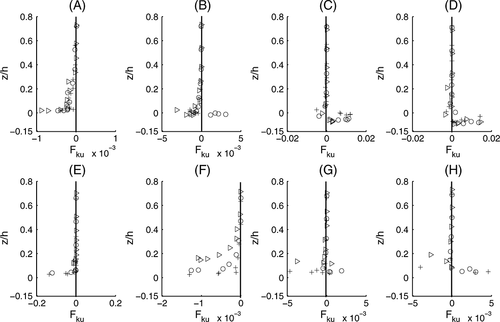
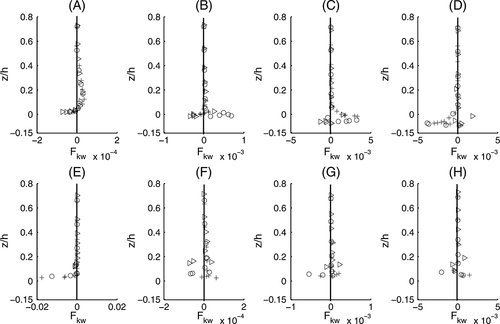
and  respectively. The vertical profiles of Fku and Fkw are plotted against the normalized distance z/h in Figures 9 and 10 respectively from the location A to H across the scour holes generated by different cylinder diameters (Dc = 3.2, 4.2, 6.0 cm). Both the fluxes of Fku and Fkw along the flow direction vary only near the boundary, changing sign up to the level z/h ≈ 0.1 for the locations B, C, D, and E over the scour holes; and above the level z/h ≥ 0.1, both the fluxes are approximately zero except location A at the smooth surface. At the locations B, C, and D below the bed level (z/h = 0.0), i.e. within the scour hole regions, both the components of energy flux show fluctuations with positive and negative values. The negative and positive values of the flux Fku lead to the transport of energy in the backward and forward directions respectively; and these are related to the ejection–sweep character of the Reynolds stress. Within the scour region, negative values of Fku indicate energy transport in the upward direction from the near-bed region, and the negative values of Fkw indicates the transport of energy downward. It is also observed from the figures that the vertical distributions of Fku shown in Figure 9 are qualitatively similar to those of Fkw in Figure 10 with higher magnitude.
Quadrant Analysis of Reynolds Shear Stress
 . Systematic variation of the hole size H allows the interpretation of contributions to the total Reynolds shear stress. If <> denotes a conditional average, we have
 (1)
(1) (2)
(2) (3)
(3) (4)
(4) (5)
(5)The coherent structures which are observed in the present experiments are the vortex structures generated by the interaction of the incoming flow with the scour mark and the cylinder. Therefore, the perturbation in the flow field alters the ejection and sweep events, and thus it is necessary to study the conditional statistics of Reynolds shear stress.
Theoretical Modeling
 , and
, and  . Considering the joint probability function of
  and
and  by
by  , its characteristic function by χ(α,β) with the moment of
  by mst and corresponding cumulant qst, the characteristic function χ(α,β) can be defined as:
 (6)
(6) can be written as
 (7)
(7) (8)
(8) (9)
(9)Here  is the Gaussian distribution for two variables and
  is a Hermite polynomial of order (s + t). Equation 8 represents a joint probability density distribution of the Gram-Charlier type in bivariate case.
 and using the change of variables, the probability distribution
  of τn is given by
 (10)
(10) is the correlation coefficient.
 denote the probability distribution of the ith event, the total probability distribution
  is the sum of all events as:
 (11)
(11) (12)
(12) (13)
(13) (14)
(14) (15)
(15) (16)
(16)Verifications with Experimental Data and Discussions
The above theoretical model allowed us to compute the conditional probability distribution of Reynolds shear stress by making the use of the cumulant expansion method for two variables  and
and  to predict the contribution of each event to the total Reynolds stress. This analysis was performed only at the locations A (bed level surface) and D (in scoured region close to the cylinder) along the flow over and within the scour geometry to estimate the effect of scour marks generated by cylinder diameters (Dc = 3.2, 4.2, 6.0 cm) on the contributions of events to the Reynolds shear stress. It was noticed that the contribution of sweeping event was more important than that of ejection to the Reynolds stress close to the rough surface (Nakagawa and Nezu, 1977). Since the theoretical model for the stress fraction Si,H was derived from the Joint probability density
  , and the probability distribution of normalized Reynolds stress
  , it would be worthwhile to elucidate details of the probability density distribution.
Joint probability density function of stream-wise and vertical velocity components
The contours of  computed from Equation 8 are drawn at location A (bed level surface) at three different heights (z/h = 0.018, 0.154, 0.269) in Figure 11; and at location D (close to the cylinder) within the scour mark generated by Dc = 3.2 cm at heights (z/h = −0.08, 0.018, 0.269) in Figure 12. Figure 11 shows that as the height increases from the smooth bed surface (near-wall) to the outer layer, there is little change of pattern from the triangular shape to the circular, whereas Figure 12 shows a drastic change of pattern from the bottom to the outer layer. At the bottom surface z/h = − 0.080 (below the bed level surface), the contours of
  are ellipsoid, inhabiting the ejection and sweeping events. As the vertical distance increases from the bottom to the outer layer (z/h ≥ 0.018) the ellipse-type contour describing the second and fourth quadrants changes to a circular contour which equally favors all four quadrants. The symmetry about the origin of the
  -plane corresponds to the wake-interference roughness regime (Papanicolaou et al., 2001). In the outer layer above the level bed surface (z/h ≥ 0.018), the contour pattern is almost identical.
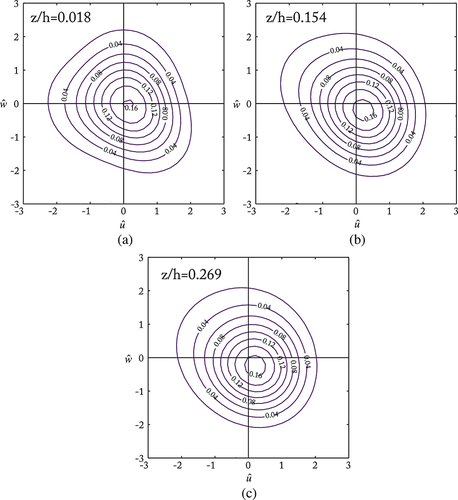
 at three different heights at the location A on the smooth surface for the case Dc = 3.2 cm. This figure is available in colour online at wileyonlinelibrary.com/journal/espl
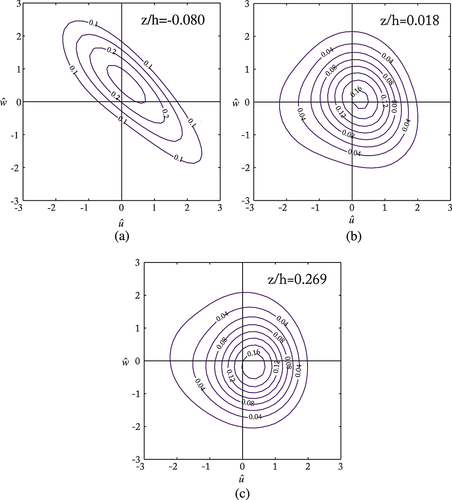
 at three different heights at the location D (close to the cylinder) within the scour region generated by the cylinder diameter Dc =3.2 cm. This figure is available in colour online at wileyonlinelibrary.com/journal/espl
The contours of  are plotted for all three cylinder diameters (Dc = 3.2, 4.2, 6.0 cm) at the level bed surface (z/h = 0.018) of location A (smooth surface) in Figure 13; and at the same level (z/h = 0.018) in location D (close to the cylinder) within the scour hole in Figure 14. Figure 13 shows that the contours of
  are almost triangular in shape and independent of cylinder diameters, that means, there are no effects of scour holes generated by different Dc values. The contours occupy all the four quadrants almost uniformly (Figure 13). In Figure 14, as the cylinder diameter (Dc) increases, there is a clear shift of contours from the triangular shape to ellipse for Dc = 6.0 cm occupying the most favored quadrants – ejection and sweep implying the downward flux of momentum (Strom and Papanicolaou, 2007). Eventually, an increase in cylinder diameter leads to an increase in scour hole width and hence enhancement of turbulence.
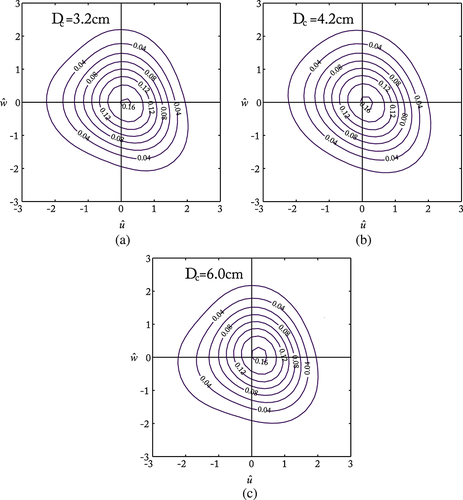
 for three different cylinder diameters (Dc =3.2, 4.2 and 6.0 cm) at the location A (smooth surface) at the level surface z/h = 0.018. This figure is available in colour online at wileyonlinelibrary.com/journal/espl
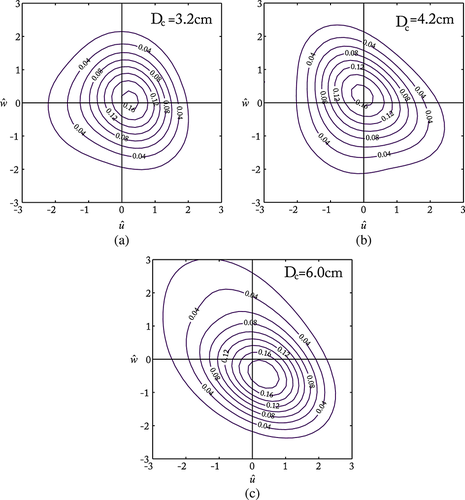
 at three different cylinder diameters (Dc =3.2, 4.2 and 6.0 cm) at the location D (scour region, close to the cylinder) at the bed level surface z/h = 0.018. This figure is available in colour online at wileyonlinelibrary.com/journal/espl
The theoretical curves of  , given by Equation 8 using Gram-Charlier type of bivariate case are shown in Figure 15 at the near-bed points of all eight locations A to H across the equilibrium scour mark generated by Dc = 3.2 cm. It is clearly observed that at location A on the smooth level surface, the density function has a bivariate Gaussian distribution. As the horizontal distance increases from A to H along the scour hole, the distribution of
  deviates from the Gaussian curves. At location B at the edge of the sour hole, the distribution is found within the inward and outward interaction quadrants implying the upward flux of momentum, whereas at locations C and D (close to the cylinder) within the scour region, it is found within the ejection and sweep quadrants implying the downward flux of momentum. Again at locations E and F on the cylinder and location H on the deposited materials, the distribution represents the upward flux of momentum and at location G (on the ridge) it shows the downward flux of momentum. The prominent deviation of the distribution takes place at locations C and D within the scour mark, and at location E on the edge of the cylinder. Thus it is observed that the orientation of the theoretical curves of joint probability density function changes cyclically with the horizontal distance depending on the local velocity structures. The
  have its maximum value about 0.25 at location E on the positive side of
  and minimum peak is 0.05 at locations C and G.

 at eight different locations A to H along the flow for Dc = 3.2 cm at the bed surface. This figure is available in colour online at wileyonlinelibrary.com/journal/espl
Probability density function of normalized Reynolds shear stress
The measured and computed values of  of normalized Reynolds shear stress τn are plotted in Figures 16a and 16b for Dc = 3.2 cm at the locations A (smooth level surface) and D (close to the cylinder). It is noted from Figures 16a and 16b that the probability density of τn calculated from Equation 12 agrees fairly well with experimental data at both locations A and D for all three heights. At location A on the smooth level surface, the distribution profiles of
  are almost identical for all heights (Figure 16a), whereas at D within the scour region, peak of the distribution profile decreases with the increase of vertical height (Figure 16b). In fact, the maximum peak occurs at the near-bed (z/h = −0.080) within the scour region. It may be noted that τn= 0 has singularity at the origin.

 against τn for Dc = 3.2 cm. (a) At location A on the smooth surface: ◦ (· −), z/h = 0.018; + (- -), z/h = 0.158; ⊳(-), z/h = 0.269. (b) At location D (close to the cylinder) within the scour region: ◦ (· −), z/h = −0.080; + (- -), z/h = 0.018; ⊳ (-), z/h = 0.269. Here dot-dash, dash and solid lines represent the theoretical value. This figure is available in colour online at wileyonlinelibrary.com/journal/espl
Figures 17a and 17b present the plots of computed and measured values of  against normalized Reynolds shear stress (τn) for the locations A and D at a level surface z/h = 0.018 for different values of Dc = 3.2, 4.2, 6.0 cm. It is found that the probability density of τn calculated from Equation 12 shows fairly good agreement with observed values for both locations A and D. At location A on the smooth level surface, the profiles of
  of normalized τn are almost identical at near-bed level z/h = 0.018 for all cylinder diameters (Dc) (Figure 17a), while at location D within the scour mark, peak of the distribution increases with increase of Dc at the same height z/h = 0.018 (Figure 17b).

 against τn at the level surface z/h = 0.018. (a) At location A: ◦ (· −), Dc = 3.2 cm; + (- -), Dc = 4.2 cm; ⊳ (-), Dc = 6.0 cm. (b) At location D: ◦ (· −), Dc = 3.2 cm; + (- -), Dc = 4.2 cm; ⊳ (-), Dc = 6.0 cm. Here dot-dash, dash and solid lines represent the theoretical value.
Conditional statistics of Reynolds stress
Contributions of the stress fraction |Si,H| to the Reynolds shear stress are estimated from the velocity data collected in the presence of Dc = 3.2 cm. The stress fraction |Si,H| is plotted against the threshold parameter H for each of the four quadrants at the location A on the level surface at three different heights (z/h = 0.018, 0.158, 0.269) in Figure 18a; at location D within the deepest part of the equilibrium scour hole at the levels (z/h = −0.080, 0.018, 0.269) in Figure 18b; and at location H above the deposited materials (on the ridge) for different heights (z/h = 0.040, 0.158, 0.269) in Figure 18c. It is observed that the quadrant-wise estimates of the Reynolds shear stress from the velocity measurements: outward interaction (Q1), ejection (Q2), inward interaction (Q3), sweep (Q4) are fairly in good agreement with theoretical values calculated from Equation 14.
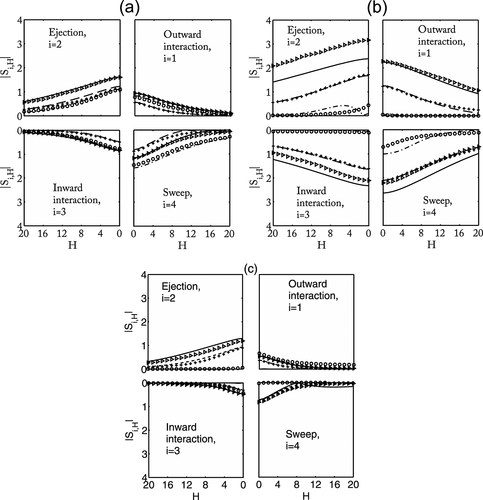
At location A on the smooth level surface, sweep events (Q4) are greater than ejections (Q2) near the boundary at z/h = 0.018 (Grass, 1971; Nakagawa and Nezu, 1977; Raupach, 1981), whereas away from the boundary (outer region) at heights z/h = 0.158, 0.269, ejections dominate over sweep events (Lopez and Garcia, 1999; Hurther and Lemmin, 2000). It may be noted that in the quadrant Q2, the strength of ejection increases with increase in the vertical distance from the near-bed surface, and the events in the other quadrants are more irregular. However, both the interactions – outward and inward are almost identical for all heights (Figure 18a). At the near-bed level z/h = 0.018 for H = 8, the contributions from the quadrants are S1,8 = −0.340, S2,8 = 0.557, S3,8 = −0.345, S4,8 = 0.874, the sum of them is 0.750, which is 75% of average shear stress τ; and at the level z/h = 0.158 for H = 8, the contributions from the quadrants are S1,8 = −0.169, S2,8 = 0.654, S3,8 = −0.140, S4,8 = 0.262, the sum is 0.607, which is 61% of average shear stress τ.
At location D (close to the cylinder) in the scour region due to Dc = 3.2 cm, sweep events (Q4) are more important than ejections (Q2) from the bottom to the level bed surface (z/h < 0.018), but above the level (z/h > 0.018), Q2 > Q4, i.e. ejection events are more important than sweeps in the outer region of the main flow (Figure 18b). At location D within the scour region, the contribution to |Si,H| for a fixed threshold parameter H from all four quadrants increases with increase of vertical distance, whereas at location A on the level surface, the similar phenomenon occurs only for ejection event (Q2), but magnitudes of stress fraction in other three quadrants first decrease and then increase with z/h. For example, at the level z/h = −0.08 for H = 8, the contributions from the quadrants are S1,8 = −0.000, S2,8 = 0.087, S3,8 = −0.070, S4,8 = 0.272, the sum of which is 0.289, i.e. 29% of average shear stress τ. At the level z/h = 0.018 for H = 8, the contributions from the quadrants are S1,8 = −0.699, S2,8 = 1.234, S3,8 = −1.193, S4,8 = 1.576, the sum of which is 0.918, i.e. 92% of average shear stress τ. At the level z/h = 0.269 for H = 8, the contributions from the quadrants are S1,8 = −1.843, S2,8 =2.801, S3,8 = −1.670, S4,8 = 1.621, the sum of which is 0.909, i.e. 91% of average shear stress τ.
At the interface of sweep and ejection events, kolk–boils occur (Ojha and Mazumder, 2008), which are observed to appear at the lee side of waveform structures in the river environments. An upward tilting stream-wise vortex in the river flows is known as kolk; and the circular or oval shape structures known as boils move-up to the water surface and merge with the surroundings (Nezu and Nakagawa, 1993). The geometry of the scour mark starting from the edge looks like a lee side of dunes. The flow separates at the ridge of the scour hole resulting in the formation of vortices, hence the occurrence of kolk–boils phenomenon at the scour marks (Venditti and Bauer, 2005).
At location H on the deposited material behind the cylinder, ejection events (Q2) are more important than the sweep events (Q4) away from the boundary for heights z/h = 0.158, 0.269, while near the boundary at z/h = 0.041, both ejection and sweep events are almost negligible. The outward interaction (Q1) is much more important than the inward interaction (Q3) near the boundary at z/h = 0.041, while away from the boundary at heights z/h = 0.158, 0.269, both outward and inward interactions are almost identical with negligible value at higher threshold parameter H. For example, at the level z/h = 0.075 for threshold parameter H = 8, the contributions from the quadrants are S1,8 = −0.019, S2,8 = 0.0755, S3,8 = −0.008, S4,8 = 0.111, the sum of which is 0.16, i.e. 16% of average shear stress τ. At the level z/h = 0.269 for H = 8, the contributions from the quadrants are S1,8 = −0.154, S2,8 = 0.722, S3,8 = −0.123, S4,8 = 0.201, the sum of which is 0.65, i.e. 65% of average shear stress τ. Moreover, the sum of contributions of all quadrant events increases with increase in height z/h > 0.018 for threshold parameter H > 0.
It is interesting to note that for a fixed Dc = 3.2 cm and threshold parameter H = 0, contributions to |Si,0| i = 1, 2, 3, 4 from all four quadrant events at the near-bed region (z/h = 0.018) are larger on the level bed surface at location A than the near-bed level (z/h = −0.08) within the scour region at location D. However, contributions from all four quadrants to the stress fraction at the outer layer z/h > 0.018 on scour hole at location D are larger than the outer layer on the level surface at location A (Figures 18a and 18b). The results were consistent with the results of Krogstad et al. (1992), who indicated that in the outer layer over a rough surface, contributions from second (Q2) and fourth (Q4) quadrants to the Reynolds shear stress are greater than on the smooth surface, considering the reduction of mean flow velocity within the scour hole as analogous with the velocity over the rough surface. The overall trend of these plots shows that the contributions of ejections and sweeps to the shear stress at all concerned locations (A, D and H) away from the wall are much higher than that of inward and outward interactions. It is observed from Figure 18b that the typical characteristic of all quadrant events at levels z/h = 0.018, 0.269 is a much longer tail with the threshold parameter H compared with the all quadrants events at near-bed level (z/h = −0.08). It also seems that the contributions of ejections and sweeps to the shear stress at location D away from the wall are much higher than that of other locations (A and H), which means that the sweep and ejection events provide extraction of energy from the circulation to generate more turbulence at location D. Furthermore, the tails of all quadrant events in D appear longer with the parameter H than in the case of the locations A and H.
The contributions of |Si,H| to the Reynolds shear stress at the level surface z/h = 0.018 for different cylinder diameters (Dc = 3.2, 4.2, 6.0 cm) are plotted against the threshold parameter H for each of the four quadrants in Figure 19a for location A, and in Figure 19b for location D in the scour region. At both locations A and D theoretical and experimental values agree fairly well except for Dc = 6.0 cm at location D. At location A on the smooth surface level in the near-wall region (z/h = 0.018), the sweep events of Q4 dominate over ejection in Q2 for all the cylinder diameters (Dc = 3.2, 4.2, 6.0 cm), whereas Q3 > Q1 for Dc = 6.0 cm and Q3 ≈ Q1 for Dc = 3.2, 4.2 cm. On the one hand, at location D within the scour hole at surface level (z/h = 0.018), sweep events are more important than ejection events for the diameters Dc = 3.2, 4.2 cm, and reversed for the larger diameter Dc = 6.0 cm. On the other hand, inward interactions (Q3) are more important than outward interactions (Q1) for the threshold parameter H and for all Dc values. At location D within the scour region, it is interesting to note that the both sweep and inward interactions to |Si,H| for fixed H decrease with increase of cylinder diameter Dc at the level z/h = 0.018, whereas at location A on the smooth surface level, all the events to stress fraction |Si,H| decrease for Dc = 3.2, 4.2 cm except for Dc = 6.0 cm. Moreover, it is interesting to note that at location D (close to the cylinder) at the surface level z/h = 0.018, the sum of contributions of all quadrant events decreases with increase of Dc for the threshold parameter H > 0, whereas the mean shear stress τ at that level increases with Dc.
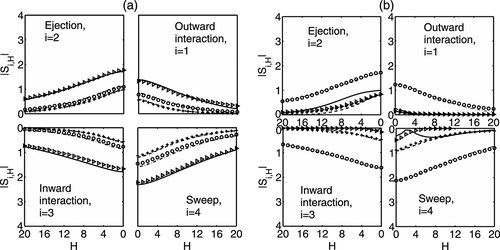
From the observations it is revealed that at the near-bed (surface level) z/h = 0.018 and threshold parameter H = 0, contributions of all four quadrant events to |Si,0| i = 1, 2, 3, 4 for Dc = 3.2 cm are larger within the scour region for Dc = 3.2 cm at D than that on the locations A and H; whereas contributions of all quadrant events for Dc = 4.2, 6.0 cm at the same level z/h = 0.018 on scour hole at location D are less than that on the smooth surface at location A (Figures 19a and 19b). The wider scour holes generated by larger cylinder diameters Dc = 4.2, 6.0 cm may act as diffusive agents. It is observed that the interaction components (outward and inward) were each smaller in magnitude than either ejection or sweep contributions at all levels, which implies that the downward flux of momentum is much more significant than the outward flux of momentum (Figures 18 and 19).
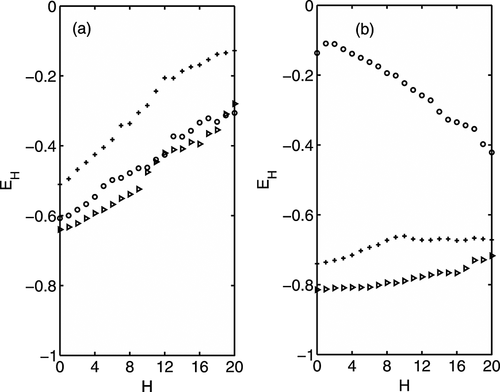
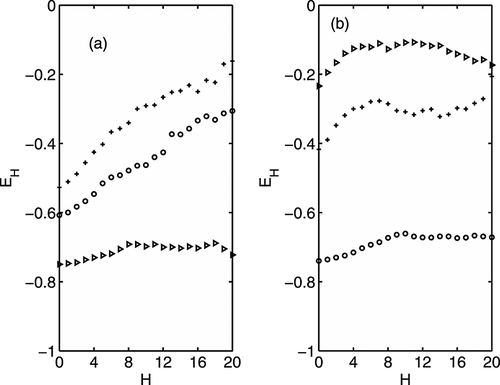
Figures 20a and 20b show the plots of  given by Equation 17, the ratio of upward to downward transport of momentum, against the threshold parameter H for various vertical heights at location A on the level surface (Figure 20a) and at location D within the scour region (Figure 20b) for Dc = 3.2 cm. It is worthwhile to note that the ratio EH increases and then decreases with vertical height for fixed H at location A on the smooth surface level, whereas the ratio EH decreases consistently with z/h at location D (close to the cylinder) in the scour region. At location A on the surface level, EH increases with H, while at location D within the scour region, EH decreases with H at the bed level z/h = −0.080, and it slightly increases (almost constant) with H at the levels z/h = 0.018, 0.269. At the near bed level, the ratio | E0 | for H = 0 at location A is much higher than that at location D, while at the levels z/h = 0.018, 0.269, the ratio | E0 | at location D is higher than that at location A. For fixed Dc and H, the decrease of | E0 | at location D with z/h implies the decreasing importance of inward and outward interactions (Figure 20b). The similar plots are also shown in Figures 21a and 21b against H for different cylinder diameters (Dc = 3.2, 4.2, 6.0 cm) at the surface level z/h = 0.018 at two different locations A and D. It is observed that ratio EH increases and then decreases with cylinder diameter (Dc) for a fixed H at location A on the surface level (Figure 21a), while the ratio increases with Dc at the level z/h = 0.018 at location D within the scour region. For fixed z/h = 0.018 and H, the increase of ratio with diameter Dc at location D within scour hole implies the increase of importance of inward and outward interactions (Figure 21b).
Conclusions
The purpose of this study was to describe the turbulent flow statistics over and within the crescentic scour holes induced at the upstream of a horizontal short cylinder placed over the sandy bed transverse to the flow. The velocity data were analyzed to examine the variation of mean flows, second- and third-order moments, the TKE fluxes, and the turbulent events associated with burst–sweep cycles and their fractional contributions to the Reynolds stress across the scour holes developed by different cylinder diameters. The region of recirculating flow at the upstream face of the cylinder was dominated by multiple vortices and pockets of high TKE. Two separated flow regions at the ends of the cylinder and a ridge of deposited materials at the centerline were observed. The observations revealed that the perturbations to the flow field due to the scour hole altered physical parameters significantly. The following results and conclusions may be drawn.
The turbulent shear stress at the smooth bed level surface along the flow was higher than the bottom shear stress at the scoured region. The third-order moments of the velocity fluctuations were sensitive to the occurrence of burst–sweep cycles, and hence it was directly related to coherent structures through the turbulence characteristics within the scour holes.
Within the scour holes up to the smooth level bed surface, both the components of turbulent energy flux showed fluctuations with positive and negative values, which were related to ejection–sweep character. At the outer layer above the smooth level surface, both the fluxes were approximately zero except location A at the level surface. An interesting observation was that the vertical distributions of energy flux Fku along u-direction was qualitatively similar to the energy flux Fkw with higher magnitude.
In the scoured region, the existing theoretical model of joint probability density function  using Gram-Charlier type deviated from the Gaussian distribution. The contour plots at the near-bed points of all locations from upstream to downstream confirmed the variations from triangular shape to ellipse and back. It was interesting to note that the orientation of the contour changed cyclically from quadrant to quadrant depending on the bottom shear stress.
In the quadrant analysis, the conditional statistics of the Reynolds stress along the stream-wise direction across the scour holes could be well represented by a third-order cumulant discard Gram-Charlier distribution. We confirmed that the probability distribution of the Reynolds stress described the experimental results fairly well. Therefore, the experimental data are used to analyze the turbulent statistics and to predict the trend of coherent phenomena of flow over and within the scour holes generated by the objects/cylinders, which have not been studied before.
The study of scour marks around the objects over the sandy bed under the action of turbulent flows in nature has the potential to be useful to the researchers who undertake the dynamics of pipelines and short cylinders placed on river-, sea-beds and shallow water regions of coastal areas; and who examine the formations of crescentic scour marks in a recent stream for palaeo-current direction. This study would be helpful for engineers to modify their structural designs or using some protective measures for meeting the problems faced due to scouring. The observation can also be further utilized in turbulence modeling for studying the effects of turbulent events occurring in the scour holes generated by cylinders/piers.
Acknowledgments
One of the authors (BSM) would like to express his sincere thanks to Professor Supriya Sengupta and Professor J.K. Ghosh for introducing him to the topic and suggesting the problem and to Professor Chandan Chakraborty for his encouragement. The authors would like to express their sincere thanks to Professor T.J. Pedley for helpful technical discussions on the work during BSM's visit to The Isaac Newton Institute of Mathematical Sciences, Cambridge University, UK; and two anonymous referees and Associate Editor for their constructive suggestions to improve the paper.


