Uncertainty and simulation-based cost analyses for energy storage systems used in green buildings
Summary
Energy storage systems (ESS) provide buildings with the ability to store electricity generated from renewable energy sources (eg, solar photovoltaics), increasing building operational flexibility and reliability. Previous studies on ESS in buildings often make assumptions about key input parameters (eg, installation factor, roundtrip efficiency, etc.) being fixed, overlooking potential performance risks due to uncertainty or variations in these parameters. The goal of this paper is to quantify the impact of uncertainty in technical and financial parameters on the economic performance of Li-ion batteries (LIB), proton-exchange membranes reversible fuel cells (PEM RFC), and reversible solid oxide cells (RSOC). The analysis is conducted on three medium-sized office buildings located in three different climate zones of the United States: 2B (Phoenix, AZ), 3B-Coast (Los Angeles, CA), and 4C (Seattle, WA). Two metrics are used to evaluate the economic viability of the selected technologies, namely the levelized cost of electricity (LCOE) and the levelized cost of energy storage (LCOS). While the results of the LCOE and LCOS differed in value between those cities, the cost breakdown for LCOS in all locations shows that capital cost is the biggest cost contributor, followed by electricity cost. A Monte-Carlo simulation was also conducted to assess the impact of uncertainty in input parameters on the LCOS model. The simulation results allowed us to generate probable ranges and probability tables for the LCOS.
1 INTRODUCTION
Renewable energy systems are increasingly adopted in buildings due to their decreasing costs, increasing reliability, and global trends towards lower carbon footprints.1 While residential buildings account for one of the highest shares of energy demand globally (20%), commercial buildings witness important growth rates currently accounting for about 14% of the world energy demand.2 Consequently, energy policies, building standards, and technologies are constantly developed to make commercial buildings more sustainable and reduce their impacts on the environment.3
According to the World Green Building Council,4 a “green” building is a building that minimizes negative impacts and maximizes positive impacts on the climate and natural environment. This is typically achieved through design and operation strategies that cover the energy demand and supply sides. Starting with the latter, green buildings should be designed and operated to ensure efficient use of materials and resources, such as energy and water. In parallel, green buildings should aim to generate energy using renewable sources, such as solar energy.4
Energy generation is highly dependent on weather conditions; therefore, cases of shortage in energy are possible. Similarly, cases of excess energy are plausible. Excess and shortage cases are considered losses because they both induce financial losses. To minimize the losses and avoid curtailing the generated electricity if not used, energy storage systems (ESS) are often introduced as a viable economic solution that can reduce the energy losses and improve the building's resiliency at the same time.5
There are five major types of ESS: electrical, chemical, electrochemical, mechanical, and thermal.6 ESS differ majorly in structure, mode of operation, roundtrip efficiency, and expected lifetimes.7 Lithium-ion batteries (LIB) and fuel cells, namely proton exchange membrane reversible fuel cells (PEM RFC) and reversible solid oxide cells (RSOC), were chosen for this research because of their higher power rating and their suitability for medium- and long-term storage needs.6 Although these ESS seem helpful in avoiding energy and electricity curtailment, they have limitations that may limit their efficacy and economics. For instance, fuel cells have lower round-trip efficiencies, unlike batteries that are characterized by higher roundtrip efficiencies in the range of 70% to 95%.1, 8 Also, the capital costs of fuel cells are still high compared to rechargeable batteries. The efficiency of the fuel cells is low mainly because of the parasitic losses in the balance of plant (BOP).9-11 The BOP consists of several subsystems that maintain the operations of the fuel cell and electrolysis modes. That is done by transporting required gases and power to the stack, regulating temperature and humidity inside the stack, and finally regulating the humidity and pressure of the hydrogen in the hydrogen dryer, compressor, and storage tanks.5 On the other hand, LIBs have a higher response time and tend to remain idle most of the time depending on the storage capacity and charging rate.12
Most research on the economics of energy storage systems tends to do a techno-economic analysis while disregarding the risk posed on the levelized cost of storage (LCOS) by ignoring uncertainty in parameters. Using point estimates for all economic and design parameters will not always generate an accurate cost estimate. Many researchers adopt a simpler approach, often using sensitivity analyses to outweigh that risk or uncertainty in some selected variables. While studying the impact of individual parameters on the LCOS might provide an idea about its sensitivity to that specific parameter, considering the simultaneous impact of all parameters gives a holistic idea about the dynamic behavior of the LCOS. There can exist synergies between parameters that can cause an impact on the LCOS that is larger than the sum of all parameters' individual effects.13
On the other hand, part of the literature focuses on technical uncertainty. For example, Al Amoodi and Azar12 use uncertainty analysis to determine the impact of human action/behavior on the total consumption of energy in commercial buildings. Al Kaabi et al.13 propose a model that quantifies the impact of inputs such as design and operation parameters on the performance of a green-certified commercial building located in the extremely hot climate of Abu Dhabi, UAE. Results show that adopting the green building features of the local “Estidama” building code reduces energy demand by an average of 17%. Luerssen et al.14 use Morris and Sobol methods, which both rely on the Monte-Carlo simulations, to assess the uncertainty in the LCOS of a Li-ion battery and a chilled water storage for an on-grid PV. The analysis allowed them to conclude that the chilled water storage can yield a lower LCOS by 8¢/kWh than battery storage considering the same self-sufficiency.14 Also, the uncertainty analysis showed that the storage lifetime for the battery is the most important parameter impacting the LCOS.14 Similarly, Aldersey-Williams and Rubert15 used uncertainty in the inflation rate impacting the discount rate to assess uncertainty in the LCOE and other future costs. They have presumed that the variability of fuel prices, induced by inflation, can particularly impact the LCOE for wind energy, setting ranges for onshore between £17/MWh and £120/MWh, and between £45/MWh and £60/MWh for offshore wind energy.15
Yates et al.16 used Monte-Carlo simulation approach to study a wide range of input assumptions to identify the key cost drivers, cost targets, and localized conditions that play role in determining the cost of energy production for a competitive hydrogen electrolysis system powered by a stand-alone PV solar system. The analysis covered several states in Spain, United States, Chili, Japan, and Australia. Authors examined the effect of several cost and design parameters in the range ±10% for each individual parameter to study and how they affect the levelized cost of hydrogen production for PEM and alkaline electrolyzers. They found that capital cost and electricity cost (LCOE) are the key factors that shape the final LCOS. In general, uncertainty analysis for smart grids and green buildings can help engineers and analysts identify technical performance and cost targets for an optimal configuration that would deliver competitively priced green energy.16
In this paper, our main objective is to quantify the impact of uncertainty in technical and financial parameters on the LCOS for PEM RFC, RSOC, and LIB in a medium-sized office in three different locations in the United States with different climate zones: Phoenix, AZ; Los Angeles, CA; and Seattle, WA. The three locations were chosen based on their global horizontal solar irradiance. As such, Phoenix belongs to the area where the average GHI is more than 5.75 kWh/m2/day, Los Angeles is part of the second hotter area where the GHI is between 5.50 and 5.75, and finally, Seattle falls in the area where the GHI is less than 4 kWh/m2/day, The climate zones were defined afterward. The contribution of our research is in completing a what-if analysis to reach the target LCOS, then running Monte-Carlo simulations to study the impact of various input parameters on the LCOS of LIB and fuel cells. The percentage changes are inspired by the results of the what-if analysis that provided an idea about how projections of input parameters can change the LCOS. First, the percentage changes are implemented, and then the uncertainty of the LCOS is discussed. This paper is one of very few papers that address the uncertainty analysis in the cost of energy storage of the integrated PV-hydrogen based or PV-battery based ESS. Further, this paper focuses on calculating the actual LCOS, after that we validated the results from our developed model to those available in the most recent studies in the area of energy storage. The rest of the paper is organized as follows: Section 2 presents the methodology followed. That includes the methods followed to generate the LCOS, the what-if analysis methodology, and the Monte-Carlo parameters and methods. After that, the results will be discussed in Section 3 with graphs illustrating the uncertainty analysis results, and conclusions and future work are presented in Section 4.
2 METHODOLOGY
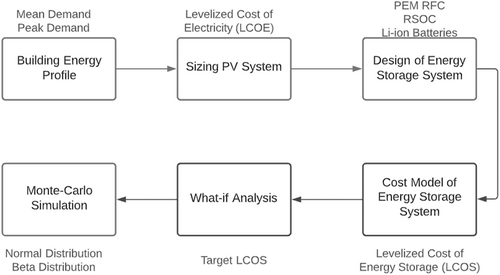
Figure 1 shows the major steps in the techno-economic model. Key inputs and metrics are shown next to each step. We started by studying the building energy profiles and design requirements of the PV solar system to meet the building average and peak demands. After that, we used the energy profile and PV system generation profile to size the energy storage systems. Then, we developed a cost model and associated risk analysis to calculate the LCOS in the selected energy storage systems using Matlab and Excel. Finally, we run a scenario that can cut the LCOS in the future by looking at the most important design and cost parameters that play a key role in shaping the LCOS.
2.1 Commercial buildings' overview and PV system design
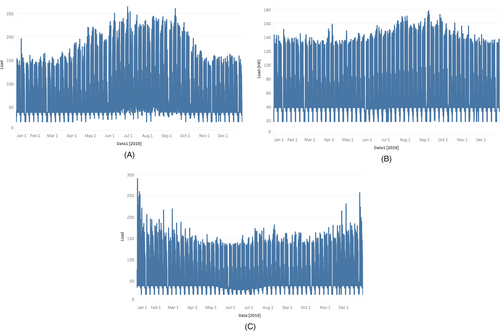
In this research, we consider three medium-sized office buildings representative of typical buildings encountered in three climate zones of the United States 2B (Phoenix, AZ), 3B-Coast (Los Angeles, CA), and 4C (Seattle, WA).20 The three locations were considered according to the noticeable difference in their annual solar irradiances, hence their expected solar energy potentials. As such, the global horizontal irradiance of Phoenix is 5.90 kWh/m2/day, that of Los Angeles is 5.54 kWh/m2/day, and that of Seattle is 3.44 kWh/m2/day.17 The energy models for the selected buildings were obtained from the U.S. Department of Energy's “Commercial reference buildings” initiative.18 The models, which are developed using the EnergyPlus software,18 were downloaded and run to generate hourly electric load profiles that capture different building end-uses (eg, lighting, equipment, air conditioning, ventilation, among others).19 It is important to note that the three models have the same geometric features (eg, 3-floor and a floor area of 53 628 ft2) and operation patterns (eg, building schedules) but may have different construction materials as those are typically climate-dependent.18 The results of the runs show maximum loads of 264.92 kW in Phoenix, AZ, 178.30 kW in Los Angeles, CA, and 289.99 kW in Seattle, WA, and the average loads are 91.19 kW in Phoenix, 73.61 kW in Los Angeles, and 78.74 kW in Seattle. The peaks of the load profiles do not merely reflect the yearly demand, as they can be the results of exceptional days during the year of the study. The load profiles of the three locations are presented in Figure 2.
The PV generation profile was extracted for an average year using SAM from the Department of Energy's National Renewable Energy Laboratory.17 SAM is a functional online program that helps designers develop cost models for different renewable energy systems and estimate multiple performance metrics such as the system annual and cumulative generated power, expected capacity factor (%), net present value (NPV), simple and discounted payback periods, and the LCOE. SAM was originally developed to facilitate the decision-making process for professionals working in the renewable energy area17 . Based on the load profiles, the estimated nameplate PV system size is 500 kWDC, based on the ability of this system to meet the peak demand of the building. A fixed-axis PV system is assumed in this study with an azimuth of 180° and a tilt of 20°. The selected PV module is Mono-facial crystalline-silicon SunPower SPR-310-WHT-U which has a nominal efficiency of 19.016% and a maximum power of 310.15 WDC. DC/AC inverter is SMA America: STP 60-US-10 [400 V] with an average DC-AC conversion efficiency of 98.23%. Annual PV module degradation is estimated to be 0.5% per year. Other cost and design factors are summarized in Table 1. Total DC losses, as generated by SAM, are estimated to be around 4.44%, which is the sum of the module mismatch (2%), diode and connections losses (0.50%), and DC wiring (2%).
| Design parameter | Value | Unit |
|---|---|---|
| Nominal system size | 500 | kWDC |
| Module type | Mono-facial crystalline-silicon SunPower SPR-310-WHT-U | |
| Azimuth & Tilt | 80° and 20° | |
| Module efficiency | 19.016% | |
| Module capacity | Up to 310.15 | WDC |
| DC/AC invertor | SMA America: STP 60-US-10 [400 V] | |
| DC/AC inverter efficiency | 98.23% | |
| Maximum DC voltage | 820 | VDC |
| System losses | 4.44% | |
| Annual DC degradation rate | 0.50% per year | |
| Total module area | 2623 | m2 |
| PV system capital cost | $560 162 (including contingency = 3% of subtotal cost) | |
| Total indirect cost | $297 262 (includes engineering and site preparation, permitting and environmental costs, and sales tax) | |
| TIC (Total installed cost) | $857 424 | |
| Total installed cost per capacity | $1.72/WDC | |
| Incentives and taxes | Variable (location specific) Including 26% of the federal investment tax credit |
2.2 Energy storage systems
For this research, we consider three types of energy storage systems: Li-ion battery as an example of mature ESS technologies, PEM RFC and RSOC as emerging hydrogen-based ESSs. Fuel cells (PEM and RSOC) have different operating conditions (including temperature, pressure, and humidity in the stack). Reversible solid oxide cells (RSOC) use solid oxides in the stack cells.20 This technology usually operates at temperatures between 600°C and 800°C. Reversible fuel cells based on the proton exchange membrane (PEM) use a polymeric membrane deposited with catalyst layers using platinum group metals from both sides. This technology operates at temperatures between 70°C and 120°C.5 On the other hand, fuel cells differ from batteries in the operating schemes. In essence, fuel cells can operate continuously as long as the feedstock is available; thus, can have zero idle time. However, Li-ion batteries are characterized by longer idle times that range from minutes to hours depending on the charge state, charging and discharging profile, and battery size.21 In addition, a key difference between fuel cells and batteries lies in their dispatchability of energy and starting time. The response time of batteries ranges in milliseconds, around 10 to 20 ms. On the other hand, fuel cells take a longer time, quantified in minutes sometimes.21 Batteries need to reach the minimum SOC, state of charge, before operating.22 Alternatively, the temperature is what controls the start-up time of fuel cells. Having said so, RSOC tend to take longer start-up times than PEM.23 Schematics of the PV system, ESS's, and how they are connected to the building are shown in Figure 3.
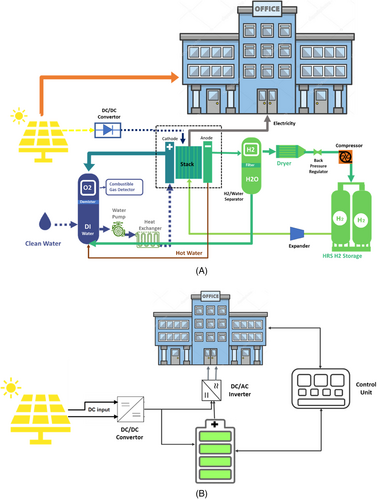
The balance of plant is the most significant cost component of the fuel cells as it contributes to approximately two-thirds of the system cost.24 The main tasks of the BOP are two: regularizing the appropriate temperature and pressure inside the stack and delivering suitable amounts of reactants and adjusting the cooling temperature and pressure during fuel compression and expansion cycles.25 The balance of plant is composed of several subsystems, such as AC/DC rectifier, DC/AC inverter, transducers, water-management system (with water pumps, pipes, and hoses, among others), a thermal-management system (with heat exchangers, air blowers, manifolds, among others), air-cooled condensers, expanders, boilers, and a hydrogen processing and storage unit (with a hydrogen dryer, compressors, and storage tanks).5, 8, 24-26 The hydrogen storage subsystem plays a vital and inherent role in the dynamics of the BOP. Henceforth, variations in the tank properties should be well studied, as those can significantly affect the performance of the total system cost and performance in terms of the percentage of the time the RFC can consume or produce hydrogen.25
2.3 Functions specifications of the ESS
Tables 2 to 4 summarize the functional specifications of the ESS considered in this study. Most of the data presented in the tables were collected from previous techno-economic studies. References are cited accordingly. The sizes of the ESS's were determined by the maximum demand and discharged kWh from the system, respectively. This design case resulted in a PV size of 500 kW, and a nominal battery size of 400 kWh, to cover at least 80% of the building demand.
| Parameter | Fuel Cell | Electrolyzer | Note/Reference |
|---|---|---|---|
| Stack power | 251.4 kW | 591 kW | 40 |
| Current density | 0.4 A/cm2 | 1.0 A/cm2 | 27 |
| Reference voltage | 0.71 V | 1.73 V | 27 |
| Power density | 0.284 W | 1.730 W | |
| Cells per stack | 124 | 124 | 40 |
| Stacks per system | 25 | 25 | 27 |
| Cells per system | 3106 | 3106 | |
| Stack voltage efficiency | 57.77% | 85.61% | |
| Total parasitic | 35 | 61 | 27 |
| Net efficiency | 49.73% | 76.77% | |
| Total system efficiency | 38.18% | ||
| ESS cost | $667/kW | Cost is based on the modeled 250 kW PEM stack at 10000 units per year.40 | |
| O&M | 3.5% of TIC | 40 | |
| System life expectation | 11 years | 40 |
| Parameter | Fuel Cell | Electrolyzer | Note/Reference |
|---|---|---|---|
| Stack power | 250 kW | 454 kW | 27 |
| Current density | 0.44 A/cm2 | 0.44 A/cm2 | 27 |
| Reference voltage | 0.71 V | 1.29 V | 27 |
| Power density | 0.312 W | 0.568 W | |
| Cells per stack | 127 | 127 | 27 |
| Stacks per system | 21 | 21 | 27 |
| Cells per system | 2676 | 2676 | 27 |
| Stack voltage efficiency | 58% | 95% | 27 |
| Net electrical efficiency | 53% | 83% | 27 |
| Total system efficiency | 43.99% | ||
| ESS cost | $500/kW | Cost is based on the modeled 250 kW RSOC stack at 10000 units per year.27 | |
| O&M | 3.5% of TIC | 27 | |
| System life expectation | 11 years | 27 |
| Parameter | Nominal/Median Value | Note/Reference |
|---|---|---|
| Battery Size | 400 kWh | Nominal storage size of the battery |
| Battery chemistry | NMC | Nickel-Manganese-Cobalt cathode, and graphite in the anode |
| Charging rate | 0.5C (2 h discharge) | Variable |
| Lowest depth of discharge | 0.25C (100 kWh) | Minimum discharge level |
| Roundtrip efficiency | 92.5% | 29 |
| ESS cost | $339/kW | 29 |
| O&M | 1% of TIC | 30 |
| System life expectation | 14 years | 29 |
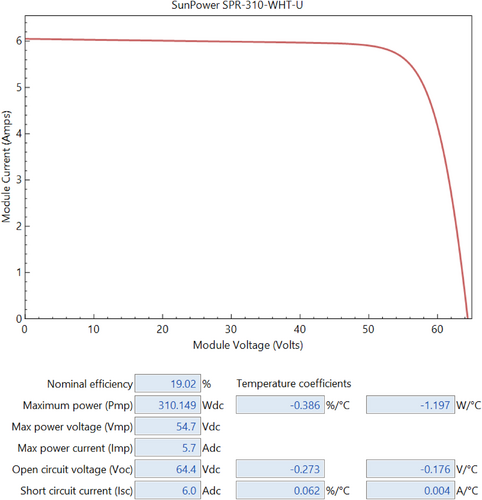
Power curve of the chosen module (mono-crystalline SunPower SPR-310-WHT-U) is shown in Figure 4. The standard testing conditions of irradiance = 1000 W/m2 and cell temp = 25°C give a maximum power and voltage per module of 310.14 Wdc and 54.7Vdc, respectively. The nominal efficiency of this module is 19.016%.
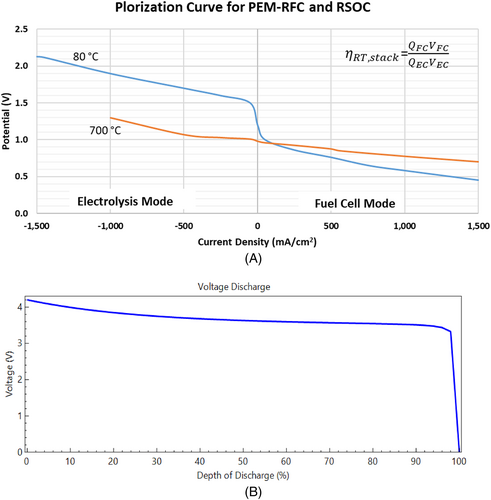
Another important design aspect of the ESSs is their power curves and how they behave under the changing operating conditions. In this context, we use the polarization curves to study the performance of the ESS's in the partial and full load conditions. Figure 5 shows the polarization curves at the standard operating temperature and pressure for PEM-RFC and RSOC. PEM-RFC are generally more sensitive to changes in the current density in comparison with the RSOC making it the preferred hydrogen-based ESS in the load-following applications such as the case where we have RFC that is connected to an intermittent renewable energy source (eg, PV solar system or wind).27, 40 A common rule of thumb recommends operating RSOC at current density in the electrolysis mode that is 2-3X more than the corresponding current density in the fuel cell mode.25, 27 PEM RFCs generally have higher starting voltage than that of the RSOC, typically 1.2 V for PEM RFC and nearly 1.0 V for RSOC. This voltage potential is called “no loss voltage,” or equilibrium potential.40 The high operating temperatures in the RSOC allow it for better response to any sudden drop in the voltage at the beginning of the reaction, unlike PEM RFC which usually experiences a sudden change upon the change between electrolysis and fuel cell modes.27 For Li-ion batteries, they usually supply a voltage that decreases a bit with the state of charge. A LIB that is fully discharged can supply voltage above 4 V, which reduces to less than 4 V when the depth of discharge increases to 10% or more. In this study, we limit the LIB design to have the lowest depth of discharge = 25% of the nameplate storage capacity.
2.4 Techno-economic model for PV system and ESSs
The techno-economic analysis and design parameters of the designated ESS are summarized in Table 5. The sizes of the PV system were determined following the maximum demand and discharged kWh from the system, respectively taking into account ESS efficiency and losses during the conversion cycles. PEM RFC and RSOC were designed to cover 100% of the building demand, including the peak times, while LIB was designed to meet at least 80% of the demand in the year (ie, LIB was sized using peak demand).
| Parameter | PV | PEM RFC | RSOC | LIB | Note/Reference |
|---|---|---|---|---|---|
| System size | 500 kW | 591 kW | 454 kW | 400 kWh | |
| System cost | $1720/kWDC | $667/kW | $500/kW | $339/kWh | |
| Installation factor | 1.34 | 1.33 | 1.33 | 1.25 | 19, 27, 31 |
| Total installation cost | $857 424 | $524 282 | $301 910 | $169 500 | |
| O&M | $9500 | $18 350 | $10 567 | $1695 | per year |
| Discount rate | 9.06% | 8% | 8% | 8% |
2.4.1 Levelized cost of storage
2.5 Uncertainty analysis
To examine the effect of some selected financial and design parameters on the LCOS, we performed an uncertainty analysis to facilitate our understanding of how the ESS behave under changing operating schemes and the expected changes in the cost values. Initially, we conduct a what-if analysis by applying possible percentage changes on the actual LCOS to reach a target LCOS. Then, we run a Monte-Carlo simulation to develop a cost distribution function that can be used to estimate the mean, SD, and expected LCOS range.
We believe that beta and normal distributions are best suited to represent the uncertainty of the selected variables. According to the NASA's technical report in 2013 about modelling risk analysis in different projects, we think that beta and normal distribution can capture the expected range of uncertainty in the cost of the energy storage because they are the most common distribution functions used in modelling the risk in the projects (budget, time, etc.).41
2.5.1 What-if analysis
The what-if analysis helps determine the effect of changing initial assumptions and parameters used in developing the cost model. It also helps visualize how changes in input variables will affect the LCOS, thus helping reach a target LCOS for every ESS. The first change was the expected reduction of capital costs by 30%. The 30% estimate is considered conservative as IRENA32 anticipates price drops between 50% and 60% by 2030. The operations and maintenance costs were considered to decline by the same percentage since we assumed the O&M cost to be 1% and 3% of the total installed system cost for LIB and RFC, respectively. The roundtrip efficiency is also one of the most important variables that shape the overall LCOS. Hutty et al. estimated that the efficiency of fuel cells would optimistically increase by 45%.33 Again, a pessimistic approach was taken, and only a 30% increase was considered. Regarding batteries, a maximum efficiency of 93.7% was considered according to IRENA.29 Furthermore, and since an increased roundtrip efficiency would induce a better performing ESS, it can be assumed that the lifetime will be enhanced as well. Therefore, the lifetime was estimated at a 30% increase, similar to the roundtrip efficiency increase. For the sake of consistency, the change in electricity price was estimated at −30%, considering the improvement in the PV solar systems and other reductions in the PV cost with economies of scale.
2.5.2 Monte-Carlo simulation
Monte Carlo analysis (MCA) is a common technique for global sensitivity and risk/uncertainty analysis.34, 35 It is mainly used to quantify the simultaneous impact of various parameters on a variable using hundreds or thousands of different combinations of model inputs. Different probability distributions can be used in cost analysis for clean energy systems; such as the normal, beta, triangular, and uniform distributions among others. Schmidt et al.36 used a normal distribution when varying input parameters, while Yates et al.16 applied two two-half lognormal probability distributions to avoid negative values. In this research, we considered normal and beta distribution as we believe they are more realistic in representing the cost variables discussed above. In our case, we could not use the lognormal since the LCOS values are less than 1. Also, the beta distribution is ideal for continuous variables with values ranging between 0 and 1. On the other hand, the normal or Gaussian distribution is used as an approximation to the distribution of random variables with unknown distributions.37
The parameters considered for the Monte-Carlo analysis are capital cost, installation factor, operation and maintenance, discount rate, roundtrip efficiency, and finally, electricity cost. The percentage changes for capital cost, the operation and maintenance, the roundtrip efficiency, and the electricity price were the main parameters considered in the what-if analysis presented in the previous section. The simulation was run for 10 000 iterations for each ESS under each distribution, resulting in a total of 180 000 iterations.
2.5.3 Normal distribution
| Parameter | Lowa | Higha |
|---|---|---|
| ESS Cost | −30% | 10% |
| Installation factor | −25% | 50% |
| O&M | −30% | 30% |
| Discount Rate | −50% | 50% |
| Roundtrip Efficiency | −30% | 30% |
| Electricity Price | −30% | 30% |
- a High and low values are percentage changes from nominal values in Table 4.
2.5.4 Beta distribution
In the present study, we assumed the ranges for the beta distribution just like the ones for the normal distribution, with a slight alteration in the “high” percentage to avoid getting zero in the denominator when computing the values for α and β. Table 7 summarizes the low and high ends of each parameter using beta distribution.
| Parameter | Lowa (a) | Higha (b) |
|---|---|---|
| ESS Cost | −30% | 10% |
| Installation factor | −25% | 50% |
| O&M | −30% | 28% |
| Discount Rate | −50% | 48% |
| Roundtrip Efficiency | −30% | 28% |
| Electricity Price | −30% | 28% |
- a High and low values are percentage changes from nominal values in Table 4.
3 RESULTS AND DISCUSSION
In this section, we will present and discuss the results from the cost model, including the economics of the power supply (ie, PV system) and ESS, sensitivity analysis, and cost simulation analysis.
3.1 PV System performance and economics
Based on the results from SAM models in Figure 6, the LCOE is around 2.46 ¢/kWh in Phoenix, AZ, 2.37 ¢/kWh in Los Angeles, CA, and 4.04 ¢/kWh in Seattle, WA. That is the considered electricity price in the analysis. The three PV systems are financed with $0 equity and $857 424 in debt. The same figure shows the profitability of the system via the positive NPV and the payback periods being less than 25 years (the average system's lifetime). The financial analysis for the PV systems of these three cities is shown in the summary tables and the monthly aggregated power generation charts in Figure 6. The capacity factor, which is the ratio of actual to maximum possible electrical energy output in one year, is 21% in Los Angeles, a little higher in Phoenix (22%), and only 13.0% in Seattle. This is another metric that indicates the suitability of PV solar systems in any geographical location. In general, capacity factors above 20% are considered high while values below 15% are considered low and PV might not be a competitive renewable energy source in this geographical location. Any value between 15% and 20% means a moderate capacity factor.38, 39 Thus, Los Angeles and Phoenix represent two good examples of green buildings relying on the PV system to generate their energy needs. A shorter payback period in Los Angeles than the corresponding payback period in Phoenix or Seattle can be linked to the fact that electricity tariffs in the Los Angeles area are much higher than tariffs in Phoenix. The higher payback period in Seattle indicates that cumulative savings of the generated electricity need a longer period to break even with the initial investment.

The annual energy generation of this PV system, as can be seen in Figure 6, is 927 218 kWh in Phoenix, AZ, 961708 kWh in Los Angeles, CA, and 565 772 kWh in Seattle, WA. In addition, the charts show the summer months recognize a peak performance, while winter months witness the lowest monthly generations. The LCOE is a common acceptable cost metric that is used to evaluate the economics of electricity production using renewable energy sources. In this case, competitive costs were obtained that are at (or below) corresponding electricity from the grid.5, 8
3.2 Levelized cost of storage
The LCOS results, alongside the cost breakdown of these three cities, are shown in Table 8. The percentages in the table show that capital cost has the largest cost share of the total LCOS, which can be linked to the complex installations and the larger capital investment needed to install these ESS in commercial buildings. Also, LIB have a higher capital cost component in $/kWh of the stored energy due to two factors: the first factor is the higher capital cost of LIB, and the second is their lesser discharge periods, hence more idle time. However, it can be noticed that the LCOS of LIB is lower than that of fuel cells in Los Angeles, while higher in Seattle. As per Phoenix, RSOC represent the cheapest ESS. These discrepancies are due to the difference in the load profiles, and the fact that Seattle is located in the 4C climate zone characterized by low sun irradiations and longer cloudy conditions in the year, which also explains the high electricity price. ESS-wise, the difference in efficiencies is what mainly differentiates between the three ESS, as the impact is quite noticeable, alongside the O&M percentage.
| ESS | Phoenix, AZ | Los Angeles, CA | Seattle, WA | ||||||
|---|---|---|---|---|---|---|---|---|---|
| RFC | RSOC | LIB | RFC | RSOC | LIB | RFC | RSOC | LIB | |
| Capital cost | 0.222 $/kWh (65%a) |
0.146 $/kWh (62%) |
0.225 $/kWh (83%) |
0.284 $/kWh (68%) |
0.187 $/kWh (66%) |
0.215 $/kWh (83%) |
0.182 $/kWh (55%) |
0.120 $/kWh (50%) |
0.342 $/kWh (83%) |
| Electricity cost | 0.064 $/kWh (19%) |
0.056 $/kWh (24%) |
0.027 $/kWh (10%) |
0.062 $/kWh (15%) |
0.054 $/kWh (19%) |
0.026 $/kWh (10%) |
0.106 $/kWh (32%) |
0.092 $/kWh (39%) |
0.044 $/kWh (11%) |
| O&M cost | 0.055 $/kWh (16%) |
0.032 $/kWh (14%) |
0.019 $/kWh (7%) |
0.071 $/kWh (17%) |
0.041 $/kWh (15%) |
0.018 $/kWh (7%) |
0.046 $/kWh (14%) |
0.026 $/kWh (11%) |
0.028 $/kWh (7%) |
| LCOS | 0.342 $/kWh | 0.234 $/kWh | 0.270 $/kWh | 0.417 $/kWh | 0.282 $/kWh | 0.259 $/kWh | 0.334 $/kWh | 0.238 $/kWh | 0.414 $/kWh |
- a Percentage of the total LCOS.
Validation of our model and results was made by comparing them to the recently published data in the same field. In their study, Santarelli et al. estimated the 2025 targets and long-term LCOS Targets for R-PEM technology to be $0.40/kWh and $0.25/kWh respectively, while for R-SOFC technology these targets are $0.25/kWh and of $0.15/kWh, respectively.42 For Li-ion batteries, many studies such as in43, 44 and estimated an economic LCOS to be in the range of $0.10 to 0.35, and this could reach higher values ($0.43 to 0.55) such as those reported in Reference 45. We think our estimated LCOS values are in ballpark with those estimates in the literature.
3.3 Uncertainty analysis results
3.3.1 What-if analysis
Table 9 shows the values of the target LCOS after applying the before-mentioned percentages, along with the breakdown of costs. Waterfall charts below give an emblematic idea about the undergone changes to reach a target LCOS. At each percentage change, the percentage difference in the LCOS was marked and illustrated in the plots. The objective is to reach an LCOS that is at most 50% less than the original LCOS.
| ESS | Phoenix, AZ | Los Angeles, CA | Seattle, WA | ||||||
|---|---|---|---|---|---|---|---|---|---|
| RFC | RSOC | LIB | RFC | RSOC | LIB | RFC | RSOC | LIB | |
| Capital cost | 0.133 $/kWh | 0.086 $/kWh | 0.138 $/kWh | 0.170 $/kWh | 0.11 $/kWh |
0.131 $/kWh | 0.109 $/kWh | 0.071 $/kWh | 0.210 $/kWh |
| Electricity cost | 0.035 $/kWh | 0.030 $/kWh | 0.018 $/kWh | 0.033 $/kWh | 0.029 $/kWh |
0.018 $/kWh |
0.057 $/kWh | 0.050 $/kWh | 0.030 $/kWh |
| O&M cost | 0.027 $/kWh | 0.016 $/kWh | 0.009 $/kWh | 0.035 $/kWh | 0.020 $/kWh |
0.009 $/kWh | 0.022 $/kWh | 0.013 $/kWh | 0.014 $/kWh |
| LCOS | 0.195 $/kWh | 0.132 $/kWh | 0.165 $/kWh | 0.239 $/kWh | 0.159 $/kWh | 0.158 $/kWh | 0.189 $/kWh | 0.133 $/kWh | 0.254 $/kWh |
Figures 7, 8, and 9 show the initial LCOS, the difference after every induced change in each parameter, and finally the target LCOS for Phoenix, Los Angeles, and Seattle, respectively.
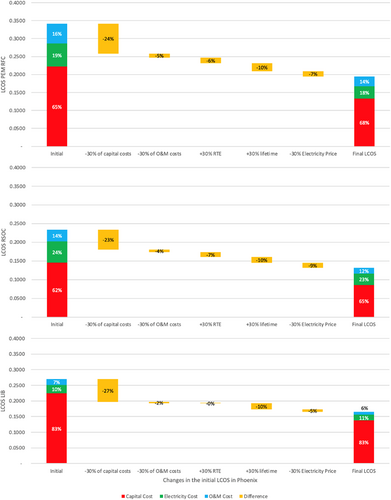
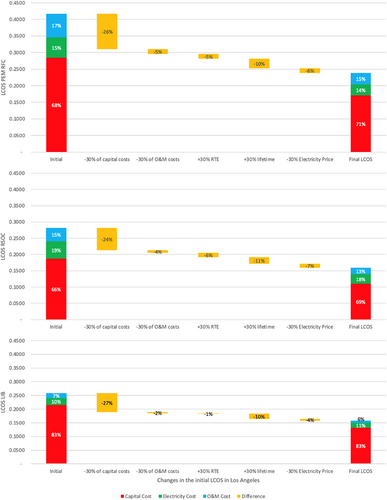
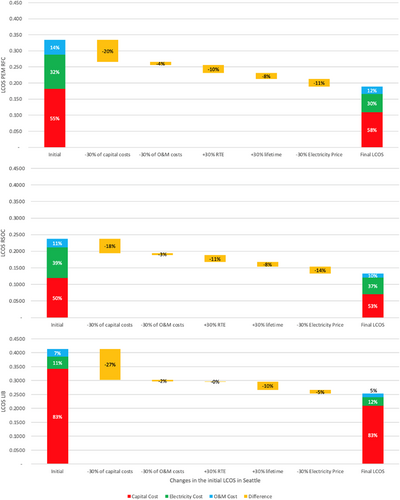
The table and the figures show how impactful the change in capital costs on the LCOS is, which is logical since it upholds the highest share of it. Then, the roundtrip efficiency and the electricity price have the next highest impact on the LCOS. Noteworthy to highlight that the change in the roundtrip efficiency is the least impactful on the LCOS of LIB since the change was not significant (from 92.5% to 93.7%). Further, as the electricity price is highest in Seattle, a sharp decrease by 30% seriously impacts the LCOS, namely of the fuel cells. The percentage changes of the LCOS were 44% for both fuel cells, and 39% for LIB, as the roundtrip efficiency is one of the major components affecting the LCOS, and its change for LIB was barely noticeable. Nevertheless, even with a 30% decrease, the capital cost component maintains its large share in the total LCOS, at a lower value instead. From the analysis, it appears that the longed-for improvements in ESS are indeed going to help decrease their LCOS. As such, and although a pessimistic approach was followed, the LCOS reckoned a sharp decrease by around 40%, and that is within the 2030 horizon. Further, the charts show how impactful the change in capital costs is on the final LCOS. Having said so, decreasing capital costs is the key to lowering the LCOS further, reaching a 50% change or more. Regarding fuel cells, advances are made to increase the round-trip efficiency, and that is expected to reduce the LCOS. Noteworthy to mention that changes in round-trip efficiency are noticeable for fuel cells. Batteries on the other hand would benefit from improvement in their lifetime. Finally, the objective of this analysis was to see if the proposed percentages would help reach the target LCOS. According to the values presented in Section 3.2, we could conclude that the target LCOS were indeed reached, and those percentages and improvements ought to decrease the LCOS further than targeted.
3.3.2 Monte-Carlo simulation
The Monte-Carlo simulation results show the expected distribution of the LCOS that resulted from the uncertainty in the input parameters.
Normal distribution
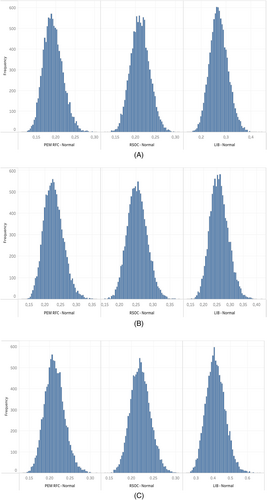
The histograms in Figure 10 show the resulting distribution of the LCOS using 10 000 random combinations for each location. All the histograms are peaked and a little right-skewed, except for that of RSOC exhibits a better level of symmetry. The histograms are normally distributed or close enough to be considered normal, and that ensures how impactful the selected parameters are on the LCOS. The figures provide intervals for the LCOS under uncertain conditions. This can help us draw conclusions about different battery sizes as it can fairly be said that a larger battery size would result in a higher upper bound of the histograms.
Beta distribution
The distribution functions in Figure 11 show the results of 10 000 random combinations of the LCOS for every city as a function of changing several parameters discussed earlier in Section 2.5.
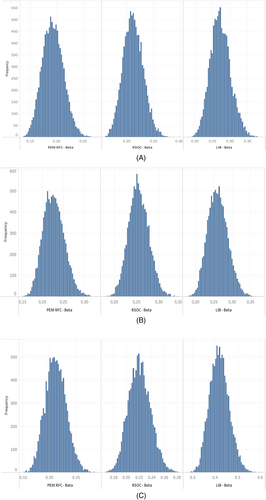
Similar to the normal distribution, the histograms are peaked, some skewed to the right, whereas that histogram is symmetric for the RSOC in Phoenix and Los Angeles. Here again, the same conclusions can be drawn; that is, LIB in Seattle tend to be more expensive as there is a probability that its LCOS can reach 60¢/kWh for a 400 kW battery; therefore, a bigger size would result in a higher LCOS under the same conditions.
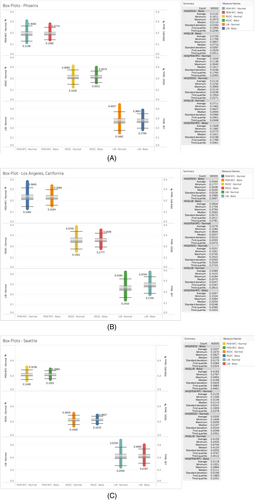
Comparative cost analysis using normal and beta distributions for these three cities was plotted side-to-side to examine the possible effect of these chosen distributions on the overall LCOS. The 10 000 LCOS generated earlier were plotted using box and whisker plots, highlighting the maximum and minimum for each ESS under each distribution, as can be seen in Figure 12. That provides an uncertainty interval of the LCOS for each city (see Table 11 for the three ESS technologies). As such, and considering any distribution, the LCOS of PEM RFC is not expected to be higher than 30¢/kWh in Phoenix, 37¢/kWh in Los Angeles, and 31¢/kWh in Seattle. Then the LCOS of the RSOC is not expected to go beyond 31¢/kWh in Phoenix, 37¢/kWh in Los Angeles, and 31¢/kWh in Seattle. Finally, the maximum LCOS for LIB would be 44¢/kWh in Phoenix, 42¢/kWh in Los Angeles, and 67¢/kWh in Seattle. The values on the figure suggest that within the “low” and “high” interval decided upon in the what-if analysis section, the fuel cells still represent an economically attractive solution to solve the curtailment of energy, with a little doubt concerning LIB. Minimums, maximums, medians, average values, standard deviations, and first and third quartiles are presented on the same figures.
| Phoenix | Los Angeles | Seattle | ||||
|---|---|---|---|---|---|---|
| Normal | Beta | Normal | Beta | Normal | Beta | |
| PEM RFC | 55.04% | 55.04% | 66.09% | 68.99% | 15.87% | 11.97% |
| RSOC | 0.02% | 0% | 0.03% | 0% | 0% | 0% |
| LIB | 0.06% | 0% | 0.07% | 0% | 0.02% | 0% |
| Phoenix | Los Angeles | Seattle | ||||
|---|---|---|---|---|---|---|
| Normal | Beta | Normal | Beta | Normal | Beta | |
| PEM RFC | 0% | 0% | 0% | 0% | 0% | 0% |
| RSOC | 17.47% | 12.27% | 16.13% | 11.68% | 21.24% | 16.56% |
| LIB | 49.31% | 51.50% | 48.39% | 51.12% | 48.56% | 52.41% |
The uncertainty analysis results confirm the previous results for LIB, especially in Seattle, and show that LCOS associated with the LIB is the highest among other ESS technologies. Results also confirm that fuel cells might be a better option when considering a relatively cheaper option to improve the resiliency and reliability of the grid. Further, the box plots values show how even under pessimistic conditions, acquiring ESS would be a better solution than wasting or curtailing the generated electricity from the PV system, and their LCOS would still be attractive. Besides the box plots, Tables 10 and 11 display probability tables of LCOS values less than the target LCOS determined in the what-if analysis, and LCOS values more than the actual initial LCOS values as presented in Section 2.2, respectively. To calculate those probability values, we started by fixing a set of 10 000 LCOS values for each ESS at each location. Then, the probability was the division of the total number of values less than the target LCOS generated in the what-if analysis section by the total (10000). Similarly, the total number of LCOS values more than the actual LCOS values generated in Table 8 divided by 10 000 provided us with the probabilities listed in Table 11.
The tables show an approximate alignment of distributions and provide insights into the possible LCOS values under uncertainty in the input variables. According to the analysis, in Phoenix, 55% of PEM RFC's LCOS values are less than 19.5¢/kWh, and none are higher than 34.2¢/kWh. In Los Angeles, less than 70% of PEM RFC's LCOS values are less than 23.9¢/kWh, and none are higher than 41.7¢/kWh in Los Angeles. In Seattle, less than 16% of PEM RFC's LCOS values are less than 18.9¢/kWh, and none are higher than 33.4¢/kWh. Using the same logic, we can say that the probabilities of LCOS values falling between the actual and the target for PEM RFC are 45% in Phoenix, about 30% in Los Angeles, and about 85% in Seattle. As per RSOC, the probabilities of LCOS values between the actual and the target for RSOC are a little more than 80% in Phoenix, about 85% in Los Angeles, and less than 85% in Seattle. Finally, the probabilities of LCOS values between the actual and the target for LIB are around 50% in Phoenix, about 51% in Los Angeles, and about 50% in Seattle.
This proves that even under uncertainty, the LCOS of reversible fuel cells confirms the attractiveness of these ESS technology. Unfortunately, the chances of getting a higher LCOS for LIB are considerably high, therefore confirming how expensive this ESS technology is, especially with larger battery size.
4 CONCLUSION
Energy storage systems can play a key role in increasing the reliability and resiliency of the grid and can help reduce energy losses when used in energy-efficient buildings. This paper presented a techno-economic model for storing energy using Li-ion batteries, proton exchange membrane reversible fuel cells, and reversible solid oxide cells in three different cities in the United States. The analysis shows that in Phoenix, AZ the LCOS values can reach 34.17, 23.38, and 27¢/kWh for PEM RFC, RSOC, and LIB, respectively. In the same respective order, the LCOS in Los Angeles, CA can reach 41.73, 28.18, and 25.85¢/kWh, and in Seattle 33.36, 23.80, and 41.41¢/kWh. Cost breakdown showed that capital cost is the most significant cost component in the LCOS. Further, sensitivity analysis was conducted to determine the impact of projected percentage changes in main parameters on the LCOS. The analysis helped determine a target LCOS in each city, with about 39% to 44% reduction.
Previous research about the LCOS of ESS fails to consider the uncertainty in certain parameters. At times, that leads to misleading results. This research incorporates uncertainty analysis in input parameters. The results show that parameters like the capital cost, installation factor, and round-trip efficiency can radically change the cost of storage of our ESS, particularly the capital cost. Results show that the chances of getting an LCOS between the target values and the actual LCOS are quite high, especially for fuel cells. As of LIB, the analysis shows that the probabilities of getting LCOS higher than 27¢/kWh in Phoenix, 25.85¢/kWh in Los Angeles, and 41.41¢/kWh in Seattle, are considerably high. Those probabilities are expected to increase with larger battery sizes.
In conclusion, the what-if analysis confirms the possibility of reaching a target LCOS if the projections are implemented in reality. Also, the uncertainty analysis shows how attractive the considered ESS remains albeit pessimistic uncertain conditions in the input parameters. Nevertheless, the analysis shows that batteries can be an expensive option in regions with climate zones similar to that of Seattle.
Future research ideas can include considering optimistic scenarios to reach the target LCOS. Technology improvements via rigorous R&D, and the new development of more efficient catalysts are expected to get the system capital cost down for both RFC and Li-ion batteries, thus a reduction in the LCOS is expected to follow that path as well. Also, exploring other regions and areas could help provide a more general and holistic image of the techno-economic analysis considering uncertainty. Finally, analyzing other residential and industrial buildings could be an interesting research idea as the parameters could probably differ from those of the commercial buildings.


