Investigation of seismic fragility curves of unbonded FREIs: Adaptive characteristics and modeling sensitivity
Abstract
Fiber-reinforced elastomeric isolators (FREIs) are composed of layers of elastomer reinforced with either steel or fibers, and can be placed in a bonded or unbonded configuration between the upper and lower supports. The use of fiber reinforcement in FREIs was intended to reduce the production and installation costs compared to common steel-reinforced elastomeric isolators (SREIs) and to develop an isolator suitable for widespread application, particularly in developing countries. The unique rollover deformation exhibited by unbonded FREIs (UFREIs), due to their flexible fiber reinforcement, enables them to adapt to multiple performance objectives at different hazard levels. In this study, the impact of different numerical models of UFREIs on the seismic response and failure probability of structures is investigated. The research employs incremental dynamic analysis and the development of fragility curves for different limit states, considering three sets of ground motions (including far-field and pulse-like). Moreover, the effect of full rollover was investigated by comparing the fragility curves of UFREIs when supported on modified support geometries, which involved three types of support: unmodified, accelerated, and delayed full rollover. The effectiveness of the adaptive characteristics to behave as a displacement restrain is demonstrated. The results emphasize the importance of employing an accurate model to simulate the behavior of UFREIs as an adaptive device for effectively utilizing their potential capacity, particularly at larger displacements where there is more dissipated energy due to full rollover.
1 INTRODUCTION
Earthquakes are natural phenomena that can result in catastrophic consequences for structures and infrastructures, manifesting in various ways, such as causing cracks, collapses, liquefaction, or fires. The extent of the damage is contingent on several factors, including the earthquake's magnitude and location, the type and quality of construction, and the soil conditions. A recent earthquake event occurred in Turkey and Syria on February 6, 2023 that resulted in a significant loss of life and injuries, with numerous buildings collapsing or suffering severe damage.1 To mitigate the impact of earthquakes on buildings, the implementation of base isolation systems has been recognized as one of the promising approaches. This concept involves decoupling the structure from ground motion,2, 3 leading to a reduction in the seismic energy transmitted to the superstructure. This is achieved by elongating the fundamental period of the structure and increasing its energy dissipation capacity, thereby enhancing the seismic performance and safety.2 However, the behavior of seismic isolation bearings is highly nonlinear and intricate.4 Thus, it is crucial to develop accurate numerical models of the isolation bearings for assessing the overall dynamic behavior of isolated buildings.
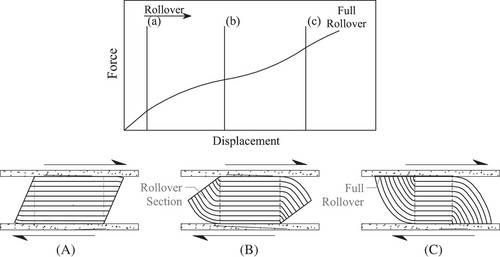
Elastomeric isolators are widely utilized devices that take advantage of the flexible characteristics of an elastomer, making them ideal for base isolation due to the low shear modulus and capacity to accommodate large recoverable strains.4 To improve the vertical and bending properties of the bearing, a combination of elastomer with steel or fibers as reinforcement is commonly employed. This combination has also led to the introduction of innovative devices, including unbonded steel mesh-reinforced rubber bearings.5 The incorporation of fiber reinforcement serves the purpose of reducing the manufacturing and installation expenses associated with steel-reinforced elastomeric isolators (SREIs) while striving to develop a device appropriate for widespread implementation, especially in developing countries.6 Fiber-reinforced elastomeric isolators (FREIs) can be placed bonded or unbonded between the upper and lower supports. The unbonded application of FREIs in conjunction with flexible fiber reinforcement results in a distinctive rollover deformation under horizontal displacement.2 The force-displacement relationship of an unbonded FREI (UFREI) is characterized by softening and stiffening regimes due to the rollover effect. This behavior is referred to as adaptive, as the characteristics of the device change substantially depending on the loading level. Three distinct regions are identified in the load-displacement relationship under lateral loading: an initial near-linear region, a softening region, and a subsequent stiffening region. Figure 1 depicts the typical force-displacement curve for an UFREI. Initially, at very low displacements, the lateral stiffness is significantly high and demonstrates an almost linear characteristic. Upon subjecting the device to lateral displacements, the isolator experiences a loss of contact between its leading and trailing edges and the upper and lower supports. This phenomenon, known as rollover, is visually represented in Figure 1(B). Consequently, the UFREI becomes more efficient, as it effectively shifts the fundamental period away from the critical high-energy range typical of seismic events. The process of rollover continues until the initially vertical faces of the bearing complete a 90° rotation and establish contact with the supports, resulting in a state referred to as full rollover (Figure 1C). Beyond this point, any further displacement leads to a stiffening lateral response while still maintaining lateral stability.7 Note that there are three phases that should be distinguished: the initial contact, full rollover, and beyond full rollover. Initial contact refers to the point where contact occurs during rotation, yet the free edge has not fully engaged the supports.8 It was identified in de Raaf8 that the initially vertical face of the isolator does not immediately contact the supports. Instead, contact gradually increases from the point of rotation along the height of the isolator, leading to a gradual stiffening in the force-displacement relationship prior to achieving full rollover.
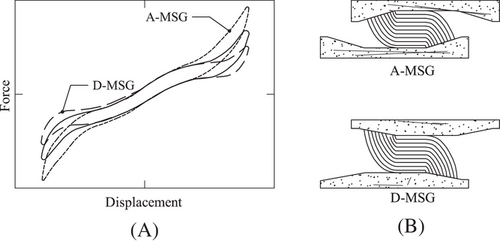
To alter the hysteresis behavior of UFREIs, some researchers have applied innovative methods such as creating holes in the UFREIs to lower the lateral stiffness and increase energy absorption9, 10 or using modified support geometry (MSG).11 The MSG technique aims to adjust the shape of the hysteresis curves by changing the surrounding support conditions. The main goal of this method is to accelerate or delay the stiffening phase of UFREIs while preserving the integrity of the softening phase.11 The concept of MSG that accelerate (A-MSG) or delay (D-MSG) full rollover and the normalized hysteresis curves of different levels of MSG are illustrated in Figure 2.
Various models have been developed and proposed for simulating the nonlinear behavior of UFREIs under dynamic loading conditions. The models exhibit distinctive attributes concerning accuracy, computational efficiency, and the number and mechanical significance of the parameters employed. For a reliable analysis of the seismic performance of structures with UFREIs, a model that can realistically represent the stiffness and damping features of the isolators is required.2, 12, 13 The hysteresis models for UFREIs can be categorized into two types based on the equation used to determine the output variable (i.e., the restoring force)14: differential models that use differential equations to express the variation of the force and displacement with time, and algebraic models that use mathematical equations to directly connect the force and displacement. Nagarajaiah et al.15 employed the Bouc-Wen model,16, 17 a widely adopted differential model in the literature, to simulate the behavior of SREIs under large shear strains. Chen and Ahmadi,18 Love et al.,19 and Manzoori and Toopchi-Nezhad20 later developed different versions of Bouc-Wen models that could capture the hysteretic behavior of SREIs and UFREIs. Vaiana et al.14 introduced an algebraic model that could simulate the rate-independent hysteretic behavior in mechanical systems and materials by solving an algebraic equation.14, 21, 22 The model by Vaiana et al.14 showed good accuracy for predicting the behavior of UFREIs, especially at low and intermediate displacements, while requiring less computational effort due to the absence of an ordinary differential equation (ODE) to solve and fewer parameters to fit compared to differential models (such as Bouc-Wen models).
These models have been shown to accurately predict the hysteretic behavior, especially at low and intermediate displacement levels.11, 14, 20 However, these models failed to fully match the experimental data at larger displacement levels beyond full rollover.11 To overcome this limitation, an impact model was added to the existing phenomenological models.23 The resulting hybrid model was then compared with the outcomes of previous experimental cyclic loading tests and shake table tests, which were performed under different conditions, such as varying shear strain levels, support geometries, and earthquake records.23 The results demonstrated that the integration of the impact model enhanced the efficacy of the current numerical models in capturing the behavior of UFREIs, particularly at larger amplitudes.
The primary aim of this paper is to comprehensively evaluate the performance of the included impact model when compared to other numerical models by developing fragility curves across various limit states and under different types of seismic excitations. For this purpose, four phenomenological models (i.e., the Bouc-Wen model with a fifth-order polynomial, the algebraic model with and without the impact model, and the elastomeric bearing (Bouc-Wen) element) were utilized. Note that these models are the most commonly used and applicable models available for UFREIs. While potentially more computationally efficient models such as bi-linear or trilinear models exist, they do not adequately capture the smooth transitions and adaptive characteristics inherent in these isolators. Moreover, the fragility curves of UFREIs supported on MSGs were compared to examine the impact of full rollover. This study is the first, to the authors’ best knowledge, to clearly demonstrate that the adaptive characteristics of UFREIs behave as an effective displacement restraint.
2 UFREI PHENOMENOLOGICAL MODELS
The algebraic model (AM) proposed by Vaiana et al.14 is a recent development for predicting the hysteretic behavior of UFREIs. The model relies on a set of five parameters (ka, kb, α, β1, and β2) and utilizes an algebraic equation to calculate the isolator's restoring force. The AM defines a force-displacement hysteresis loop using four types of curves, and each parameter in the model influences the size and shape of the hysteresis loops in a specific way. Compared to other phenomenological models like the MBWM, the AM offers several advantages. It requires less computational time since it does not involve an ordinary differential equation (ODE), and it has a smaller number of parameters (i.e., only five parameters compared to 12 in the MBWM). Vaiana et al.14 demonstrated that the AM yields results that closely match those obtained from the MBWM. The efficacy of the AM, along with its simplified implementation and reduced parameterization, make it a promising model for analyzing UFREIs.
To improve the accuracy of numerical models representing the behavior of UFREIs, particularly at full rollover, an impact model (IM) has been included in conjunction with existing phenomenological models.23 While the MBWM and AM accurately represent the hysteretic response of UFREIs at low and intermediate displacement amplitudes, they cannot fully capture experimental data at larger displacements, where significant energy dissipation occurs due to full rollover. The IM addresses this by accounting for energy dissipation during the contact between the elastomeric element and the supports, particularly during full rollover. Previous literature on structural impact has predominantly utilized analytical approaches, relying on two main techniques, which have limitations in representing energy dissipation.24, 25 To overcome this limitation, Muthukumar and DesRoches26 proposed an impact model that incorporates a nonlinear damper with a Hertz spring.27 The inclusion of the IM with the AM and MBWM was validated against previous experimental cyclic loading tests, as well as shake table tests for three earthquake records.23
The model parameters used to simulate the hysteresis loops were estimated by calibrating the numerical models to all cycle amplitudes simultaneously. The calibration involved minimizing the squared differences between the calculated force and the force measured during the experimental test. The model parameters and further validation results, encompassing both cyclic tests and shake table tests, can be referenced in Sheikh et al.23
3 SEISMIC FRAGILITY ANALYSIS
Seismic fragility analysis is performed to measure the probabilistic relationship between any given ground motion intensity measure (i.e., spectral acceleration, peak ground velocity, peak ground acceleration, and peak ground displacement) and the likelihood of system failure or reaching predefined limit states.28, 29 After a thorough review of various intensity measures analyzed in recent studies,30-32 and considering their practicality, efficiency, proficiency, and sufficiency as highlighted by Hariri-Ardebili and Saouma,32 Sa(T1) (i.e., the spectral acceleration determined at the period of the first mode) has been selected as the suitable intensity measure for this study due to its correlation with both ground motion and structural characteristics, aligning well with the requirements of the study and supported by its prevalent usage in similar base-isolated structure studies in the literature.33 Therefore, in this study, the spectral acceleration at the first mode of the base isolated structure was selected as the intensity measure, Sa(T1,5%), and shear strain of the base isolation system was defined as engineering demand parameter (EDP). Since the finite element model was considered to align with the characteristics of the experimental quarter-scale model,34 the period of the first mode has been taken as 0.5 s (1.0 s full-scale) based on the results of the previous experimental investigation.
3.1 Model description
To investigate the sensitivity of UFREIs phenomenological modeling techniques on seismic fragility, a finite element model was considered to represent a real structure. The analysis was performed using OpenSees 3.4.035 in two dimensions. The model consisted of a single bay, two-story prototype planar frame, which was designed to match the characteristics of the experimental quarter-scale model.34 All the analyses were conducted on the scaled model, and the results have been appropriately normalized or presented in full scale. Based on the literature, there is no evidence to suggest that scaled behavior is remarkably different from full scale for this type of device.36, 37 The cyclic loading test used specimens with the same properties as those used in the shake table testing, which was considered during the model verification process. The model parameters obtained from the cyclic test were used in OpenSees to model the behavior of the four numerical modeling techniques. The mass was evenly distributed among the nodes, including the nodes of the isolation layer. The beams and columns were modeled using elastic beam-column elements, assuming axial rigidity. It was assumed that the isolated frame remains elastic, a presumption confirmed by observing the negligible interstory drift. The experimental tests were conducted under a constant vertical load with level plates and rigid connections. Therefore, the rotational and vertical degrees of freedom at the isolators were held fixed, and these effects were not considered in the model. Consequently, the 2D model included an isolator element with a 3 × 3 stiffness matrix, featuring infinite axial and rotational stiffness but finite shear stiffness. The Elastomeric Bearing (Bouc-Wen) Element in OpenSees was used for the EBE model. However, the MBWM, AM, and AM+IM were locally implemented as uniaxial material objects in OpenSees for analysis convenience. Note that the AM was developed and incorporated into OpenSees as the HystereticPoly material model by Vaiana et al.38
3.2 Ground motion selection
Three distinct categories of ground motion sets were utilized to investigate the influence of ground motions on the seismic fragility of UFREIs while considering different modeling techniques. The ground motion suites chosen encompassed far field and near field motions, as documented by Baker et al.39 Previous research has demonstrated that diverse seismic excitations can impact on the seismic response of base-isolated structures.40-42 Given the dissimilarities in frequency content and amplitude between far field and near field earthquakes, it is imperative to study the sensitivity of UFREIs modeling techniques under these disparate types of seismic excitations. The Set #1A ground motion, selected by Baker et al.,39 encompassed a total of 40 motions that were chosen to align their horizontal response spectra with the median and log standard deviations projected for a magnitude 7 strike-slip earthquake occurring at a distance of 10 km. It was assumed that the average shear wave velocity in the top 30 m of the site was 250 m/s. The Set #1B ground motion was selected using the same procedures as Set #1A; however, the ground motions were chosen to match the response spectra predicted for a magnitude 6 strike-slip earthquake at a distance of 25 km. On the other hand, the Set #3 is categorized as pulse-like ground motions (which typically correspond to near-field events) and consists of 40 ground motions characterized by pronounced velocity pulses in the strike-normal direction. Further details regarding the specific ground motion records utilized can be found in Baker et al.39 Note that the input earthquakes were appropriately time scaled to suit the quarter-scale model, utilizing the similitude relationship.
3.3 IDA analysis method
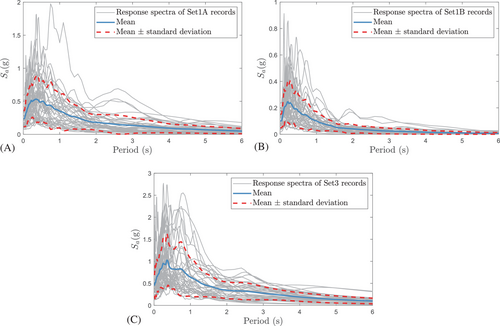
The incremental dynamic analysis (IDA) approach, ranging from the initial elastic stage to the critical point of collapse, was employed. Traditionally, a stepping algorithm has been used, where the intensity measure is incrementally increased by a constant step value from zero up to the collapse level. However, this approach has limitations. The number of steps required to reach the collapse state increases with changing records and higher collapse intensity measure values, resulting in slower analysis speed and variable accuracy distribution across different intensity measure levels. To overcome these challenges, the Hunt-Fill algorithm28, 29 was implemented in OpenSees for efficient IDA analyses. The Hunt-Fill algorithm initiates with a low level of spectral acceleration, representing the point at which the structure remains completely within the elastic range. Subsequently, the spectral acceleration values increase at each step using a predefined equation29 until the damage limit state is reached. This progressive increase in intensity allows for a comprehensive exploration of the dynamic response of the structure as it approaches the limit state. Once the damage limit state is reached through the hunting process, a bracketing stage is initiated to progressively decrease the gap between the stable-damaged sequential intensity measures to identify the highest non-damaged points. Then the filling step is employed to bridge the gaps between the points analyzed in previous iterations. By incorporating the filling step, the algorithm ensures a more detailed and comprehensive understanding of the structural response across the entire range of seismic intensities. Figure 3 visually presents the unscaled (based on time and acceleration) 5%-damped response spectra for the three ground motion sets.
3.4 Failure modes and collapse conditions
The failure modes of isolation systems depend on the type of isolation device employed. For UFREIs, shear failure is considered herein as the primary failure mode. The shear failure refers to the displacement amplitude at which delamination/failure occurs and/or the bearing loses lateral stability (i.e., has a negative lateral tangential stiffness). The shear failure, which is an important parameter in the analysis of bearings, is dependent on the specific type and dimension of the specimen under investigation. This value can be determined through experimental testing by incrementally increasing the displacement amplitudes. UFREIs have the capability to withstand a shear strain greater than 2.5 tr and have successfully been tested up to strains of 4.0 tr.34 However, most research studies have focused on testing up to a threshold of 2.5 tr,2 which has led to limited availability of data for higher shear strains. In this study, the shear strain limit of 2.5 tr was therefore adopted as the collapse criterion. Four damage states have been frequently defined in literature based on Hazus43 to describe the extent of damage in different structural components. The selection of appropriate damage states depends on the specific application, as they are utilized for assessing various response characteristics, limit states, or failure modes.28 For comparing the response of the numerical models, the focus has been on utilizing these four limit states, namely, slight, moderate, extensive, and collapse, to define different conditions for the UFREIs. The shear strain corresponding to each limit state for UFREIs is presented in Table 1, as determined by previous studies44 and observed in experimental tests.7, 8, 34 The extensive and collapse limit states indicate the possibility of changes in the properties of the isolation systems or, from a practical standpoint, are situations that are advisable to avoid. The collapse state represents the most severe condition, where the system experiences shear failure (or, in this case, exceeds a shear strain of 2.5 tr), rendering it ineffective in providing seismic protection. The extensive state, while not as severe as collapse, signifies significant deformation and potential changes in the isolator's properties due to the occurrence of full rollover (which is intended to provide a displacement restraint under large ground motions). The moderate state indicates the initiation of contact between the vertical faces of UFREIs and the supports which initiates the transition between softening and stiffening. The slight state refers to the deformation at which the upper and lower contact surfaces of the bearing start to roll off the supports. In this state, the lateral stiffness of the bearing experiences a decrease due to the reduction in the effective shear area. It indicates that the system has exceeded its elastic range and provides effective isolation.
| Limit state | ||||
|---|---|---|---|---|
| EDP | Slight | Moderate | Extensive | Collapse |
| Shear strain γ (tr) | γ > 1.0 tr | γ > 1.5 tr | γ > 2.0 tr | γ > 2.5 tr |
3.5 Developing collapse fragility functions
4 RESULTS: COMPARISON AND INTERPRETATION
4.1 Fragility curves
Figures 4-6 depict the fragility curves of the UFREIs for all limit states and for each set of earthquake records, respectively. Considering Set #1A ground motions (Figure 4), among the four numerical models considered, the AM+IM exhibited the lowest probability of exceeding the collapse limit state. For instance, at a spectral acceleration of 0.6 g, the AM+IM had a 57% probability of exceeding the collapse limit state, while the AM, MBWM, and EBE models had probabilities of 72%, 69%, and 70%, respectively. Therefore, compared to the AM+IM model, the MBWM, AM, and EBE models exhibited increases of 21%, 26%, and 23%, respectively. This outcome was expected, as a previous study23 indicated that the AM+IM model accurately captures the full rollover behavior of UFREIs, enabling a precise estimation of their behavior. In previous research findings, which compared the area enclosed within each cycle of hysteresis loops of the models to experimental results in a cyclic test, the AM, MBWM, and EBE models underestimated the enclosed area by 14%, 25%, and 9%, respectively, compared to the experimental data at 2.5 tr amplitude (i.e., equivalent to the collapse limit state). Whereas the prediction error was 5% for the AM+IM.
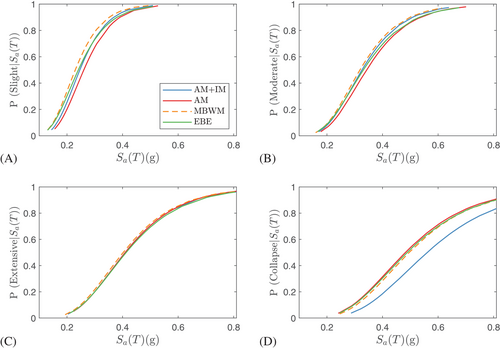
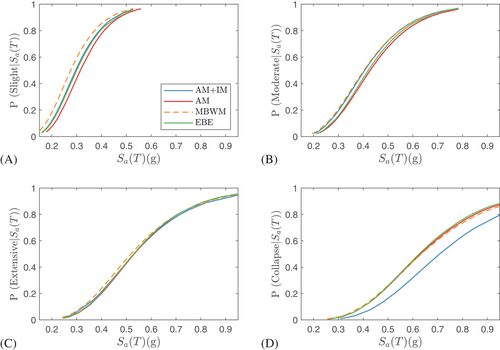
However, at the slight limit state (Figure 4A), the AM displayed the lowest probability of exceedance, while the MBWM showed the highest probability. At a spectral acceleration of 0.2 g as an example, the AM+IM had a 26% probability of exceeding the slight limit state, while the AM, MBWM, and EBE models had probabilities of 20%, 34%, and 30% respectively. Based on the previous experimental cyclic test results,23 the AM+IM showed the lowest error in capturing the UFREIs behavior at 1.0 tr. In the moderate plot (Figure 4B), the trend remained consistent with the slight limit state, although the AM and MBWM curves approached each other, resulting in smaller differences between them. In the extensive limit state (Figure 4C), both the AM+IM and AM models exhibited similar fragility curves. The previous findings which compared the area enclosed within each cycle of hysteresis loops of the models to experimental results in a cyclic test, showed that the AM and AM+IM both estimated the area with a small error at 2.0 tr amplitude (i.e., equivalent to the extensive limit state). The MBWM showed slightly higher vulnerability to the extensive damage state. However, the differences among the fragility curves of the four models in the extensive limit state were minimal.
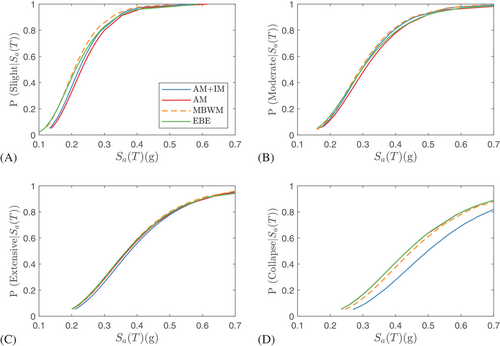
Fragility curves derived from the Set #1B ground motions (Figure 5) exhibit a similar trend to those obtained from Set #1A ground motions. Among all four models, the AM+IM model demonstrates the lowest probability of surpassing the collapse limit state. Specifically, at a spectral acceleration of 0.6 g, the AM+IM model demonstrates a 32% probability of exceeding the collapse limit state, whereas the AM, MBWM, and EBE models exhibit probabilities of approximately 45%. Consequently, in comparison to the Set #1A ground motions at the same spectral acceleration, the probability of exceeding the collapse limit state decreases in the case of Set #1B ground motions. This is due to the lower intensity or frequency content of ground motions in Set #1B resulting from the combined effects of distance, magnitude, and attenuation.
However, the results differed when considering Set #3, which can be considered representative of near-field earthquake records with a pulse. In Set #3, the AM+IM showed the lowest vulnerability in the collapse and extensive limit states, as shown in Figure 6 and the EBE and AM displayed the highest vulnerability in the collapse limit state. In the slight limit state (Figure 6A), the MBWM demonstrated the highest vulnerability, while the AM exhibited the lowest vulnerability. The trend observed in the moderate limit states (Figure 6B) was similar to the results observed in the fragility curves developed under the records of Set #1A and Set #1B. At a spectral acceleration of 0.6 g, the AM+IM demonstrates 70% probability of exceeding the collapse limit state, whereas the AM, MBWM, and EBE models exhibit probabilities of approximately 80%. Therefore, when comparing the results of the collapse limit state with Set #1A and Set #1B at the same spectral acceleration value, the probability of exceeding the collapse limit state increases in the case of Set #3 ground motions. This is related to the dissimilarities between the frequency content and amplitude of the ground motions within the Set #1A, Set #1B, and Set #3.
The fragility curves of UFREIs, particularly at the collapse limit state, were found to be sensitive to the numerical modeling approach. Considering the accuracy of the AM+IM as representative for UFREIs,23 it can effectively demonstrate the potential capacity of UFREIs by capturing the damping effects resulting from the full rollover phenomenon which yields a lower probability of exceedance.
4.2 Median fragility value
The median fragility value, referred to as the median exceedance capacity, denotes the ground motion intensity at which limit state exceedance occurs in 50% of the chosen ground motion records.46 Figure 7A-C presents the median spectral acceleration (Sa) values for the selected ground motion sets (Set #1A, Set #1B, and Set #3, respectively) and limit states (slight, moderate, extensive, and collapse) for the four modeling techniques. By comparing the values within each set and limit state, it is possible to observe trends and differences in the seismic response.
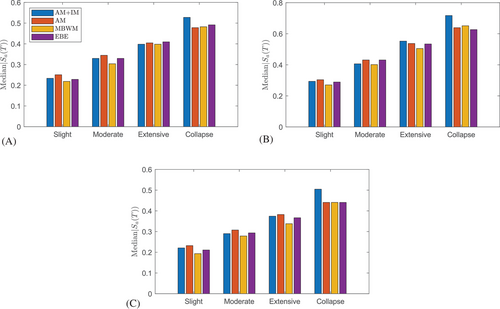
As the limit state progresses from slight to collapse, there is a consistent increase in the median Sa values across all numerical modeling techniques (i.e., a higher level of seismic intensity as the limit state becomes more severe). Comparing the numerical modeling techniques, the AM+IM consistently exhibits higher median Sa values at the collapse limit state compared to the other numerical modeling techniques. This indicates lower seismic vulnerability and increased resilience to seismic forces. For example, in Set #1A, the median Sa value for the AM+IM technique is 0.53 g, while it is 0.48 g for both the AM and MBWM techniques, and 0.49 g for the EBE model. Generally, Set #1B exhibits higher median Sa values compared to Set #1A and Set #3 across all numerical modeling techniques. For instance, at slight limit state, the AM+IM technique in Set #1B yields median Sa values of 0.29 g, while Set #1A and Set #3 have median Sa values of 0.23 g and 0.22 g, respectively. As the limit state progresses to moderate and extensive, similar patterns are observed and this trend continues across all modeling techniques in the respective sets. Moving to the collapse limit state, the median Sa values also follow a similar trend. For instance, the AM+IM technique in Set #1B yields a median Sa value of 0.72 g, while Set #1A and Set #3 have values of 0.53 g and 0.51 g, respectively. The same pattern can be observed for the AM, MBWM, and EBE techniques.
Table 2 presents the median spectral acceleration changes observed across various displacement increments for the records within Set #1A. In linear systems, a consistent linear trend in seismic intensity changes corresponding to each displacement increment is expected. The table reveals a pattern across all limit states up to 2.0 tr, wherein the change in median Sa increase is less than the transition from 0.0 to 1.0 tr (as denoted by the average value). This is indicative of the advantageous effect of softening in adaptive systems. An exception to this trend is evident only in the response of AM+IM model, wherein a substantial increase in median Sa becomes apparent at 2.5 tr. This signifies a substantial displacement restraint provided by full rollover. This is not evident in any of the other model responses (e.g., in the MBWM there is a decrease). This is only evident in the AM+IM due to the inclusion of the IM and its ability to accurately capture the adaptive behavior of UFREIs, particularly at full rollover.
| Limit state | AM+IM | AM | MBWM | EBE |
|---|---|---|---|---|
| 0.0 tr to 1.0 tr* | 0.12 | 0.13 | 0.11 | 0.11 |
| 1.0 tr to 1.5 tr | 0.10 | 0.09 | 0.09 | 0.10 |
| 1.5 tr to 2.0 tr | 0.07 | 0.06 | 0.09 | 0.08 |
| 2.0 tr to 2.5 tr | 0.13 | 0.07 | 0.08 | 0.08 |
- *Averaged based on a 0.5 tr increment.
5 EFFECT OF FULL ROLLOVER
Fragility analysis was also conducted to further investigate the effect of full rollover on the response of the UFREIs. The experimental data of an UFREI with modified support geometry (MSG) from Van Engelen et al.11 that accelerated (A-MSG), delayed (D-MSG), or left rollover unaltered (i.e., unmodified support geometry (USG)) was considered. The MSG was constructed using steel plates that were machined to the desired slope corresponding to the expected full rollover displacement. Fragility curves were then derived to investigate the sensitivity of the UFREI's response to changes in the stiffening regime. The AM+IM was considered for this investigation due to its capability to accurately capture the experimental force-displacement hysteresis in lower and higher displacement amplitudes where there is increased dissipation of energy due to full rollover. The hysteretic parameters of the AM+IM employed to simulate the hysteresis loops were calibrated to all displacement amplitudes of the experimental results simultaneously based on minimizing the squared residuals of the force.
The AM+IM and experimental hysteresis loops for different levels of MSG are shown in Figure 8. By applying MSG, the stiffness and damping vary at displacements exceeding full rollover, depending on the displacement amplitude and level of MSG. Accelerating full rollover and increasing the full rollover stiffness reduce the displacements at larger amplitudes and subsequently increase the restoring forces. The increased forces result in an increase in the structural and non-structural responses.11 However, by considering the imposed damping due to the full rollover phenomenon, the responses can be effectively balanced. Therefore, the IDA has been conducted to evaluate the effect of full rollover considering both the stiffness and damping properties at displacements exceeding full rollover. A shear strain limit of 2.5 tr was considered as the collapse criterion.

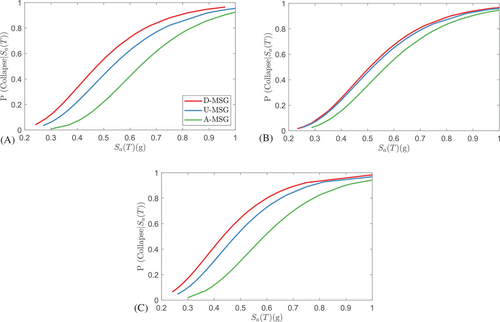
The performance of an adaptive device is also dependent on the ground motion characteristics, therefore, three ground motion sets (Set #1A, Set #1B, and Set #3) were also considered for the IDA. Figure 9 shows the fragility curves for the UFREI in the collapse limit state for each set of earthquake records. In all three sets of ground motions, the A-MSG exhibited the lowest probability of exceeding the collapse limit state, while the D-MSG showed the highest vulnerability to collapse. For instance, at a spectral acceleration of 0.5 g, the A-MSG had a 22%, 36%, and 31% probability of exceeding the collapse limit state at Set #1A, Set #1B, and Set #3, respectively. While the USG showed the probabilities of 43%, 46%, and 54%, respectively, and D-MSG had a 55%, 48%, and 64%, respectively. Therefore, compared to the USG, the A-MSG exhibited an average of 38% decrease in the probability of exceedance of collapse state, while D-MSG showed an average of 17% increase. This outcome was expected since in the cyclic test results accelerating full rollover increased the area enclosed within the cycles (representative of energy dissipation) by 27%, while delaying full rollover decreased it by 4% for this specific design. Note that the hysteretic loops, and subsequently the probability of exceeding values, will change based on the MSG design. Thus, the values represented in this study are valid for the specific MSG design considered. When comparing the fragility curves at the collapse limit state across three sets of earthquake records, the disparities between the fragility curves of different levels of MSG are more pronounced in Set #1A and Set #3 as compared to the curves observed in Set #1B ground motions. This demonstrates how the full rollover effect on the UFREI behavior is sensitive to the near-field ground motions and confirms their potential to behave as a displacement restraint due to their adaptive characteristics.
6 CONCLUSIONS
- The fragility curves of UFREIs were found to be sensitive to the modeling approach, highlighting the importance of accurate modeling of UFREIs for assessing the seismic vulnerability of structures.
- The AM+IM exhibited the highest median spectral acceleration values at the collapse limit state and the lowest probability of exceeding the collapse limit state, indicating its potential capacity to capture damping effects resulting from the full rollover phenomenon and provide more precise predictions of UFREI behavior at larger displacement.
- For the slight limit state, the AM model displayed the lowest probability of exceedance, while the MBWM showed the highest probability.
- Accelerating full rollover decreased the probability of exceeding the collapse limit state while delaying full rollover increased it. This confirms full rollover of UFREIs’ potential to behave as a displacement restraint at larger amplitudes due to their adaptive characteristics.
- The disparities in fragility curves of different MSG levels were more pronounced in near-field ground motions, revealing the sensitivity of full rollover effects on UFREI behavior to near-field ground motions.
ACKNOWLEDGMENTS
The authors acknowledge the support of the Natural Sciences and Engineering Research Council of Canada (NSERC) [funding reference number RGPIN-2019-03924 and RGPIN-2019-04332].
Open Research
DATA AVAILABILITY STATEMENT
The data that support the findings of this study are available from the corresponding author upon reasonable request.


