Process Engineering Analysis of Transport Options for Green Hydrogen and Green Hydrogen Derivatives
Abstract
The transition of the German economy and energy system toward CO2 neutrality requires large quantities of climate-friendly chemical energy carriers, such as green hydrogen, to be imported. The decision on the most favorable import routes must consider its energy efficiency. To respect the remaining CO2 budget to achieve the 1.5° climate target, the implementation time and therefore additional evaluation criteria must be taken into account. In this article, as a first step, the energy utilization rate () for different hydrogen import options is evaluated. Starting off from hydrogen at 25 °C and 25 bar produced in the exporting country, liquid hydrogen, ammonia, liquid methane (Green LNG), methanol, and liquid organic hydrogen carrier are considered as chemical energy carries. Liquid hydrogen is in future the most efficient import option ( = 73%) when gaseous hydrogen is supplied in the importing country. When direct utilization of the H2 derivatives is considered, the ammonia import route has the highest energy utilization rate with 77%. If point sources for CO2 are considered, direct utilization of methanol ( = 83%) and Green LNG ( = 76%) are energetically favorable import options. Additional significant criteria for a technological assessment are maturity of technologies, available capacities, infrastructures, and production processes.
1 Introduction
Green hydrogen will play an important role in future climate-neutral energy supply and for energy security in Germany. Hydrogen demand in Germany is expected to rise significantly over the next 20–30 years. Depending on the scenario, the projected energy demand for hydrogen in 2045 ranges from 50 to 430 TWh (lower heating value [LHV]).[1-3] While some of the hydrogen demand can be met locally, hydrogen imports will be required. For greater transport distances, such as hydrogen imports from North or South America, pipelines are not a feasible option. Therefore, the transport of hydrogen by ship will be crucial in the future. In addition to the liquefaction of hydrogen, there are other options for shipborne hydrogen transport. For this purpose, hydrogen can be converted into other chemical energy carriers, known as H2 derivatives.
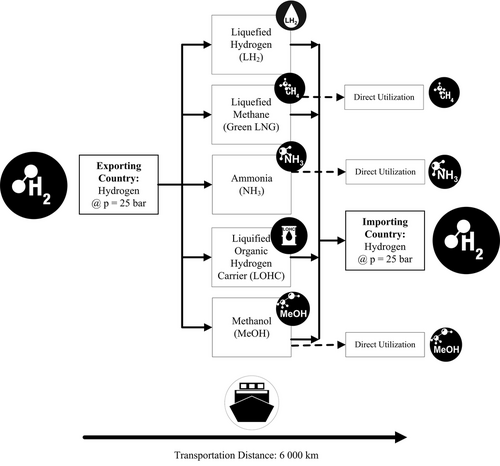
The following hydrogen transport options are discussed in the context of this study: liquid hydrogen (LH2), liquid methane (Green LNG), ammonia (NH3), liquid organic hydrogen carrier (LOHC), and methanol (MeOH).
Several criteria can be used to technically evaluate an import option, shown in Figure 1. The technical evaluation criteria mentioned are: technological readiness of the steps in the process chain of the import options, shipping infrastructure, volumetric energy density, and handling of the energy carrier. This list is by no means complete and can be further expanded.
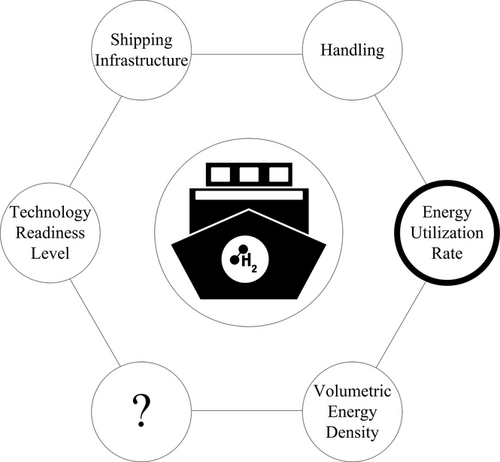
In the first step, this study focuses on the energetic utilization rate, i.e., how much energy is required to transport hydrogen or its derivatives to the importing country.
Figure 2 provides an overview of the content which is covered in this study. While conversion back to hydrogen is possible and considered for each transport option, some H2 derivatives can also be used directly in the importing country. For Green LNG, ammonia, and methanol, direct utilization was therefore considered in addition to conversion back to hydrogen. Most studies focus on single energy carriers or their associated costs of import.
International Renewable Energy Agency (IRENA) 2022 evaluates NH3, LH2, and LOHC for hydrogen import;[4] Staiß et al. 2022 compares import options by ship for LH2, NH3, MeOH, and Fischer-Tropsch products.[5] While Hank et al. 2020 also regard the same energy carriers as this article (LH2, LOHC, CH4, MeOH, and NH3), for H2 derivatives CH4, MeOH, and NH3, no reconversion (cracking or reforming) in the importing country was investigated.[6] The Joint Research Center (JRC) Report by Ortiz et al. 2022 focuses on LH2, NH3, MeOH, and LOHC, missing hydrogen import trough CH4.[7] On the contrary to the Agora Industrie report by Carels et al. 2023 who considers primarily CH4.[8]
This publication discusses a greater number of import options (5 in total: LH2, Green LNG, NH3, MeOH, and LOHC) compared to the previous mentioned publications. To be able to compare the energy utilization rate of the import options LH2, Green LNG, NH3, MeOH, and LOHC, it is essential that the same assumptions are made in all calculations. This cannot be guaranteed by comparing different studies with therefore different assumptions. For this reason, in this study, energy calculations for each import option are carried out with the same assumptions to be able to evaluate and compare the import options in terms of energy utilization.
For the conversion in the exporting and importing countries, the processes and their respective reaction conditions are also discussed. For energy carriers that exist in gaseous form under standard conditions, the boil-off rates (BORs) are also taken into account. To compare the import options with each other, the energy utilization rate of the import options was estimated with the help of the energy requirements. While energy requirements of each step of the process chain were examined, heat utilization between different steps of the process chain or the hydrogen production was not considered. This results in lower degrees of energy utilization than an optimally interconnected process chain.
This article provides a better and deeper understanding of the necessary steps of the process chain to import H2 via H2 derivatives.
2 Methodology
Despite the fact that energy requirements for different steps of import options vary, there are common assumptions for all import options. This study investigates the conversion of hydrogen in countries of import and export, as well as its storage, loading, and transport. The production of green hydrogen is not a part of the calculations. While the transportation of hydrogen via pipeline is an option for import from relatively short distances, for crossing longer distances, transportation with ships is unavoidable. In this study, the transportation distance is assumed to be 6000 km, equaling the distance between North America and Germany. The duration of the transport results from the speed of the ship and the transport distance. It is assumed that the boil-off is in general reliquefied on board. An exception is the transport chain Green LNG, where the vessels operate with the ensuing boil-off. The storage period in the exporting country is assumed to be 7 days for all transport options. The assumption was made based on the travel time of the LNG carrier, which requires about 7 days at ≈ 20 knots, for the distance of 6000 km. It is therefore possible to operate one terminal in the exporting country with two ships. The storage period in the importing country was assumed to be 4 days. It was assumed that the takeover of hydrogen in the exporting country from electrolysis and importing country is in gaseous form at 25 bar and 25 °C.
kg is the amount of hydrogen produced in the exporting country in kg describes the amount of hydrogen required in the importing country in kg; Hydrogen or H2 derivatives can be used either as ship fuel or as a combustion medium for conversions in the importing country. Therefore, the amount of hydrogen that is produced in the exporting country can be higher than the amount of hydrogen that can be used in the importing country. is the LHV of hydrogen in kWh kg−1. All energy content in this article is based on LHV. The electrical energy required in the process chain, for example necessary for compression of hydrogen, is in kWh. Chemical energy, such as fuel for vessels, is considered with in kWh. A detailed literature research was carried out for each and the results are presented in Section 3. All calculations in this publication are based on literature data. As only the individual process steps are considered in this study, there are no interconnections between the processes with electrolysis units. Therefore, no heat usage could be considered. Otherwise, exothermic losses could have been much lower.
3 Hydrogen Transport Chains
All hydrogen transport chains can be divided into the following steps: conversion of gaseous hydrogen to H2 derivatives in the exporting country, storage and loading in the exporting country, shipping to the importing country, unloading, storage, and reconversion of H2 derivatives in the importing country. For methanol, methane, and ammonia, the direct utilization in the importing country is also considered.
3.1 LH2
LH2 is neither toxic nor corrosive, yet handling is challenging due to the low temperatures required. Hydrogen is liquid at ambient prerssure and −253 °C.
In Figure 3, the complete process chain of importing hydrogen as LH2 is shown.

3.1.1 Processing in Exporting Country
Although hydrogen liquefaction has been known since 1898, no large-scale hydrogen liquefaction plants exist at present. In 2019, global daily LH2 production was 358 t d−1.[9] The largest plant in the U.S. has a capacity of 35 t d−1 or 120 MWh d−1.[10] For comparison, the largest liquefied natural gas (LNG) liquefaction plant has a capacity of 10 million tons per year, equaling to 380 GWh d−1.[11]
Cooling hydrogen for liquefaction to −253 °C requires an energy-intensive process. Small plants available today have an approximate energy requirement of 10–15 kWh kg−1 H2, which corresponds to 30% of the energy contained in the hydrogen based on LHV. For comparison, liquefaction of LNG takes around 5% of the energy contained in LNG. Energy requirements of 4–10 kWh kg−1 H2 are predicted for large hydrogen liquefaction plants in the future.[4, 12]
3.1.2 Storage and Loading
Presently, LH2 tanks are available, but only on a limited scale. NASA is currently operating tanks with volumes of ≈3800 m3, which corresponds to 9 GWh energy.[13] Kawasaki is developing LH2 tanks with 10 000 m3 capacity.[14] Boil-off in state-of-the-art LH2 tanks is about 0.05–0.1% d−1. With increasing tank capacity, boil-off will become easier to reduce.[7, 15] When transferring LH2 from tank to ship, about 1% of the pumped cargo evaporates.[16] All boil-off gas is assumed to be reliquefied immediately. The energy required for pumping LH2 at the import and export port is assumed to be 1 kWh kg−1 H2.[16, 17]
3.1.3 Shipping
Only one ship has been built so far to transport liquid hydrogen. In 2022, Kawasaki Heavy Industries constructed the LH2-Carrier “Suiso Frontier”.[18] Currently, it is traveling between Australia and Japan and transporting hydrogen from Australia to Japan. The Suiso Frontier has a loading capacity of approximately 1300 m3 or 3 GWh of LH2. Kawasaki declared its intention to construct a LH2 carrier with a capacity of 160 000 m3 or 380 GWh LH2.[14] In this study, this vessel is assumed to have a similar energy consumption as a state-of-the-art LNG carrier.
W. Amos estimates the boil-off during the shipment of liquid hydrogen to be 0.1–0.6% d−1.[19] No actual data on boil-off in LH2 in vessels is available. Smith et al. modeled the boil-off and sloshing in LH2-Carriers and found the BOR to be around nine times higher than in LNG-Carriers.[20] As more LH2 ships are built, the real BOR will become more apparent. In this study, it has been assumed that in future ships, reliquefaction systems will be available on board to utilize the gas formed because of boil-off.
3.1.4 Processing in Importing Country
Liquid hydrogen, similar to LNG, must be regasified at the import site. This step is yet to be demonstrated at an industrial scale, as there are currently no LH2 terminals. Analogies could be made with LNG regasification, so this step is expected to be feasible in the future.[21] Usually, cryogenic fluids are vaporized using evaporators heated with sea water. Electric energy demand for this step was assumed to be similar with LNG regasification, which is about 1% of the transported energy. If consumers are available, the cold energy of LH2 regasification could be utilized.[22]
3.2 Green LNG
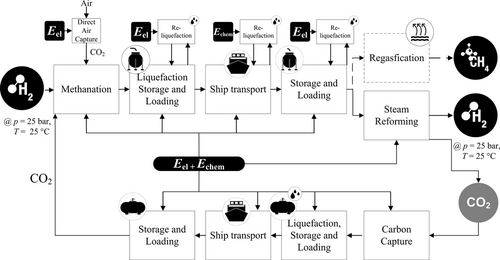
Methane is gaseous under standard conditions, but it can be converted into the liquid phase at ambient pressure and −161.5 °C. It can either be converted to hydrogen in the importing country or injected to the gas grid, and it can be utilized directly in the importing country. Figure 4 shows the process chain of Green LNG. The direct utilization of methane is presented in the dashed line. The CO2 pathway is also represented. Since not all CO2 can be captured in the importing country, the missing 10% of CO2 for synthesis in the exporting country can be extracted from the air using direct air capture (DAC).[23]
3.2.1 Conversion in Exporting Country
3.2.2 Storage and Loading
Due to the flourishing LNG trade, high storage capacities of LNG are currently available worldwide. The worldwide LNG storage capacity is around 70 million m3. Japan, China, and South Korea have the largest storage capacities. Their share is over 60% of the world capacity.[11] Boil-off during storage lies between 0.012% and 0.12% d−1 and is assumed to be liquefied immediately.[22, 32] The required energy to pump the Green LNG at the harbor is 5 × 10⁻⁴ kWh kg−1 CH4.[33]
3.2.3 Shipping
Green LNG is comparable to fossil LNG and global shipping of LNG is already established. In 2021, around 370 million tons of LNG was supplied to customers all over the world.[34, 35] A large fleet of 641 LNG carriers is already available with average capacities ranging from 70 000 to 180 000 m3 or 410–1000 GWh.[10] Vessel data sheets for LNG carriers with capacities of 174 000 m3 from capital gas indicate BORs of 0.085% d−1 and fuel consumption of 77 t d−1 LNG.[36] Furthermore boil-off gas can be used to propel LNG carriers.[37]
3.2.4 Reconversion in Importing Country
Part of the methane is burned to provide the necessary heat for the endothermic reaction (Equation (3)). After SR, carbon monoxide must be shifted to maximize hydrogen output. According to the project Roadmap Gas 2050, 50 kWh of methane is needed to produce 1 kg of H2 through SR.[28] Additionally, the SR and carbon capture steps require 1 kWh kg−1 of electric energy each.[28] Considering these energy requirements, a steam reformer with carbon capture system works only at an efficiency of about 65%, which raises interest in the direct utilization of methane instead of SR in the importing country.[38]
3.3 Ammonia
Ammonia is gaseous at room temperatures but can be liquefied at much higher temperatures than hydrogen or methane. At ambient pressure, −33 °C is sufficient for liquefaction and at ambient temperature, approximately 9 bar of pressure is required. If ammonia is converted to hydrogen, special attention must be paid to the purity, since ammonia is toxic to proton exchange membrane fuel cells even in ranges of a few parts per million, so cracking processes with high turnovers or effective treatment processes must be developed.[39] The complete process chain for the import of hydrogen through NH3 is represented in Figure 5. Since the direct utilization of ammonia is also an option, this pathway is shown with a dashed line. Ammonia is in general suitable to be used as a fuel for internal combustion engines. However, combustion of NH3 causes NOx emissions. Reduction NOx emissions requires high pressure and an abundance of NH3 in the fuel air mixture. There is still need for research in this field to fully understand NH3 combustion and NOx formation.[40]

3.3.1 Conversion in Exporting Country
The highly optimized ammonia synthesis from natural gas reaches efficiencies around 66%, which will be the benchmark for electrolysis-based processes. However, the efficiency is mainly affected by the energy requirements for electrolysis.[44] High purity of N2 from air separation unit (ASU) and H2 from electrolysis allows the Haber–Bosch process to be carried out minimized purge stream.[42] The required energy for the ASU varies between 0.1 and 0.17 kWh kg−1 NH3 in published literature and the Haber–Bosch Synloop consumes 0.33–0.75 kWh kg−1 NH3.[43, 45-47]
3.3.2 Storage and Loading
Ammonia storage is already established commercially and can be carried out in the liquid state, which can be achieved by applying low temperatures or elevated pressures. Smaller tanks with capacities of around 300 t store NH3 pressurized at 18 bar, larger tanks are refrigerated and store ammonia at −33 °C and atmospheric pressure.[48, 49] Refrigerated ammonia tanks can reach storage capacities of up to 45 kt. While storing ammonia, around 0.04% d−1 will evaporate (boil-off) and is usually reliquefied immediately.[50] Loading of ammonia takes about 5 × 10⁻⁴ kWh kg−1 NH3.[33]
3.3.3 Shipping
Ammonia is shipped at similar conditions as LPG. LPG vessels could be retrofitted to carry NH3.[51] To this date, NH3 is mostly traded as a precursor to fertilizer production, leading to global trade in the order of 20 MT year−1 equaling around 100 TWh year−1.[50, 52] Capacities of existing NH3 carriers vary between 30 000 and 70 000 m3 or 100–250 GWh, although construction of larger carriers would be possible.[53] To this day, NH3 carriers have been propelled by heavy fuel oil (HFO). The development of marine combustion engines which use ammonia as an energy source is advanced and expected to be available within a few years. Based on a vessel data sheet of Hartmann Reederei, a carrier size of 35 000 m3 and a fuel consumption of 37 t d−1 was assumed in this study.[51] Large-scale ammonia shipping uses ammonia in liquid form at −33 °C and atmospheric pressure; therefore part of the cargo will evaporate.[48] This boil-off is usually reliquefied in the vessel.[53] According to Al-Breiki et al. boil-off is around 0.024% d−1, resulting in additional energy consumption of 0.224 kWh kg−1 NH3 for liquefaction.[33, 54]
3.3.4 Reconversion in Importing Country
ThyssenKrupp Uhde GmbH has announced to build a commercial NH3 cracker, but the timeline remains uncertain.[56] In this article, an average energy consumption of 8 kWh kg−1 H2 for NH3 cracking and 2 kWh kg−1 H2 for the subsequent product separation via pressure swing adsorption (PSA) was assumed.
Literature offers a wide range of 6–16 kWh kg−1 H2, for NH3 cracking. Availability of real-plant data will most likely enable better assessment of the feasibility and energy demand of ammonia cracking.[4, 57, 58]
3.4 LOHC
Another option to import hydrogen is to chemical bind the hydrogen to an LOHC. In this study, dibenzyl toluene (DBT) is considered, since it is one of the most widely studied LOHC.[59, 60]
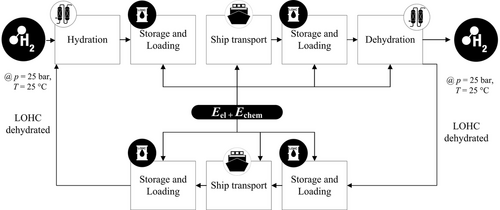
The process chain for hydrogen import with LOHC is presented in Figure 6. It includes the conversion in the exporting country, the hydrogenation, the storage and loading in the exporting country, shipping of the carrier, and the unloading and storage in the importing country and also its dehydrogenation in the importing country. To complete the cycle, LOHC is shipped back to the export county to be reused.
3.4.1 Conversion in Exporting Country
If 1 mol of DBT is hydrogenated with 9 mol H2, it can carry up to 6.2 wt% of hydrogen.[61] This corresponds to 2 kWh kg−1. The process conditions are 150 °C and 50 bar; therefore it is necessary to compress the hydrogen from 25 to 50 bar beforehand.[4]
Due to the strong exothermic reaction, the reactor needs a cooling system to maintain a constant temperature of 150 °C. The electric energy required for the conversion in the exporting country consists of energy needed for compression of hydrogen to 50 bar and electric energy for the synthesis. The information on the energy requirement of hydrogenation in the literature ranges from 0.4 to 1.8 kWh kg−1 H2.[62-64] Since the hydrogenation takes place at elevated pressure, part of the hydrogen is also physically stored in the DBT.[65] Since LOHC is transported under atmospheric conditions, the pressure and temperature are then reduced to ambient pressure and temperature. The pressure and temperature reduction releases the dissolved hydrogen. This only accounts for 2% of the hydrogen. The amount was estimated with Henry coefficients, which were determined by Aslam et al.[65] The additional energy required to compress the released hydrogen back at 50 bar is about 0.05 kWh kg−1 and comparable small to the overall energy of hydrogenation and therefore in the following neglected.
3.4.2 Storage and Loading
The physical properties of DBT allow for storage at room temperature and pressure (25 °C and 1 bar). The viscosity and the density of DBT are similar to diesel.[61] The vapor pressure is negligible; therefore boil-off is not expected. This simplifies the pumping and storage of DBT in refinery facilities, even over longer periods of time.[7] The energy required to pump DBT into a vessel is 0.0023 kWh kg−1 DBT.[66]
3.4.3 Shipping
An advantage of the similar properties of DBT and diesel is that fuel transport chains are already established for diesel and can be used for DBT. For example, in 2021, the worldwide transported quantity of clean petroleum products was ≈1225 Mio. t.[34] The average capacity of oil carriers is 100 000 m3, with the possibility to use even larger vessels.[67] A carrier with a capacity of 100 000 m3 can carry an equivalent of 190 MWh of hydrogen, related to the LHV.
3.4.4 Reconversion in Importing Country
Since the dehydrogenation is an endothermic reaction, a high reaction temperature above 300 °C is necessary to archive reasonable reaction rates.[68] After leaving the reactor, hydrogen and DBT are cooled down and separated in a heat exchanger. The dehydrogenated DBT is stored and shipped back to the exporting country. As the reaction is carried out at ambient pressure, hydrogen must be compressed to 25 bar to match the required boundary conditions (Section 3). This will however create an urgent need for large compressors in the importing country. There are currently no large dehydrogenation plants present. About 0.1 wt% of DBT degrades in a transport cycle, including hydrogenation, transport, and dehydrogenation. In every cycle, that amount of DBT needs to be replaced. For example, a ship with the capacity of 100 000 m3 can carry about 84 000 t of DBT. For comparison, the annual global DBT production capacity is about 9000 t a−1. The production of the DBT has an energy requirement of 12.12 kWh kg−1 DBT.[4, 69]
3.5 Methanol
Methanol (MeOH) is the simplest alcohol and is liquid under standard conditions.
The process chain for MeOH closely resembles the Green LNG process chain. The process steps (Figure 7) include MeOH synthesis, storage, and loading, shipping to the import country, unloading, storage, and reconversion to hydrogen through SR.
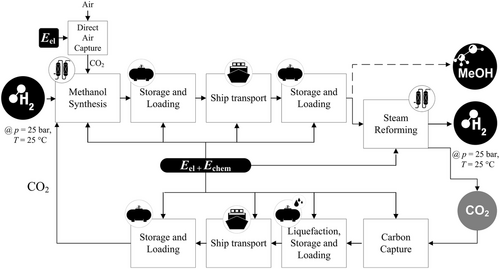
While the synthesis in the exporting country has a high CO2 demand, the synthesis in the importing country releases CO2. This CO2 can be captured with the help of carbon capture techniques. The capture efficiency is ≈90%. CO2 can then be liquefied and transported back to the exporting country by ship. The missing 10% CO2 for synthesis in the exporting country can be obtained from the air by DAC.[23]
Since methanol can also be used directly both as a chemical energy carrier and as an important basic chemical, direct utilization was also considered in this study (shown as a dashed line in Figure 7). In this case, no return transport of CO2 was assumed. All CO2 required for the methanol synthesis was obtained with DAC in the exporting country.
3.5.1 Conversion in Exporting Country
The reforming is conducted at 200–250 °C and 50–80 bar with a Cu/Zn/Al2O3 catalyst. Due to the exothermic reaction, cooling of the reactor is necessary. In a single reactor pass, only 50–80% of the reactants are converted to MeOH, this means that part of the reactants must be recycled.[70] In addition to MeOH, water is also produced. In a further step, the water is separated from the MeOH. As an important basic chemical, annual methanol production exceeds 100 million tons. Today, methanol is largely produced from fossil synthesis gas (Equation (9)).
In the future, Green LNG will be produced directly from hydrogen and CO2 (Equation (10)). In the process, large amounts of water will also be produced, which can have an influence on catalyst activity and service life. Catalyst research is therefore needed for Green LNG synthesis.[70] Currently 24 facilities for Green LNG production worldwide exist or are planned with a capacity around 844 thousand tons. Making up less than 1% of the current global production.[71, 72]
3.5.2 Storage and Loading
The next step in the process chain is the storage and loading of the MeOH at the export port. Storage of MeOH is possible at ambient temperature and pressure.
The energy demand for pumping MeOH is 05 × 10−4 kWh kg−1 MeOH.[33]
3.5.3 Shipping
MeOH is liquid at ambient temperature and pressure. It can therefore be transported under these conditions. With low BOR of 0.005 wt% d−1, the boil-off can be neglected.[33, 73] MeOH vessels have a capacity of up to 120 000 m3 or 520 GWh.[74] Clean petroleum product vessels could also be used to transport MeOH. Presently, research is being conducted into the use of MeOH as a marine fuel. MAN Energy Solutions SE is currently working on dual-fuel engines that can use both diesel and MeOH for propulsion.[75]
3.5.4 Reconversion in Importing Country
While small methanol steam reformers exist for fuel cells, only a few concepts are found for larger plants.[77]
A PSA is used to meet the required gas quality.[78]
The off-gas from the PSA contains a mixture of CO2, CO, H2, and MeOH and is fed back into the SR furnace. CO2 from the SR furnace exhaust gas is removed and liquefied in the next step. About 90% of the CO2 in the exhaust gas are captured.[28] With a suitable ship, the liquefied CO2 gets transported back to the importing country and can be reused in the MeOH synthesis. The Stella Maris CCS project plans CO2 ships with a capacity up to 50 000 m3.[79]
4 Comparison of Different Hydrogen Transport Chains
To compare the energy carriers for importing hydrogen, the different transport options were examined based on their energy utilization ratio and additional (technical) evaluation criteria, such as volumetric energy density, TRL, global production, and handling.
4.1 Energy Utilization
Based on the literature described in Section 3, energy requirements were determined for each process step of the various hydrogen import options. Table 1 shows the assumptions which are made in this study. The respective literature sources are also listed. The BORs of the process steps storage and loading as well as shipping are presented in Table 2.
| Energy requirement | LH2 | Green LNG | NH3 | LOHC | MeOH |
|---|---|---|---|---|---|
| Conversion export country | 8 kWh kg−1 H2 (liquefaction)[4, 12] | 0.3 kWh m−3 CH4 (methanation)[81] 2.2 kWh kg−1 CO2 (DAC)[29, 81] |
0.556 kWh kg−1 NH3 (Haber–Bosch)[43, 45-47] 0.15 kWh kg−1 NH3 (ASU) |
1.5 kWh kg−1 H2 (hydrogenation and compression)[62-64] |
3 kWh kg−1 H2 (methanol synthesis)[82] |
| Storage and loading | 1 kWh kg−1 H2 (pumping)[16, 17] |
0.7 kWh kg−1 CH4 (liquefaction)[22, 31] 5 × 10⁻⁴ kWh kg−1 LNG (pumping)[33] |
5 × 10⁻⁴ kWh kg−1 NH3 (pumping)[33] 0.224 kWh kg−1 NH3 (liquefaction)[54] |
1.2 × 10⁻³ kWh kg−1 H2[66] (pumping) | 5 × 10⁻⁴ kWh kg−1 MeOH (pumping)[33] |
| Shipping | 160 000 m3[14, 36] 92 t (HFO) d−1 (similar to LNG carrier) | 180 000 m3[36] 77 t (LNG) d−1 | 87 000 m3[83] 37 t (HFO) d−1 | 112 000 m3[74] 35 t (HFO) d−1 | 112 000 m3[74] 35 t (HFO) d−1 |
| Reconversion in import country | 0.33 kWh kg−1 H2 (regasification) |
16.67 kWh kg−1 H2 (steam methane reforming)[28] 1 kWh kg−1 CO2 (carbon capture)[28] |
8 kWh kg−1 H2 (cracking)[4, 57, 58] 2 kWh kg−1 H2 (PSA)[4] |
11 kWh kg−1 H2 (dehydrogenation)[68] 1.5 kWh kg−1 H2 (compression of H2)[84] |
12.9 kWh kg−1 H2 (steam reforming)[85] 1 kWh kg−1 CO2 (carbon capture)[28] |
Based on the energy requirements and BORs of the individual process steps assumed in Table 1 and 2, the energy utilization rate of the individual import options was calculated using Equation (1) (see also Section 2, Methodology). The unit used is kWh kWh−1, describing the energy requirement in kWh to obtain one kWh in the importing country. Where necessary, other units from the literature were converted using the stoichiometry and LHV of the respective reactions and derivatives. The fuel consumption of the ships in kWh per kWh was calculated using the transporting distance as well as the speed and capacity of the vessel. The resulting energy utilization rates of the import options are shown in Table S1, Supporting Information and Figure 8. In addition, the energy requirements of the import options were grouped in “conversion in the exporting country”, “loading and unloading” “ship transportation”, and “conversion in the importing country” and totaled. The energy requirements of the individual process steps are also shown in Table S1, Supporting Information.
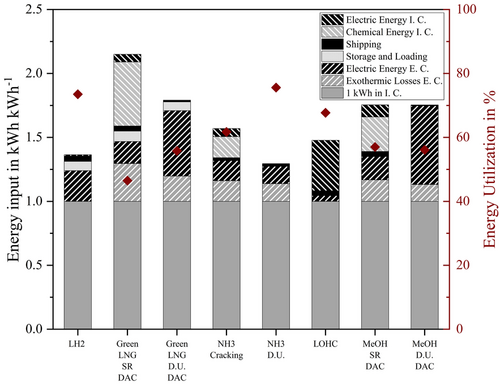
Figure 8 depicts the energy of each process step which is required for one kWh (LHV) in the importing country for each importing option (LH2 or H2 derivatives: LOHC, MeOH, NH3, and Green LNG). The process steps are conversion in the exporting country, loading and unloading, ship transportation, and conversion in the importing country.
In addition to the subdivision process steps, it is also distinguished between the type of energy: conversion losses due to the exothermy of the reaction, electrical energy, or chemical energy needed for heating. The electrical energy demand in the exporting and importing country is shown in black stripes. Exothermic losses in the exporting country as well as chemical energy needed in the importing country are shown in gray stripes, shipping in black, storage and loading in gray. The lower the energy input in kilowatt-hour per kilowatt-hour, the higher the energy utilization rate. The one kWh available in the importing country is represented by the solid gray bar. Everything provided earlier represents the additional effort which is needed to import hydrogen.
If the direct utilization of the derivatives is considered for MeOH and Green LNG, the electrical energy requirement in the importing country increases to 0.51 and 0.62 kWh kWh−1 for MeOH and Green LNG. The direct use of the derivatives in the importing country eliminates the need to capture and transport the CO2 back. CO2 must therefore be supplied to the exporting country in a different way. In the first step, a DAC, an energy-intensive process, was therefore assumed, but other ways of supplying CO2 are also conceivable.
The influence of the source of CO2 to the energy demand is later discussed in this article. The liquefaction of hydrogen consumes about 0.24 kWh kWh−1. In comparison, that is only half of the electric energy required in the exporting country for direct utilization of Green LNG or MeOH. It is therefore the process step with the highest energy consumption in the LH2 process chain.
Energy is released in the form of heat during all exothermic conversions in the exporting country these processes are Haber–Bosch synthesis for NH3, methanation for Green LNG, hydrogenation for LOHC, and methanol synthesis for MeOH. The import option MeOH direct utilization has the smallest exothermic losses with 0.13 kWh k h−1. While during importing hydrogen through Green LNG with SR, 0.3 kWh kWh−1 are lost due to the exothermic reaction.
The energy required for storage and loading is comparable small for NH3, MeOH, and LOHC with Eel < 0.003 kWh kWh−1. When energy carriers, that must be stored or loaded in extremely cold temperatures, remain liquid, this energy is much larger. Methane is liquid at −161 °C and LH2 at −253 °C. So, boil-off is much larger and needs to be reliquefied. Boil-off occurs not only during storage but also during pumping the cold liquids. The liquefaction of hydrogen in particular requires a significant amount of energy. It consumes approximately six times as much energy as methane liquefaction (based on LHV).
The actual ship transport has the lowest energy consumption of all process steps. That is true for all importing options, even if CO2 is shipped back to the exporting country in a separate vessel. It accounts for between 0.006 kWh kWh−1 (MeOH direct utilization) and 0.05 kWh kWh−1 (NH3 direct utilization).
Because of its endothermic nature, the reconversion of H2 derivatives to hydrogen in the importing country is energy intensive. Methane SR has the highest chemical energy demand with 0.5 kWh kWh−1 in this context. Although information in literature about the energy demand for ammonia cracking, methanol reforming, and LOHC dehydrogenation is available, none of these processes are currently available commercially. Hence, exact information on energy consumption for existing large-scale plants is only available for methane reforming.
The import option via LH2 is thus the most efficient and apart from liquefaction, no energy-consuming syntheses and thus no exothermic losses are present.
The import options with the highest energy utilization rate above 70% are LH2 (73%) and direct utilization of NH3 (77%).
For LH2, this is due to the non-required syntheses. For this import option, the most energy-intensive step is the liquefaction of hydrogen. With the direct use of NH3, only the synthesis in the exporting country is needed. The energy-intensive cracking in the importing country is not necessary for direct use, so the energy utilization rate increases from 63% (NH3 + cracking) to 77% (NH3 direct utilization).
The LOHC import option has a utilization rate of 68%. Exothermic hydrogenation in the exporting country and endothermic dehydrogenation in the importing country are the most energy-intensive process steps in this process chain. Heat utilization in the exporting or importing country was not considered. In comparison to the previously mentioned import options, Green LNG and MeOH with SR have significant lower energy utilization rates of 47% and 57%, respectively.
On the one hand, this is due to the endothermic synthesis for hydrogen production in the importing country, SR, and on the other hand, CO2 must be provided for both import options. It can be managed as a cycle, as in the import options including SR and carbon capture in the importing country. Only the percentage that cannot be captured must then be produced with DAC in the exporting country, in this study 10%. Therefore, if the direct use of the energy sources is considered, CO2 is not captured in the importing country. CO2 must be provided elsewhere. If the CO2 is provided in the exporting country with DAC, an energy-intensive process, the energy utilization rate of the import options increases only marginally, even though the synthesis in the importing country is not necessary. For Green LNG, the energy utilization rate improves from 48% (Green LNG + SR) to 51% (Green LNG direct utilization + DAC). For MeOH, the energy utilization rate even decreases by 1%, from 57% (MeOH + SR) to 56% (MeOH direct utilization + DAC).
The way CO2 is supplied has a major impact on the energy utilization rate of import options that require CO2. Therefore, the influence of the source of CO2 was further investigated in this article.
Therefore, a sensitivity analysis (see Figure 9) was performed with respect to the CO2 source and the effect of heat usage in the exporting country. Aside from the previously mentioned two considered cases of SR and direct utilization with DAC in the exporting country of Green LNG and MeOH, three additional cases were examined.
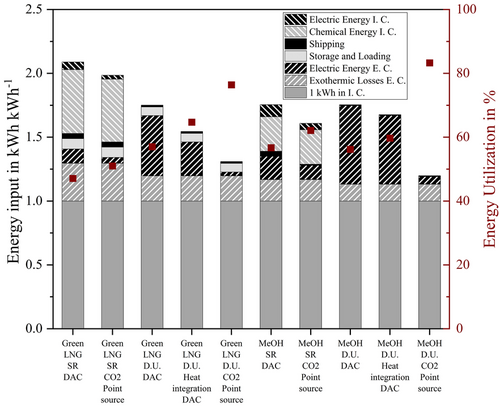
So, for both Green LNG and MeOH, five different cases were compared. They are: 1) Green LNG or MeOH with SR and carbon cycle, where only 10% of the CO2 is provided with DAC in the exporting country. 2) Green LNG or MeOH with SR, where the CO2 is provided from a point source in the exporting country. Possible point sources are biogas plants, biomass gasification, or industry. 3) Direct utilization of Green LNG or MeOH, where the CO2 is provided with DAC in the exporting country. DAC ensures location independence for the synthesis, since point sources are not always available. 4) Direct utilization of Green LNG or MeOH, where the CO2 is provided by DAC. The heat for the DAC is provided from the exothermic synthesis to produce Green LNG or MeOH. 5) Direct utilization of Green LNG or MeOH, where the CO2 is provided from a point source in the exporting country.
There are many different, well-known processes for capturing CO2 from CO2-rich gases (point sources), which have a lower energy requirement compared to DAC. This publication therefore considers the extreme case where no additional energy requirement for CO2 supply needs to be taken into account. The exact type of separation process was therefore not considered in this article. The assumed cases of CO2 provision with DAC and point source represent the two extreme assumptions of the energy requirement for CO2 provision. The provision by means of DAC represents the highest energy requirement, the point source the lowest. In addition to the options mentioned here, other options for CO2 supply are also conceivable; the energy requirement for such an option will then be between the two scenarios considered (DAC, point source).
The source of CO2 has only a small influence on the utilization rates for reforming methane or methanol back to hydrogen (first two bars for Green LNG and MeOH, respectively). If a point source is considered, the utilization rate increases only by 3% for Green LNG and 5% for MeOH. The reason is that a CO2 cycle is considered in which only 10% of the CO2 must be made available in the exporting country (due to losses in carbon capture after SR).
If the direct utilization of Green LNG or MeOH is considered, the energy intensive synthesis back to hydrogen is not necessary for both import options. As a result, no carbon is captured capture at SR in the importing country. CO2 must be made available elsewhere. If CO2 is provided by DAC in the exporting country, the energy utilization rate increases by 10% for Green LNG from 47% to 57% for direct utilization. For MeOH, the energy utilization rate even decreases slightly by 1%. This is due to the high energy demand of DAC in the exporting country.
Most of the energy needed for DAC is heat. Both, methanation and methanol synthesis are exothermic reactions, releasing heat. A heat integration to DAC was therefore investigated. For both import options, it is not possible to operate the DAC only with heat from the synthesis. Additional energy is still required. Nevertheless, the energy utilization rate for direct utilization increases for Green LNG further by 8% from 57% (direct utilization + DAC) to 65% (direct utilization + heat integration + DAC). During the methanol synthesis, not as much heat is released as during methanation. It is also reflected in the utilization rate. It increases for this scenario only by 4% from 56% to 60%.
The last option studied is that CO2 is provided by a point source in the exporting country. In this case no additional energy is required to obtain the CO2. Possible point sources are: biogas plants, biomass gasification, or exhaust fumes from industry. For Green LNG, the energy utilization rate increases to 76%, for MeOH even further to 83%.
In general, the differences in the increase of utilization rates between the two import options can be explained in the difference of the exothermic or endothermic of the reactions (synthesis and reforming). Methanation releases more energy and reforming of methane requires more energy, than methanol synthesis and reforming of methanol (see Equation (2), (3), (10), and (12)). Furthermore, the ratio of how many mol CO2 is required per mol H2 (CO2/H2) for methanol synthesis is 7.3 (Equation (10)), while the ratio for methanation is 5.5 (Equation (2)). So, more CO2 per H2 is needed for methanol. The source of the CO2 therefore has a particularly large influence on this import option.
In summary, it can therefore be said that for import options that require CO2, a favorable CO2 source is particularly important. If a point source is available in the exporting country, the direct utilization of the H2 derivatives is particularly advantageous in terms of energy.
Figure 10 investigates the influence of transportation distance on the energy utilization rate of the different import options. In addition, it compares the import of hydrogen and its derivatives by ship with the transport of gaseous hydrogen by pipeline. The energy required in kWh for one kWh in the importing country is shown for distances between 0 and 14 000 km. The compressors for transporting the hydrogen are operated electrically.[28] The energy consumption for pipeline transport was calculated according to Leiblein et al.[28]
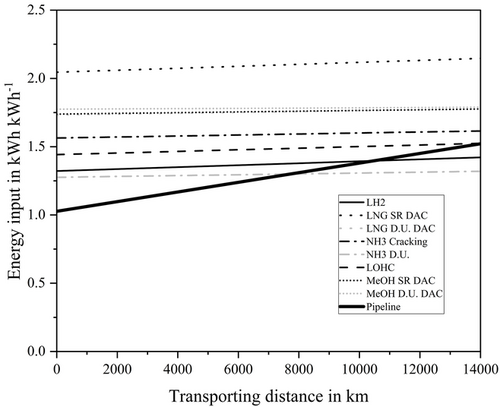
Due to the relatively small share of ship transport in the total energy demand, the transport distance has a small influence on the required energy and therefore the energy utilization rate of the import options. Doubling the distance from 7000 to 14 000 km only leads to a reduction in the energy utilization rate of 1–2% for all import options. If gaseous hydrogen is the target product in the importing country, LH2 is the most energy efficient transport option by ship for all distances. Only if the direct use of the energy carriers is also considered, NH3 performs better. The required additional energy required from 0 to 14 000 km is highest for the transport of NH3 with cracking which is approximately 0.1 kWh kWh−1. For short distances, pipeline transport is the most energy efficient compared to all import options. This is true for distances up to 9000 km.
It brings the focus to H2 which is exported from regions that can be reached by pipeline. H2 imports from these regions via pipeline are the most energetically reasonable option.
4.2 Additional Important Evaluation Criteria
The Intergovernmental Panel on Climate Change (IPCC) states that with a CO2 budget of 420 Gt CO2 there is a two-third chance that global warming will remain below 1.5°. With a budget of 580 Gt CO2, the chances drop to 50%.[80] A rapid reduction in greenhouse gas emissions is therefore essential to comply with the existing, diminishing budget and prevent global warming exceeding 1.5°. Therefore, not only the efficiency of climate-friendly hydrogen import options is crucial, but also their rapid implementation. So, replacing fossil hydrogen or other energy sources with renewable energy sources as quickly as possible is important to achieve the 1.5° target.
Therefore, in addition to the degree of energy utilization, other factors must be taken into account when evaluating import options. Further required evaluation criteria are the technological maturity of the process chain and the already existing infrastructure for transport by ship, volumetric energy density, as well as handling of the energy carrier.
4.2.1 Technology Readiness Level
One way of describing the technical maturity of a process chain is the TRL. The process step with the lowest TRL determines the TRL of the overall process chain. While large-scale plants already exist for some import options, there are process steps for other import options for which only labscale plants are available. The higher the TRL, the more technologically mature the process chain is and the faster it can be implemented.
4.2.2 Shipping Infrastructure and Global Trade by Sea
The number and capacity of vessels available for the respective derivatives is also an important parameter for assessing the speed of implementation. The current world trade volume of H2 derivatives provides information on their availability and establishment on the world market. Both factors allow an estimate of the quantities of the derivative that can be transported by ship in the short term. If a large part of the energy source is already traded by ship, a rapid expansion of green imports is feasible.
4.2.3 Volumetric Energy Density
The volumetric energy density is the amount of energy stored per unit volume of the energy carrier. With a higher energy density, it is possible to transport more energy to the importing country in defined spaces, like the hold of a vessel. High energy densities are therefore favorable for efficient ship transport.
4.2.4 Handling and Safety Regulations
Other criteria worthy of note are the handling and safety regulations of the energy sources. While some energy sources can be stored and transported at ambient temperature and pressure, others must be kept liquid at cryogenic temperatures and/or pressure. Another important aspect is the toxicity of the energy carriers.
The list of further criteria for technical evaluation is by no means complete. Other criteria include the currently available capacities of all process steps (e.g., ships), the domestic infrastructure for the energy sources in Germany and the future technological development and market ramp-up of the individual process steps of the import options. This further technical evaluation is the subject of current research. The results will be presented in a subsequent scientific publication. In addition to the technical evaluation, the economic and environmental evaluation and a related global hydrogen potential analysis for producing renewable hydrogen are also crucial in assessing the import options.
5 Conclusion
The goal of this article was to evaluate different hydrogen transport options to Germany from an energetic point of view. Starting off from hydrogen at 25 °C and 25 bar produced in the exporting country, liquid hydrogen, ammonia, Green LNG, methanol, and LOHC were considered as chemical energy carries for transport. The reconversion of H2 derivatives to hydrogen at 25 °C and 25 bar as well as the direct use of ammonia, methane, and methanol was considered. The process chains were defined and technically analyzed using data from literature. The energy utilization rates of the process chains were determined based on the energy demand of the single elements of the process chains.
From the energetic evaluation, liquid hydrogen is the most efficient import option when gaseous hydrogen is supplied in the importing country, with an energy utilization rate of 73%. When direct utilization of the H2 derivatives is considered, the ammonia import route has the highest energy efficiency with 77%. For import options that require carbon in the synthesis like Green LNG and methanol, the provision of CO2 is an essential process step. If point sources for CO2 are considered, direct utilization of methanol (energy utilization rate = 83%) and Green LNG (energy utilization rate = 76%) are the energetically favorable import options.
Furthermore, it was shown that the transport distance has only a minor influence on the energy utilization rate. Even doubling the distance only leads to a 1–2% reduction in the energy utilization rate. This is true for all import options.
This study focuses on quantifying the energy utilization rate of different hydrogen import routes to Germany. Bearing in mind that not the highest energy efficiency but the fastest realization and as a result the highest accumulated CO2-saving potential must be the main evaluation criteria, more information must be considered for the selection of the best import route. In this context, the following aspects need to be evaluated: degree of maturity of the single elements of the process chains (e.g., TRL), global production, and volume of trade by ship. The volumetric energy density as well as the handling and safety regulations of each energy carrier are other important evaluation criteria. As this list of criteria is not exhaustive, a further scientific publication will discuss these and other criteria for the technical evaluation of import options.
Acknowledgements
This work is part of the TransHyDE-Project “TransHyDE-Sys – Systemanalyse zu Transportlösungen für grünen Wasserstoff”, which is sponsored by the German Federal Ministry of Education and Research (Bundesministerium für Bildung und Forschung, BMBF) under funding code: 03HY201C. This work is also part of the study “H2-Import – Kurzstudie zu Transportoptionen von Wasserstoff”, which was sponsored by DVGW—German Technical and Scientific Association for Gas and Water (Deutscher Verein des Gas- und Wasserfachs e.V.) under funding code: G 202224. [Correction added on 21 March 2024, after first online publication: Minor corrections have been updated in Abstract section.]
Open Access funding enabled and organized by Projekt DEAL.
Conflict of Interest
The authors declare no conflict of interest.
Open Research
Data Availability Statement
The data that support the findings of this study are available in the supplementary material of this article.


