Introducing Spectrophotometry for Quality Control in Lithium-Ion-Battery Electrode Manufacturing
Abstract
The demand for electrochemical storage systems is increasing due to their conventional use in mobile applications and potential as energy storage devices in power generation and electromobility. Due to its comparatively low weight and high energy density, the lithium-ion battery is one of the most widely used electrochemical storage devices. Battery cell production consists of a complex process chain with a large number of interdisciplinary processes. Each process step has specific requirements for the product. Different process parameters are essential in each step and require unique control measurements to ensure the quality of the intermediate product. To identify critical parameters, an understanding of the potential effects of different process parameters and the relationship between structural characteristics and end product properties must be gained. Therefore, herein, spectrophotometry concerning its application in lithium-ion battery production is investigated. Individual process steps in electrode production are carried out to establish a correlation between intermediate product properties and measured color values. The influences of the powder components, the dispersion, and coating process are discussed. Based on the experiments carried out in this study, the suitability of spectrophotometry as an indirect measurement method of intermediate product properties is demonstrated.
1 Introduction
The rising demand for lithium-ion batteries (LIBs) significantly changed the field of research in the past years.[1] Due to the exponentially increasing market volume and high raw material costs, resource efficient processing is more important than ever since almost 70% of the battery costs are due to the raw material used.[2] Resource efficient processing requires continuous product quality monitoring along the process chain to identify scrap material as soon as possible and enable an intelligent, data-driven process control to adjust the following process steps.[3, 4]
So far, few studies have been known that focus on the intermediate product (IMP) analysis in electrode production.[5-7] Along the process chain, the material passes three different IMP steps: powder, slurry, and electrode. Each IP has its own distinct characteristics and different methods to determine the IP quality. For example, the slurry is often characterized by its particle size and viscosity, while electrodes usually are characterized regarding conductivity, mechanical properties, or porosity. However, only a few publications specifically investigate those methods in depth. Even though many publications use the measured values to investigate processes or materials, none of them concludes quality assessment parameters. The main challenges with postulating these so-called “quality gates,” which define the IP quality, are the huge variety of parameters, the high complexity of the subsequent process steps, and so-called process–structure–property relations. These relations are even more complicated to identify and to predict since every IMP has its own characteristics that cannot be carried onto later IMPs. The information regarding slurry rheology may influence edge formation or coating quality, yet these characteristics are measured differently and cannot be compared easily.
Due to the high complexity, Kornas et al.[8] proposed a multivariate key performance indicator (KPI)-based method for quality control of the process chain. This system was developed considering the entire cell production process and introduces a KPI system with a hierarchical structure to take into account the interactions between process and product characteristics.
However, the idea behind intelligent processing is a realization of autonomous control systems. These control systems require specific target values in product and process properties (quality gates). Based on these quality gates, simulations can compare input parameters and adjust the process if needed. Furthermore, short measurement times are necessary for the implementation of closed-loop controls and rapid intervention in the event of any deviations from the quality gates. Therefore, inline measurements offer an enormous advantage over standard offline quality measurements in the laboratory.[3, 9]
In this publication, we introduce spectrophotometry, that is, as a new characterization method, for quality control in LIB electrode production. So far, color measurement is frequently used for quality control in several industries.[10, 11] For example, in the pharmaceutical industry, color quality measurements can be performed on powders or tablets in order to detect impurities or inconsistencies in production.[12, 13]
It is beneficial in electrode production toward state-of-the-art characterization methods in certain ways: 1) Measurement can be automated; 2) No sample preparation is necessary; 3) Indestructive measuring method is required; 4) Measuring time (<1 s) can be realized depending on individual requirements; 5) The color is defined by distinct values, which simplifies data processing in preparation for data-driven process control models. Models do not have to consider distributions as input parameters anymore; 6) The method is suitable for all intermediate products (one method fits all).
Using the color of electrodes as a fingerprint for several quality parameters across the process chain, a possibility to track and trace distinct product features across the IMPs is being created. The aim of using color measurement is not to replace physical measurement characteristics such as particle size distribution or adhesion strength. It is rather intended to offer new possibilities to characterize those aspects by correlating these values with the material color to allow an inline characterization across the entire process chain.
2 State-of-the-Art Material Characterization in Electrode Production
2.1 Powder
At the beginning of the value chain of electrode production, the raw materials are weighed according to the recipe and then dry mixed to obtain a homogeneous powder mixture. Alternatively, a high-intensity dry prestructuring step can be used to target particulate properties.[14] The resulting mixture is forwarded to the next process step.
In previous research works, the characterization of raw materials and powder mixtures in electrode production has mainly been used as some kind of supportive information. However, the quality of the raw materials and powder mixtures can significantly impact the overall cell performance. One of the most popular characterization techniques for this purpose is scanning electron microscope (SEM) imaging. While SEM imaging, in general, gives a good impression on the structural integrity of the particles, it is an elaborate and time-consuming method. Moreover, it lacks in sufficient statistics for quality control. To quantify the progress of the dry mixing process, in some applications, the electrical conductivity and the packing density of the powder mixture are measured in an isolated sample chamber.[14]
Dry mixing processes can serve different purposes depending on its intensity. The dry mixing process in electrode production can lead to significant improvements in the electrochemical, electrical, and mechanical product properties. Low-intensity processes are mainly used to homogenize the powder mixture and accomplish an even distribution of all components. High-intensity dry mixing processes, on the other hand, are used to change the integral structure of the materials. Investigations on high-intensity dry mixing processes have shown a correlation between mixing time and intensity and carbon black (CB) deagglomeration.[14, 15] Once a sufficient intensity is reached, CB can also be coated on the surface of the active material (AM) particles. The dry mixing process improves the cycling stability of the electrodes and the rate capability.[14] However, once a certain intensity is exceeded, the mixing process can also degrade the AM.
2.2 Slurry
The powder formulation obtained from the dry mixing step is mixed with a solvent in the next process to produce a homogeneous slurry for the subsequent coating step. Important target parameters here are the viscosity and often also the particle size of CB commonly used in LIB electrodes. Previous research has shown the necessity of sufficient CB dispersing for a homogenous slurry and a good electrode performance. Addressing the particle size measurement, Mayer et al.[16] investigated the influence of the CB dispersing process for NMP-based cathode slurries. With increasing dispersing time at constant mixing tool velocities, the particle size decreases due to the deagglomeration and fragmentation of CB particles. The results show that the CB particle size significantly impacts the produced cathode's pore structure and electrochemical performance. Grießl et al.[17] investigated the dispersion kinetics using a laboratory dissolver. The scope of investigation included the dispersion of CB using different process parameters in water-based anode slurries and NMP-based cathode slurries. The results have shown that increasing tip speed and mixing time can enhance the deagglomeration of CB to a certain amount. The increasing deagglomeration was shown using rheology and particle size measurement. They postulate that smaller CB particles enhances the CB binder network and increases the specific electric conductivity to a certain amount. The cycling data indicate that especially the performance at higher C-rates can be enhanced through sufficient deagglomeration of CB.[17, 18]
In literature, particle size measurements are usually carried out using laser diffraction methods. Laser diffraction measurement of battery slurries always requires a sample preparation due to its high particle loading. It is necessary to ensure transmission during the measurement and highlight the CB particles. The use of this method for quality control would require a well-defined sampling procedure with a lot of effort and time.[6]
2.3 Electrode
The drying of the electrode coating represents one of the most cost-intensive steps in electrode production. The purpose is to remove the solvent and to fix the electrode's particulate layer to fundamentally determine the structure and performance of the electrode.[19] Previous publications have shown that the drying parameters and mass loading significantly influence the structure and the adhesion of the electrode to the substrate.[20] The reason for this is the segregation of the inactive materials and the resulting lack of binder between the interface of the substrate and the coating.[21-23] A proof for the segregation and the relationship to the drying can be provided by Raman spectroscopy[24] and energy-dispersive X-Ray spectroscopy (EDX).[23, 25]
Jaiser et al.[23] investigated the electrochemical performance of two different drying scenarios: first, a low-intensity dried electrode and second, an intensive dried electrode. He found that a loss of capacity occurred at the anode due to the higher drying intensities. He attributed the lower performance of the intensively dried electrode to the accumulation of CB and binder on the surface, resulting in a depletion of binder and CB at the interface between substrate and coating.
In addition, Jaiser et al.[26] presented a drying model in which he makes the time of pore emptying primarily responsible for the segregation of the binder. He describes that as soon as the shrinkage of the coating stops due to the evaporation of the solvent occurs, the remaining solvent in the pores transports the inactive materials to the surface of the electrode. Furthermore, he states that a reduction of the drying intensity is beneficial during this drying phase. The existence of an inline methodology that provides direct feedback on the segregation progress allows a much simpler and faster experimental adjustment of drying profiles to the formulation and the optimization of drying speeds.
The current quick indirect methodology to validate the degree of segregation provides the measurement of the adhesive strength of the electrode. Here, adhesion decreases as drying intensity increases due to greater binder segregation.[20-23]
Direct methods to determine segregation, such as those mentioned above, are time-consuming and, thus, disadvantageous in continuous quality control in production. To better understand segregation processes in an industrial dryer in general, an inline method is beneficial.
3 Experimental Section
3.1 Materials
All electrodes studied were water-based LIB anodes. Artificial graphite was used as an AM in electrode production. Carboxy methyl cellulose (CMC) and styrol butadiene rubber (SBR) were used as the binder (B) system. The ratio of these two components was kept constant at 1/3 CMC and 2/3 SBR in all formulations. CB was used as the conductive additive.
To illustrate the influence of the formulation strategy on the color value, various approaches were investigated in this article. Table 1 shows the basic recipe, which was used throughout this publication, if not stated elsewise in the results section.
| Material | Weight ratio [wt%] | ||
|---|---|---|---|
| R1 | R2 | ||
| AM | Artificial graphite | 93.00 | 93.00 |
| Conductive additive | CB | 1.40 | 3.00 |
| Binder 1 | Carboxymethyl cellulose | 1.70 | 1.33 |
| Binder 2 | Styrene–butadiene–rubber | 3.80 | 2.67 |
3.2 Electrode Manufacturing
3.2.1 Slurry Mixing
All powder components were dry mixed in a TURBULA T2F mixer (Willy A. Bachofen AG Maschinenfabrik (Muttenz, Switzerland)) at a speed of 49 min−1 for 15 min. This mixer performed a 3D movement to mix the powder components.
As an example of process variations, the influence of a highly intensive dry mixing step on the product color was investigated, using the intensive ring shear device (Nobilt NOB-130, Hosokawa Alpine AG). Artificial graphite and CB were mixed for five minutes at a constant tip speed, which was set to 4, 7, 10, 13, and 16 m s−1, respectively.
Prior to dispersion, the powder mixture was added to water successively at a defined speed of 500 rpm. The tip speed was adjusted to 9 m s−1, and the powder was dispersed for 45 min. Due to the shear sensitivity of SBR, the addition took place at the end of the dispersion, at a tip speed of 3 m s−1. Further process parameters during the dispersion process are listed in Table 2. Samples of 20 mL were taken after 5, 15, 30, and 45 min as well as after the SBR addition and degassing step.
| Batch size [mL] | 1600 |
| Mixing geometry | Tooth disk |
| Disc diameter [mm] | 70 |
| Tip speed dispersing [m s−1] | 9 |
| Tip speed degassing [m s−1] | 3 |
| Dispersing time [min] | 45 |
| Degassing time [min] | 15 |
3.2.2 Coating and Drying
Coating and drying of the slurry were carried out on the continuous roll-to-roll coating system LabCo with 6 m dryer length (Kroenert, Germany). A comma bar in reverse roll coating mode was selected as the applicator. The electrodes were coated with a standard width of 16 cm with a coating speed of 1 m min−1. For the control and monitoring of the mass loading, the ultrasonic extinction meter US200 by Mesys was used.
The continuous dryer consisted of three segments, each with a length of 2 m. The temperatures in each segment were set to 60 °C at a fan speed of 40% (26.5 W (m2 K)−1 indirect impingement). The drying progress was monitored inside the dryer using inline IR sensors. The drying time and length were determined. In order to describe the influence of the drying conditions on the color, various drying experiments were performed. The temperature was varied between 60, 75, and 90 °C. The fan speed was set at 40%, 60%, and 80% within the test matrix. Furthermore, the valve positions of the drying nozzles were varied between indirect impingement and direct impingement drying.
3.3 Characterization of Intermediate Products
3.3.1 Particle Size
In order to determine the degree of dispersion and, therefore, the slurry quality, particle size analysis was performed in a state-of-the-art procedure. To characterize the degree of dispersion, Dreger et al.[6] postulated a sample preparation method to ensure the measurement of CB particles in electrode slurries. The particle size distribution of electrode slurries typically showed a bimodal behavior, having one peak above and one below the value of 1 μm. Therefore, the particle size distribution for graphite-based anode slurries can usually be divided into two classes, C1 (x ≤ 1 μm) and C2 (x > 1 μm). This bimodal behavior can be attributed to the different components used for electrode slurry.
The particle size analysis was performed using the Horiba LA-960 laser scattering device (Retsch), which contained two lasers operating at 405 and 650 nm. Previous to the characterization, all slurry samples were prepared according to Figure 1.
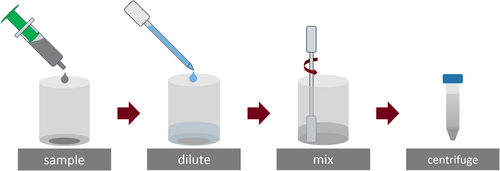
To allow the characterization of CB particles in the slurry, all samples (0.5 g) were diluted with 12 g water and centrifuged for 5 min at 500 rpm with a mean diameter of 184 mm (Biofuge Primo, Haeraeus). After centrifugation, the samples were added to the measuring device until the 650 nm lasers showed a transmission of 85%–86%. Each sample was measured two times using triple measurements, which led to a total of six particle size distributions for each sample. For result presentation, we chose to plot the logarithmic density distribution, which commonly showed bimodal behavior for graphite-based slurries containing CB.[6]
3.3.2 Adhesion Strength
The mechanical adhesion strength of the coating to the current conductor foil is essential, especially during cell production. Moreover, it is a measurement for the distribution of the binder in the electrode coating. The coating must be mechanically stable at all times and withstand stress, which can be realized by good adhesion of the coating to the foil.[7] Within this work, the adhesion was tested using a pull-off method on the Z020 material testing machine from Zwick GmbH & Co. KG.
A defined pressure was applied to the sample, which was covered with a double-sided adhesive tape with high adhesive strength and placed between two plane parallel plates. After the dwell time elapsed, the two plates moved at high speed in opposite directions. This movement was intended to cause the failure of the coating, and the maximum force Fmax used in the process was measured. With this value, the adhesion strength σZ, related to the sample area AP, could be calculated. The detailed test specifications are given by Haselrieder et al.[7]
3.3.3 Color Measurement by Spectrophotometry
The handheld spectrophotometer sph900 by ColorLite GmbH was utilized in this work. The LED light source, which was integrated into the measuring head, illuminated the sample. During each measurement, different LEDs were illuminated and the reflected light was measured. The measurements were carried out using a 45°/0° geometry. The measuring head was adjusted depending on the type of the product. For powders, the geometry was immersed into the powder. In slurry production, samples were taken and applied to the lens using a syringe (Figure 2). For electrode measurement, the sensor head was placed orthogonally on the electrode sheet.

To ensure color consistency in color measurement, the Central International Examinations (CIE) introduced the so-called L* a* b color space in 1976.[28] Comparability of different measurements was made possible by the qualitative and quantitative assessment of color differences, and a conversion with the respective type of illumination was possible.[29] In Europe, the standard illuminant D65 (daylight) was used by default.[30] In the CIE-L* a* b color space, the color information and the brightness were described as coordinates in a 3D coordinate system. The neutral colors and the brightness “L*” were located on a vertical axis (z-coordinate), as shown in Figure 2, and values from 0 (black) to 100 (white) were shown. Additionally, two more coordinates were assigned for the color shades. Coordinate “a*” indicates the red and green components of the color and “b*” indicates the yellow and blue components. However, depending on the brightness range, these values may differ slightly.[29]
4 Results and Discussion
4.1 Raw Material Colors
As previously mentioned, properties of the powders or powder mixtures can be influenced by a dry mixing step prior to wet dispersion. In order to be able to assess the influences of different mixing grades or CB particle sizes, an analysis of the raw materials used in production is required. Figure 3 shows the color values of the raw materials, which are often used in state-of-the-art anode recipes. All components were in a powdery state during the measurement. SBR on the other hand was present as a dispersion dissolved in water, as this substance is commercially typically given in this form for a more pragmatic usability. For statistical evidence, a large number of measurements (at least 45 per material) was performed and the mean value and the standard deviation are plotted.
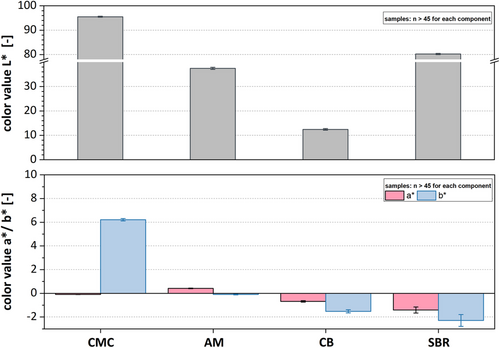
The binders CMC with L* = 95.5 and SBR with L* = 80.2 represent the brightest components of the formulation, followed by AM with a brightness of L* = 37.4. The darkest component in anode formulation is CB with L* = 12.4. Despite its brightness, each individual component differs in the a*- and b*-value as well. While CMC powder has a yellow shimmer represented by the positive b*-value (b* = 6.2), SBR as well as CB tend to have a blue shimmer (b* = −2.6/b* = −1.6). Graphites are neutral gray where the a*- and b*- value does not deviate significantly from a*/b* = 0. Even though we exclusively focus on anode materials, the color measurement can be adopted for cathode materials in the same manner.
4.2 Color Changes Based on the Dry Mixing Process
Figure 4 shows the mean color values (based on seven measurements) of graphite and CB mixtures for different mixing intensities in a ring shear mixer. With increasing tip speed of the mixing tool, the L*-value decreases from L* = 33.0 down to L* = 29.8 at 10 m s−1. This decrease in brightness can be attributed to a deagglomeration of CB particles during the mixing process. With decreasing particle size, the specific surface area of CB increases significantly, leading to color changes.[31-33] However, further increasing the tip speed to 13 and 16 m s−1 shows an increase in the brightness of the powder. The L*-value increases to L* = 31.8 for 13 m s−1 and L* = 32.8 for 16 m s−1. This can be explained by the changes in the powder structure and accumulation of CB particles on the surface of the graphite particles.[34] At low-to-medium tip speeds, CB agglomerates are fragmentated, leading to an increase in CB surface area and therefore darkening of the powder mixture. With increasing tip speed, the energy input reaches a threshold where dry coating of particles can occur. CB particles accumulate on the graphite surface, leading to a so-called mechanofusion[14, 35] or at least ordered mixing.[36] Those processes have been extensively reviewed by Pfeffer et al.[37] for pharmaceutical application. The accumulation of CB at the AM reverses the effect of CB fragmentation, increasing the brightness of the sample. Additionally, the high shear stresses can spheronize the graphite by abrasions well. Thereby, graphite fragments break off the material and increase the reflective surface in the sample, leading to a brighter powder color. At 16 m s−1, the stress intensity is sufficient to spheronize the graphite particles. Investigations have shown that graphite particles have been rounded during the process.[34, 38] The variations in process parameters seem to impact the b*-value as well, showing a similar trend with increasing tip speed. However, due to the rather small b*-values compared to the range, we propose the L*-value for graphite-containing powder mixtures to be more suitable for describing material conditions.
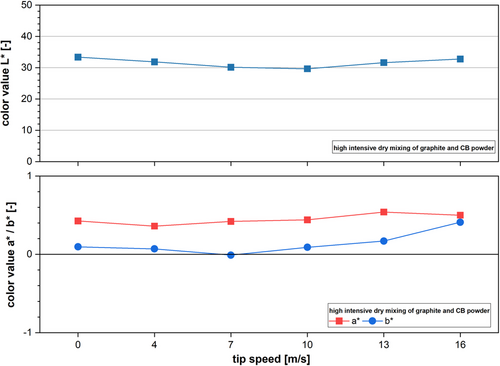
The a*-value does not provide significant information regarding the condition of the powders and mixtures. However, we expect the a*-value to be highly useful for characterizing silicon-based materials since silicon is brown in color and therefore, offers a significantly higher red portion than graphite.
Based on our results, the color measurement of powders is a promising method for research and industry. It can be utilized to characterize product parameters and evaluate raw materials’ quality. For example, in research and development as a product characteristic or in production as quality control and incoming goods inspection.
4.3 Color Measurement During Dispersion
4.3.1 Color Changes Based on Components
4.3.2 Color Changes Based on the Dispersion Process
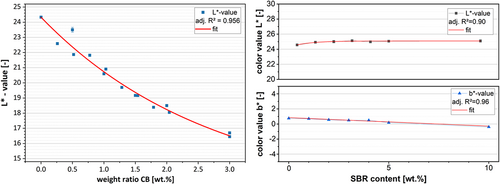
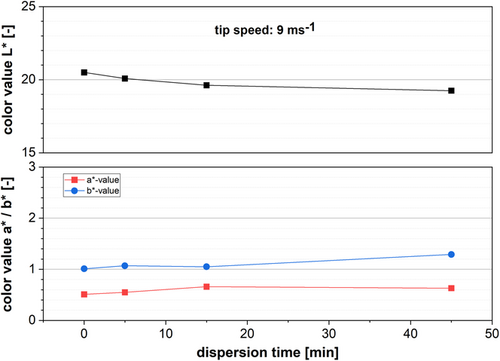
In order to characterize the dispersion progress, samples along the dispersion process were analyzed regarding their color, rheology, and particle size. All samples after SBR addition are excluded from the investigation. Due to its small particle size and the surfactant used to stabilize those particles, SBR interferes with both the particle size characterization and flow behavior. We excluded those results because they would add an additional variable to the system. However, due to its shear sensitivity, SBR is typically added at low tip speeds when the dispersion of CB is already finished. By adding SBR, the color changes according to Figure 5. The color measurement results are shown in Figure 6. Matching the AM color, anode slurries are dark gray and, therefore, primarily the L*-value is used. The other two values (a* and b*) are rather small between 0.5 and 1.2. However, two aspects can be observed when comparing the values of the color measurement along the dispersing process. The L*-value decreases with increasing dispersing time, which means the slurry is darkening during processing (ΔL* = 1.25). At the same time, both the a*and b*-value slightly increase (Δa* = 0.1 and Δb* = 0.3). Based on Equation (2), the L*-value of slurry containing 1.4 wt% CB is estimated at L* = 19.63. With L* = 19.62 measured after 15 min, the estimation is quite accurate.
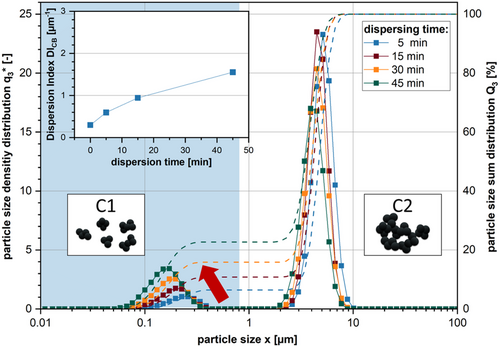
The results of the particle size characterization are shown in Figure 7. The peak areas in C1 are continuously increasing with dispersion time. This effect can be attributed to the dispersion and deagglomeration of CB particles. CB agglomerates are typically around 5–10 μm in size, which is shown by the peak in C2. These agglomerates are broken down by applying shear stresses during dispersion into CB aggregates shown in C1. By applying Equation (1), the DICB is calculated based on the measurement results. DICB is continuously increasing during dispersion starting at 0.298 μm−1 after the wetting up to 1.55 μm−1 after 45 min of dispersing at 9 ms−1. Therefore, we can conclude that the dispersion process continuously progressed in our test. A similar effect is observed during the viscosity measurement (SI 1, Supporting Information ). The results of the shear rate tests show a continuous decrease in low shear viscosity with increasing dispersion time. After adding the powder mixture to the solvent, the flow curve shows a plateau at about 230 Pas at low shear rates (). With further increasing shear rates, the slurry shows shear thinning. The viscosity reduces to 49.8 Pas at 10 s−1. Due to the high viscosity, the slurry spun out of the measurement gap, leading to a sudden drop in viscosity. With increasing dispersion time, the overall flow curve shifts to lower viscosities (19.91 Pas @ 10−1, 45 min). After 45 min of dispersion, the flow curve almost appears to be a sine wave with a slightly shear thickening section between . Due to this behavior, the viscosity does not significantly change with increasing shear rate.
In order to identify a correlation between brightness value L*, particle size, and viscosity, the results are plotted against each other in Figure 8. Therefore, the DICB and the viscosity at certain shear rates () were chosen, representing the particle size distribution and flow curve.
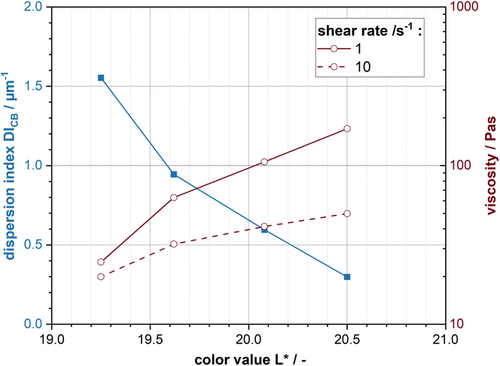
The results reveal a direct correlation between the dispersion progress and the L*-value. The reason for this could be that CB in the slurry acts like a black pigment. CB itself is the darkest component in anode slurries (see Figure 3). With ongoing dispersion and increasing energy input, the CB deagglomerates further, leading to increased surface areas and particle concentration. Thereby the absorption increases and the slurry brightness reduces. Similar results have been found by Gueli et al.[39] They identified a correlation between particle size and color, although this is strongly dependent on the orientation of the measured particles. Previous research has also shown that smaller particles lead to an increase in color saturation of coating layers.[40]
With decreasing brightness, the slurry viscosity decreases, with the DICB increasing at the same time. The correlation between both values and the slurry brightness can be described using a power law function. The results indicate that, for a constant slurry formulation, the dispersion progress can be monitored and controlled based on the slurry color. In batch processes, for example, the color measurement could be used to replace the particle size characterization and viscosity measurement. Using the color value L* as a quality gate, a continuous slurry monitoring can be achieved. Using this method quality control in the industrial process can be simplified and automated, setting the way for a fully autonomous slurry production. However, this characterization method is highly dependent on the formulation and materials used. The overall color value will be greatly affected by the CB content, meaning the method has to be parameterized at first. The color in slurries represents a fingerprint for the slurry properties, meaning that correlations between each other have been identified. However, a fingerprint will always offer less information than a detailed analysis. There is the possibility of overlapping effects for process or formulation changes. Therefore, a detailed process knowledge is required to sufficiently evaluate the results and use this method to its full potential. Furthermore, the color changes are affected by the color difference in the raw material. When using darker materials like NCM, the measurement may be less sensitive compared to graphite slurries.
4.4 Electrode
4.4.1 Influence of the Components on the Color of the Electrode
As already stated in Figure 3, the individual components of the anode formulation have different color values, so the electrode's overall color results from the raw component's individual color values.
To determine the influence of the raw components, the color values of the electrodes at different binder (green stars) and CB (black diamonds) contents are shown in Figure 9. The areal weight is kept constant for this test series at 8.2 mg cm−2. The low areal weight is to ensure that segregation phenomena are kept to a minimum.
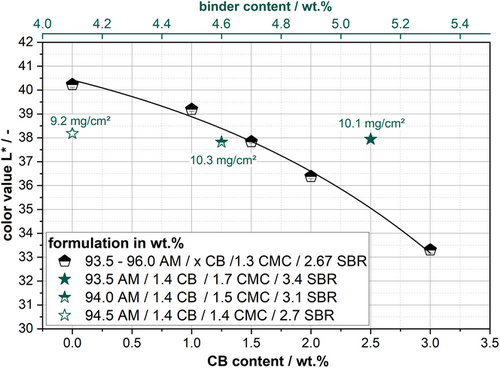
It can be seen that there is a relationship between the L* value and increasing CB content of the anode. An explanation is offered by the fact that the CB behaves like a black pigment in the anode and, by increasing the proportion, the electrode darkens. It is clear that increasing the CB content from 0% to 3% results in a reduction in the L* value. For CB content >3%, this relationship will no longer be given, and the color value will have a lower limit value which asymptotically approaches the L-value of CB. However, it is reasonable to assume that the shown relationship exists for the amounts of CB commonly used in LIB electrodes. Furthermore, it can be observed that an electrode without CB (black squares) has a color value of L* = 40.2 and is, therefore, brighter compared to the pure AM (L* = 37.4). The brighter components can explain this deviation in the formulation, such as the CMC and SBR.
Three different binder contents were chosen and plotted to determine the influence of the binder in the formulation. It can be observed that an increase in the binder content does not result in a significant change in the electrode color and that the deviating mass loadings can explain the fluctuations of the values. This could be explained by the fact that the CB contained in the formulation overlays the color of the binder components, thus negating the brightening effect. Nevertheless, the influence of the binder components could be different in other electrode systems such as SI anodes. Since SI is also measurable as a component in the a* and b* value, differences may be better resolved.
4.4.2 Influence of the Process Parameters on the Color of the Electrode
In addition to the influences of the color values of the raw components and the resulting overall color of the electrode, specific product parameters affect the color values of the electrode. Figure 10 shows various anode formulations with different CB contents and their L* values plotted against the mass loading. It can be observed that, regardless of the formulation if CB is present, a reduction of the L* value occurs with increased mass loading. As already described by Westphal et al., the effect of binder segregation is enhanced with increased mass loading. This effect can also be seen here, although the color measurement does not represent the binder's actual segregation but CB segregation. The result is different if the formulation does not contain CB. Here, the increasing mass loading leads to a slight brightening of the electrode due to the higher amount of binder on the surface of the electrode.

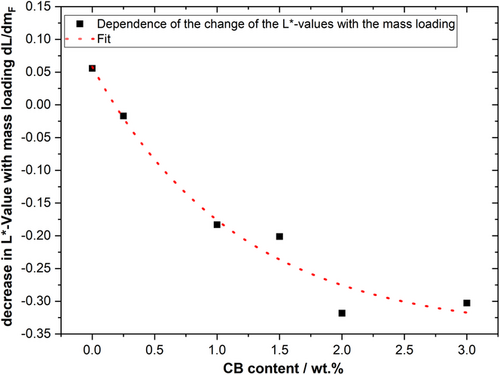
When examining the fit functions through the respective test series, it becomes clear that the negative slope of the curves increases with the CB content. Figure 11 illustrates the different slopes of the test series as a function of their CB content. Depending on the CB content, the slope of the fit function varies and increases with increasing CB content. This can be attributed, on the one hand, to the fact that more CB is flushed to the electrode's surface, due to the higher amounts of CB. On the other hand, the binder content was kept constant, resulting in different CB/binder ratios. This has the effect that the CB/binder network is formed to a different extent, which could influence the segregation during drying of the electrode. In order to be able to consider these results further, the adhesive strengths were plotted against the mass loading, as shown in Figure 12.
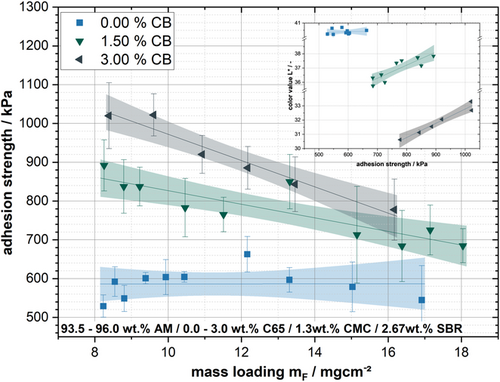
It can be observed that the test series without CB shows no-significant-to-no decrease in adhesive strength with increased mass loading. For the test series with CB, the results show a similar tendency of the slope as in Figure 11, so that with increasing CB content, the segregation of the binder and the CB has a stronger influence on the adhesion between substrate and coating with increasing mass loading. The decrease of the adhesion strength with increasing mass loading is at 1.5% CB content = −17 kPa mg−1 cm−2 and for 3.00% =−33 kPa mg−1 cm−2. Furthermore, it can be observed that the adhesion strength improves considerably at low areal weights. Thus, the adhesive strength of the electrode without CB is 530–600 kPa; with 1.50% CB, it is 830–900 kPa, and with 3.00% CB, it is 970–1075 kPa.
Lim et al.[41] investigated the influence of CMC and SBR on the electrode's microstructure and the influence on the rheological properties. He found that the CMC adsorbs preferentially on the AM surfaces and covers them so that with more significant amounts of CMC, the SBR contained in the formulation cannot adsorb and remains in the medium. In addition, it must be considered that the SBR is added at the end of the dispersion process. Therefore, at the beginning of the dispersion, all AM and CB surfaces are loaded by the CMC. At this point, the total surface area of the materials present in the suspension is critical. Without CB, the available material surface area is much smaller, making it difficult for SBR to adsorb onto surfaces. This can be confirmed by the results shown in Figure 12. Without CB in the formulation, the electrode structure is insufficiently formed because of the crosslinking between the coating and the substrate, which leads to poor adhesion strength. Furthermore, there is no decrease in adhesion with increasing mass loading. Due to the low surface area, there is an excessive amount of binder, so segregation phenomena do not directly result in a decrease in adhesion. The authors assume that a further increase in the mass loading will lead to a reduction in adhesion.
By successively increasing the CB content, the surface area present in the suspension is significantly increased, and more SBR is adsorbed onto the graphite surfaces. At the same time, CMC/SBR can adsorb to the CB and, thereby, form crosslinks within the electrode and increase the number of bonding points, leading to an increase in adhesion. It should be noted that the adhesion strength is clearly more sensitive to the segregation phenomena, and the crosslinks formed, which have led to a better adhesion, are broken up or removed again. Without CB, the binder is mainly adsorbed on the AM surfaces, so only nonadsorbed binder molecules can segregate. This assumption is confirmed by the slight brightening of the electrode with 0.00% CB in Figure 10.
Furthermore, the color of the electrode can be used to estimate the CB concentration on the surface of the electrode. For example, an anode with a CB content of 1.00% at a mass loading of 16.9 mg cm−2 has an L* value = 37.7. The identical L* value is also obtained for an anode with a CB content of 1.50% at a mass loading of 8.8 mg cm−2. From this, it can be concluded that the CB content on the surface of the electrode increased to the one of the 1.50% CB electrode. To the same extent, a binder and CB reduction should have occurred at the interface between substrate and coating.
4.4.3 Influence of Drying Parameters on the Electrode Color
Figure 13 shows the change in color with regard to the evaporation rate and the adhesion strength. To calculate the evaporation rate, the surface temperatures of the electrodes were measured inline with IR sensors during drying. It can be assumed that a dry electrode has the same surface temperature as the set drying temperatures.[24, 42] The resulting drying time, mass loading, and solids content were used to calculate the evaporation rate. In general, an increase of the evaporation rate results in darker electrodes and also in a reduction of the adhesive strength.
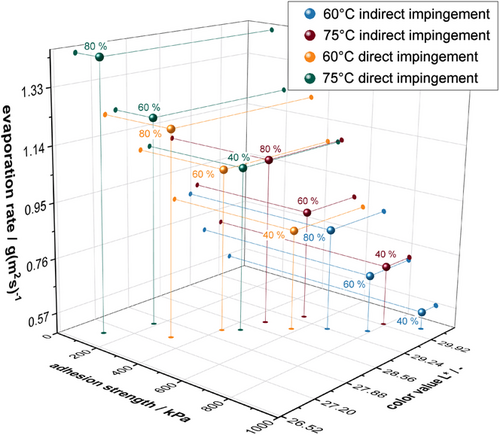
The individual experiments must be considered among their own since the flap positions (direct and indirect impingment) and relative air circulation speeds (40%, 60%, 80%) varied in addition to the temperatures, as the different increments of the selected temperatures and air circulation speeds do not have the same effect on the drying intensity. However, it was found that the change of the flap position to direct impingement seems to have the most significant influence on the drying intensity. Due to the changed flap positions of the dryer nozzles, the airflow velocity is higher, which leads to a higher heat transfer coefficient (HTC). Furthermore, it can be noticed that with increasing drying temperatures and circulation speeds and, thus, a fast fixation of the coating, the electrode darkens and the adhesion of the electrode decreases due to intensified binder migration. Against that, for thin electrodes, a positive effect of fast drying on adhesion has already been described in the literature.[43, 44] The main reason is the entanglement of the polymer nodes, which could only be loosened by a long drying time and thus caused segregation. The electrodes considered have a wet film thickness of about 250 μm and are therefore much thicker. Consequently, no positive influences on the adhesive strength of the electrode can be observed.
Furthermore, it can be distinguished that the decrease in the L*-value results in a decrease in adhesion strength. In the author's opinion, this confirms the assumption that the degree of binder segregation can be indirectly determined with the help of the color measurement. Generally, the lower the intensity of drying, the less segregation of the binder and CB takes place. The linear relationship between the evaporation rate and the L*-value in the measured data shown can be explained primarily by the fact that a symmetrical drying profile was selected and the electrode was dried constantly over the entire length of the dryer with the same parameters.
5 Summary and Conclusion
In this work, we introduced spectrometry as a promising characterizing method in the production of battery electrodes. It was shown that color measurement is suitable for the process- and product-related characterization of the intermediate product powder, suspension, and electrode. The major benefit of the measurement is that there is no need for complex sample preparation; the method offers short measurement times and is nondestructive. By applying the method to all IMPs in anode production, we found correlations between the material color and state-of-the-art characterization methods.
It was observed that various relationships can be shown with the selected color space, especially when the L*-value, which describes the brightness of the respective product, is taken into account.
The reason behind this is that CB acts like a pigment in the formulation. It was found that the L*-value of the intermediates is reduced as the CB is increasingly stressed in a dry mixing process. Thus, with increasing stressing of a powder mixture by an intensive mixing process, the L*-value of the mixture decreases up to the point where the CB are coated onto the surfaces of the AMs. In general, the characterization of all the intermediates investigated showed a correlation between the darkening of the respective intermediate and the CB content. On the slurry side, in addition to the L*-value, the b*-value can also be used for characterization. This is defined primarily by the SBR used in slurry formulation. In addition to the actual CB content, the particle size of the CB is of great importance. During dispersion of the CB deagglomerates and thereby, the particle size reduces, leading to a decrease in the L*-value. This shows a correlation between the dispersion index used and the L*-value of the suspension. On the electrode side, it could be shown that the influence of the CB from the formulation has the most significant influence on the L* value. Brightening properties of the binder only occur without the presence of CB. Based on a formulation variation with different CB contents at constant binder content and increasing mass loading, it was found that the adhesion to the substrate is clearly improved with increasing CB content, but the adhesion is clearly more sensitive to the segregation phenomena. First, darkening of the electrode surface occurs as the mass loading increases. This indicates an increased CB accumulation on the electrode's surface. At the same time, a reduction in the electrode adhesion to the substrate occurs as the mass loading increases, with the decrease being more severe at higher CB contents. In contrast, the total adhesion strength of the electrode is higher with increased CB content; due to the higher surface area, the CB binder network is strengthened. Furthermore, a correlation of the drying intensity in the form of the evaporation rate to the L* value and the adhesion strength could be established. Further work aims to establish inline color measurement in the drying process and on cathodes and further describe the influence of CB on binder segregation. Those correlations enable the use of spectrophotometry as a finger print method for quality control purposes. Especially for industrial application, this method can be important regarding smart manufacturing and inline quality monitoring. Inline devices are already available and can be integrated at any part of the process. However, it needs to be considered that a fingerprint method always offers less information than a detailed product analysis with specific measurement methods for each characteristic. Due to the large variety of influencing factors, multiple changes may lead to counter-affecting changes in color value. Furthermore, the sensitivity of the measurement depends on the overall color difference of the raw materials. Similar raw materials color in the recipe may lead to less sensitive measurement results. Therefore, a detailed process knowledge is required to sufficiently evaluate the results of the color measurement. Once the correlations have been identified, the fingerprint can be used for process control purposes.
Acknowledgements
The authors gratefully acknowledge the German, Federal Ministry of Economic Affairs and Climate Action (BMWK) and the Project Management Agency Karlsruhe (PTJ) for their support and funding within the project “DaLion 4.0 - Data Mining as Basis for cyber-physical Systems in Production of Lithium-ion Battery Cells (03ETE017A).” The authors like to thank Axel Rosenkranz, Alexander Neuberger, Jan-Michael Kröhnke, and Niclas Pryzibylla for their assistance with electrode production and analyses.
Open Access funding enabled and organized by Projekt DEAL.
Conflict of Interest
The authors declare no conflict of interest.
Open Research
Data Availability Statement
The data that support the findings of this study are available from the corresponding author upon reasonable request.


