Controlling Product Distribution of CO2 Reduction on CuO-Based Gas Diffusion Electrodes by Manipulating Back Pressure
Abstract
The electrochemical reduction reaction of CO2 (CO2RR) is a promising avenue toward the renewable energy-driven transformation of a greenhouse gas toward fuels and value-added chemicals. While copper uniquely can catalyze this reaction to longer carbon chains, Cu-based electrodes continue to face numerous challenges, including low selectivity toward desired products and poor stability. To unlock its potential for large-scale industrial implementation, great interest is shown in tackling these challenges, primarily focusing on catalyst and electrode modifications and thereby leaving a research gap in the effects of operation conditions. Herein, back pressure application is introduced in CO2 electrolyzers at industrially relevant current densities (200 mA cm−2) in order to steer selectivity toward C2+ products. The back pressure adjusts CO2 availability at the electrode surface, with a high CO2 surface coverage achieved at ΔP = 130 mbar suppressing the competing hydrogen evolving reaction for 72 h and doubling of stable ethylene production duration. Faradaic efficiency of 60% for C2+ products and overall C2+ conversion efficiency of 19.8% are achieved with the easily implementable back pressure operation mode presented in this study. It is proven to be a promising tool for product selectivity control in future upscaled Cu-based CO2 electrolysis cells.
1 Introduction
The products of CO2RR, such as C2+ hydrocarbons and alcohols, attract significant global demand. Hori et al.[ 1 ] discovered in 1985 that Cu is the only metal that can electrochemically reduce CO2 and CO into significant amounts of hydrocarbons, and since then researchers working in the field of CO2 electrochemical reduction have to this day continued to focus their efforts on Cu due to its unique ability to convert CO2 into bigger molecules that require more than two reduction electrons per CO2 molecule (>2e− products).[ 2-6 ] This special capability of Cu stems from its optimal binding energy for CO2RR and hydrogen evolving reaction (HER) intermediates: a negative adsorption energy for CO*, indicating thermodynamically favorable interaction between components, and a positive adsorption energy for H*, indicating the opposite.[ 6-8 ]
Despite these characteristics, electrochemical CO2RR on Cu-based electrodes continues to face numerous challenges to its scalability, including product selectivity and stability.[ 5, 9, 10 ] Industrially relevant stable operation times (>10 000 h) and high selectivity toward specific value-added products (e.g., ethanol, propanol, or ethylene) at lower potentials are essential for future industrial applications but remain to be achieved. The parasitic HER constitutes one of the main issues, as it over time diverts selectivity toward undesired H2, eroding away at stable CO2RR operation. Scientists work on different aspects of the CO2RR system to overcome these problems: modification of the catalyst structure (morphology,[ 11-13 ] oxidation state,[ 14-16 ] facets,[ 9, 17, 18 ] grain boundaries[ 15 ]), application of multiatom catalysts (bimetallic systems,[ 2 ] tandem catalysts,[ 10, 19, 20 ] or dopants[ 21, 22 ]), as well as design of electrode structure.[ 23-26 ]
Engineering of the electrode structure is a broader aspect that answers to multitudinous facets of the CO2RR challenges. In typical aqueous-fed CO2 electrolyzers (liquid-phase reactors), electrodes suffer from CO2 mass transport limitations, as CO2 availability is limited by its solubility in the electrolyte. In gas-fed CO2 electrolyzers with gas diffusion electrodes (GDEs), the CO2 solubility problem is eliminated as CO2 is transported by gas diffusion to the three-phase boundary where electrolyte, catalyst, and CO2 coexist. Yet, in cathodes of the GDE type, feed diffusion to the catalyst layer remains the mass transport limiting step. In addition to mass transport, electron and ion transport phenomena are also governed by GDEs. Various parameters can be manipulated to fabricate the optimum GDE, including porosity of diffusion layer, hydrophobicity, thickness of electrode and of catalyst layer, catalyst–diffusion layer interactions, ionomer or binder properties, catalyst–ionomer interactions etc.[ 8, 23, 25 ]
The mechanism of CO2RR on Cu is a highly debated topic in the literature with various postulated mechanisms for each product.[ 4, 5, 10, 27-29 ] The product spectrum includes C1–C3 hydrocarbons and oxygenates: carbon monoxide (2e−), formate (2e−), methanol (6e−), methane (8e−), acetate (8e−), acetaldehyde (10e−), ethylene (12e−), ethanol (12e−), propionaldehyde (16e−), allyl alcohol (16e−), and n-propanol (18e−).[ 5 ] Half-cell reactions of the main products are listed in Table S1 of the Supporting Information.
Formate and carbon monoxide, C1 products requiring only 2e− electrons for reduction, are typically the first products to be observed at lower (more positive) overpotentials, signaling that their formation demands the lowest kinetic barriers for their formation.[ 8 ] Adsorbed CO species have been identified in numerous studies as the key intermediate in the reduction of CO2 to >2e− products.[ 3, 6, 10, 28, 30-35 ] Formate is the only product that does not involve a CO* species as intermediate.[ 8, 10 ] Selectivity between the CO or HCOO− pathways is determined by the CuC and CuO bond strengths. Intermediate species, which are bound either by C or O atom(s) to the catalyst surface, lead to CO and HCOO– formation, respectively.[ 8 ] The other common C1 product, methane, is formed from CO* with a series of electron–proton transfers, requiring 8e− for its reduction from CO2.[ 5, 8, 36 ]
C2+ product mechanisms must include C–C coupling step(s), necessitating two adjacent C-containing adsorbates. Ethylene is formed via dimerization of two CO adsorbed species and its further reduction to the alkene form.[ 5, 6, 17, 27, 33, 37 ] Ethanol and ethylene pathways differentiate from one another, where hydrogenation of *CHCOH leads to the former and deoxidation of a hydroxyl group in *CHCOH to the latter.[ 33, 38 ] Acetaldehyde is suggested as an intermediate species in the ethanol formation mechanism.[ 3, 28, 39-41 ] Another C2+ product, acetate's formation mechanism, is not yet agreed upon in the literature. There are studies claiming that homogeneous chemical reactions in alkaline electrolytes resulting from OH− attack on a surface-bound ketene or other carbonyl-containing intermediate (Cannizzaro-type disproportionation) after C–C coupling leads to acetate formation.[ 15, 42 ] C3 alcohol is possibly formed with a selective C–C coupling of *C1 and *C2 intermediates that result in propionaldehyde formation and it is followed by rapid hydrogenation to C3 alcohol.[ 28, 41, 43, 44 ]
The presence of various possible surface species and their coverage as defined by the applied potential makes C–C coupling a potential-dependent phenomenon.[ 5 ] Higher cathodic potentials are required to permit C–C coupling reactions.[ 34, 43, 45 ] In concordance with this requirement, it is proposed that C2 pathways necessitate a lowered activation energy of CO–CO dimerization,[ 33 ] which is the rate-determining step for C2 pathways according to the literature.[ 27, 46-48 ] The rate of C2+ formation is therefore determined by the rate of conversion of adsorbed CO* species to the C2+ product, assuming sufficient coverage of the key intermediate CO*.[ 37 ] The selectivity toward oxygenated products is higher at more positive onset potentials due to the weaker driving force for polarizing C–O-containing intermediates. As a result, the CO bond remains and it leads to oxygenate products.[ 3 ]
Among Cu-based CO2RR catalysts, oxide-derived Cu draws special attention owing to its better selectivity, stability, and energy efficiency. Oxide-derived Cu compared with metallic Cu possesses more porous surfaces[ 8 ] with undercoordinated sites formed by special grain boundary terminations,[ 8, 19, 43, 49 ] enabling high selectivity toward oxygenates at relatively low overpotentials.[ 3, 15, 19, 40, 50-52 ] In situ reduction of Cu oxides in the cathode under electrolysis conditions alters the crystal morphology, which has been shown to change the catalyst's selectivity and stability.[ 3, 12, 16, 36 ]
Cu-based electrodes’ activity toward CO2RR notoriously decay over time, posing the greatest obstacle for its commercialization. There are various hypotheses about the origin of this. Hori et al.[ 53 ] suggested deposition of metallic impurities as the cause of catalyst poisoning, whereas more recent studies claim impurity poisoning occurs only with very small electrode sizes[ 8, 36 ] or result from C* surface species that can be formed as a reaction intermediate in the C1 pathway.[ 30, 31, 43, 54-58 ] CO2RR instability is also attributed to surface reconstruction by both sintering and declustering at different time periods of the electrolysis.[ 59 ] In addition to catalyst-related phenomena, limitation of CO2 availability (e.g., by electrode flooding) on the electrode surface can compromise CO2RR stability. Several studies suggest that flooding of GDEs is the key way in which electrolytes create CO2-depleted zones, leading to the dominance of HER.[ 60-62 ]
Among other operational parameters, pressure has a unique role in CO2RR as it has a threefold effect: capillary effects on the electrode flooding, mechanical effects providing better contact between electrolysis cell components, and increase in CO2 concentration in the gas phase and therefore the surface coverage on the catalyst. By means other than manipulating pressure, researchers have controlled coverage on the electrode surface by manipulating CO2 or CO feed concentration. Lie et al.[ 46 ] diluted the CO feed and Tan et al.[ 63 ] the CO2 feed with N2 to study their coverage effects. Applying an impulse current is another technique to control local CO2 concentration by enabling transient conditions of high local CO2 concentration.[ 64, 65 ]
In this work, we have employed a different approach, by varying the back pressure of the gas side in the electrolyzer to manipulate coverage on the electrode surface and minimize flooding effects. We show that back pressure as an operation parameter in CO2RR can be manipulated to control product selectivity and improve stability of the electrodes. With applied back pressure of 0–130 mbar between the gas side of the electrochemical cell and catholyte chamber, we demonstrate that the Faradaic efficiency (FE) for desired C2+ products is improved up to 60% at 200 mA cm−2 and that stable operation of CO2RR is maintained for more than 72 h, during which HER is successfully suppressed to below 25% FE (at 130 mbar). C2+ conversion efficiency for CO2RR products reaches up to 19.8%. Our results prove that back pressure may be manipulated in future upscaled CO2RR systems with CuO-based GDEs to control the product selectivity and improve the CO2RR stability.
2 Experimental Section
2.1 Electrode Preparation
CuO powder particles delivered by Johnson Matthey were used for the preparation of Cu-based GDEs. A CuO ink was prepared with 40 mg of CuO powder, 160 mg of 5 wt% Sustanion XA-9 anionic ionomer in ethanol solution, and 4 mL of isopropanol (99.9%, Sigma Aldrich). The ink was sonicated in an ultrasonic water bath for 30 min and immediately drop cast onto a 10 cm × 5.5 cm carbon-based gas diffusion layer (GDL) from Freudenberg (H23C2), which consisted of two layers: a carbon-based microporous layer containing hydrophobic PTFE binder and a macroporous layer consisting of carbon fibers. Together with the drop-cast catalyst layer, the GDE therefore had three layers. Later, the electrode was dried overnight at room temperature under a N2 atmosphere with a flow of 50 sccm. The dried electrode batch was cut into two pieces with a 48 mm × 44 mm cutting template. The active area that took part in the electrolysis was 10 cm2. The catalyst loading was 0.73 mg cm−2.
2.2 Electrode Surface Analysis
A Bruker D2 PHASER diffractometer (Cu K radiation, scan rate of 0.02° s−1) was used to perform ex situ X-ray diffraction (XRD) analysis on electrodes pre- and postelectrolysis. Scanning electron micrographs (SEM) of the GDEs pre- and postelectrolysis were taken at different magnifications with a high-resolution field-emission scanning electron microscope (JSM-7500F, JEOL). Both XRD and SEM results are given in the Supporting Information.
2.3 Experimental Set-Up
An internally designed flow cell was used in all experiments (Figure S5 and S6, Supporting Information). The cell consisted of three compartments where gas, catholyte, and anolyte flow in and out, respectively. PTFE and PEEK materials were used to determine the fluid flow patterns, to ensure cell tightness and provide better mechanical stability for the GDE and membrane. An IrOx-coated electrode with a 10 cm2 active area (Electrocell) was used as the anode and the CuO GDE described above as the cathode. Anode and cathode chambers were separated from one another by a cation exchange membrane (CEM) (Nafion 117, Ion Power). 250 mL of 1 m KHCO3 (+99.7% in dry basis, Alfa Aesar) was circulated in the system as electrolyte between the gaps of cathode–membrane (catholyte) and anode–membrane (anolyte). The electrolyte flows circulating in both anode and cathode gaps were mixed in an electrolyte chamber external to the cell and pumped continuously through the system with microdiaphragm liquid pumps (NFB 25 KPDCB-4A, KNF) operated at a constant flow of 100 mL min−1. The gas chamber was fed with CO2 (+99.998%, Linde) which was humidified by a custom-made water bubbler at room temperature. Gas flow rates in the system were controlled with mass flow controllers (SFC5400 Sensirion). In contrast to the electrolyte, the gas head spaces of catholyte and anolyte were kept separate. The gas outlet from the cell was mixed with catholyte head space. The setup and cell details are shown in the Supporting Information.
2.4 Electrochemical Measurements
2.5 Product Analysis
The catholyte gas head space was connected to a gas chromatograph (GC) for quantitative product analysis (7890B Agilent, Santa Clara, USA). N2 was mixed with the product stream before the GC inlet as an internal standard for quantification. He is the carrier gas enabling the detection of H2 as a negative peak. A thermal conductivity detector (TCD) and three serially connected columns were used: a HayeSeP Q-column, a Porapak Q-column for the separation of CH4, CO2, and C2H4, and a molecular sieve 5 Å column to separate N2, O2, and CO. 1 mL of the gas product stream was automatically injected every 20 min from the cell to the GC during the course of the electrolysis.
1H nuclear magnetic resonance (NMR) was used for quantification of liquid products. Electrolyte circulated constantly in a separated closed system between reservoir and cell sampled from a septum. The NMR measurements were performed in a 500 MHz Bruker (Bruker Bio-Spin, Karlsruhe, Germany) following the method described by Cuellar et al.[ 45 ] The water peak was suppressed by a presaturation sequence. An aliquot of the KHCO3 electrolyte-containing liquid products (300 μL) was mixed with sodium fumarate as an internal standard (50 μL) in D2O (250 μL) for quantification.
3 Results and Discussion
The setups for CO2RR with back pressure operation and experimental results are explained in three main categories: cell setup, stability under back pressure, product selectivities under different back pressure values, and flow rates. The characterization of the electrodes is presented in Supporting Information.
3.1 Cell Setup and Application of Back Pressure
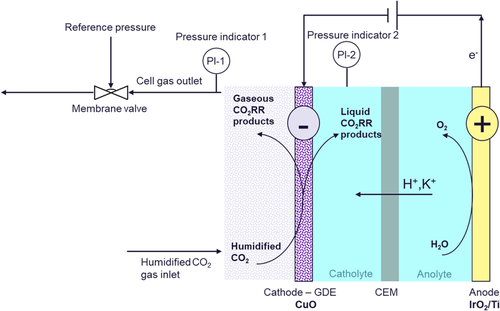
Back pressure experiments were performed on carbon-based GDEs embedded with a commercial CuO catalyst, positioned in a two-gap flow cell architecture (see Experimental Section and Figure S1–S4, Supporting Information, for electrode description and characterization). The cells consist of two electrodes separated by a CEM and two gaps that accommodate electrolyte flow (1 m KHCO3, flow rate = 100 mL min−1; Figure 1). The third compartment, namely, the gas chamber where humidified CO2 (atmospheric gas inlet pressure) flows, comes into contact only with the cathode and therefore does not reside between the two conductive electrodes. A membrane valve is positioned at the gas outlet stream that carries mainly unconverted CO2, H2, and CO2RR gas products. The absolute pressure in the gas compartment is increased and controlled by the membrane valve.
Pressures in the gas compartment and in the catholyte chamber were monitored with pressure sensors. The back pressure (ΔP) applied on the GDE is defined as the difference between P1 (gas) and P2 (catholyte). This was set to 70 and 130 mbar at high gas flow rates and 40 mbar in low-gas flow rate experiments. It must be noted that higher back pressures can lead to so-called “flow-through” operation, where the pressure difference enables the gas to be pushed through the porous electrode to the catholyte chamber on the other side. For this reason, back pressure must be set to a value that maintains the desired “low-by” operation. This threshold value for flow-by strongly depends on the electrode architecture and properties, employed flow rate, catholyte properties, and cell design and size. We stress that optimum back pressure values can vary in differing cell systems and should therefore be optimized accordingly.
3.2 HER Suppression Under Back Pressure
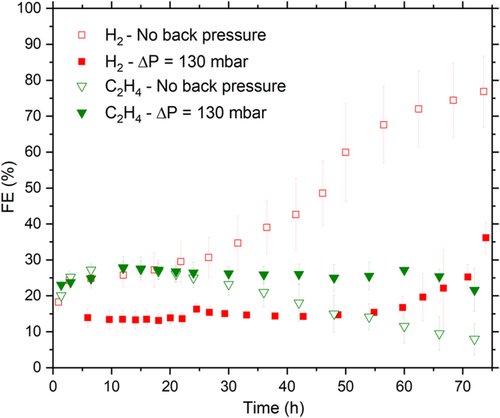
The stability of the CuO electrodes was tested at an applied current density of 200 mA cm−2 in two series of experiments: base case without back pressure and with ΔP = 130 mbar. In Figure 2 , the FE for H2 and C2H4 is depicted versus time for both cases. HER as the competing reaction to CO2RR is a good indicator for a decrease in CO2RR catalytic activity. is chosen as an indicator of CO2RR stability, as it is one of the more valuable CO2RR products. At a back pressure of 130 mbar, is suppressed below 25% for 72 h, in comparison with the base case where H2 selectivity is clearly higher already from the outset at 25–40% for the first 48 h and only becomes more dominant over time (FEHER > 50%). Two separate phenomena are observed here: 1) Back pressure significantly decreases the selectivity for H2. At 24 h, FEHER is 15.1 (±1.0)% under ΔP = 130 mbar, whereas in the base case it is almost double this at 30.7 (±5.6)% in the base case; and 2) Back pressure provides longer stable CO2RR operation. remained above 20% for only 36 h in the base case, while back pressure of 130 mbar prolonged its stability to 72 h, corresponding to a stability increase by a factor of two when 20% is assumed as the stability threshold.
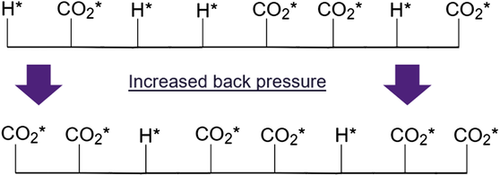
According to the adsorption equilibrium equation, adsorbed CO2 species coverage () increases with increasing CO2 concentration in the gas phase, assuming that CO2 adsorption is molecular and first order.[ 46, 63 ] Figure 3 schematically illustrates the increasing surface coverage of with increasing partial pressure of provided by application of back pressure. As adsorption () is the rate-determining step of CO2 reduction to <2e− products and the reaction from to CO* is faster, a higher partial pressure would accordingly translate into an abundant CO* surface coverage.[ 8 ] Based on our results, it can be assumed that increased back pressure leads to higher CO* coverage and therefore HER suppression.
On the second phenomenon, two explanations for longer stability under back pressure are possible. As mentioned, catalysts producing more C2+ relative to C1 products may be more stable due to a possible graphitic intermediate in the C1 route.[ 35, 36, 47, 59-63 ] In mechanistic studies conducted by Rahaman et al.[ 43 ] and Akhade et al.,[ 58 ] the poisoning C* species is postulated to be formed via reduction of COH*, which is an intermediate of CO*-to-CH4 reduction. As discussed in the following subsections, abundant CO* coverage provided by back pressure suppresses C1 hydrocarbon production (CH4) and promotes C2+ selectivity. This may have resulted in the observed longer stability by avoiding poisonous C* intermediate formation, as this route is not preferred under high CO* coverage. Another possibility is that back pressure keeps the capillary pressure (local pressure difference between wetting and nonwetting media) at a sufficiently high value that minimizes the flooding of the catalyst and GDLs, an otherwise highly likely cause of deactivation.[ 60-62 ] When flooding is minimized, the salts present in the aqueous electrolyte do not crystallize in the pores of the electrode and do not increase its hydrophilicity. We hypothesize that flooding occurs to a smaller degree or can be delayed under back pressure. Mass transport limitation on CO2 availability therefore remains low and can be avoided for a longer period.
3.3 C1 Product Formation under Back Pressure
FEs of three main C1 products, CO, COOH−, and CH4, obtained under CO2RR conditions at an applied current density of 200 mA cm−2 and at three different back pressure conditions are shown in Figure 4 . Methanol is detected only in trace amounts and has not been included in the results.
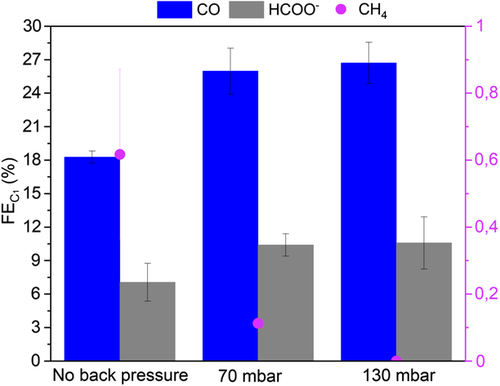
The key intermediate CO is produced in significantly larger amounts when back pressure is applied, indicating that CO* desorbs before being reduced further to >2e− products. FECO = 18.3 ± 0.6% in the base case compared with 26.0 ± 2.1% under 70 mbar and 26.7 ± 1.8% under 130 mbar back pressure. Therefore, a correlation between increasing back pressure and CO desorption may be established. A similar trend of increased CO production at higher pressures is described in the literature, the cause of which is given as the increased CO* surface coverage under higher pressures.[ 36, 43, 63 ] It has also been claimed that abundant coverage reduces the CO* binding energy to the catalyst surface via adsorbate–adsorbate repulsion, which, in turn, causes CO to bond weakly and therefore its desorption.[ 68 ] Additionally, we hypothesize that shorter residence times due to a stronger driving force for diffusion through the catalyst layer at higher back pressures deprive of sufficient residence time to react to >2e− products.
The production of formate, the only product that is formed exclusively from and not through CO*, is also slightly greater under back pressure, enhanced by the higher surface coverage under such conditions. Notably, this increase in FECOOH − is not as high as that of CO. This might suggest that the proportion of CO2 atoms bound to the Cu surface via the C atom (leading to CO pathways) becomes significantly higher under back pressure, whereas the number of CO2 atoms bound to Cu surface by O atom(s) (leading to HCOO– pathway) does not increase as much.
FE for CH4 is observed to decrease from 0.6% in the base case, to 0.1% at 70 mbar back pressure and to 0% at 130 mbar back pressure. The lower selectivity toward CH4 in the base case can be attributed to the intrinsic catalytic behavior of CuO. Oxide-derived Cu catalysts are known to demonstrate low selectivities for CH4 [ 43, 69 ] and the presence of several Cu2O facets is proven to diminish methane formation.[ 43 ] The gradual decrease of with increasing back pressure and the complete suppression of CH4 at 130 mbar may be correlated to abundant coverage, which prohibits H* surface coverage and therefore protonation of CO* intermediates required for CH4 formation.
3.4 C2+ Product Formation under Back Pressure
C2+ products from CO2RR on Cu surfaces typically possess either 2 or 3 carbon atoms. It is logical to divide >2e− CO2RR products into two groups as hydrocarbons and oxygenates as they follow distinct potential dependencies, mechanistic pathways, and surface coverage dependencies. Ethylene and methane constitute the hydrocarbons group whereas methanol, ethanol, n-propanol, allyl alcohol, acetaldehyde, propionaldehyde, and acetate constitute the oxygenates group. Ethylene is categorized separately from the others as it is the only C2+ hydrocarbon molecule, the rest being oxygenates. Acetaldehyde, propionaldehyde, and propionate are detected only in trace amounts and have not been included in the results, while allyl alcohol and acetate are observed in very small amounts and have been included within the C2+ and oxygenate groups.
does not change significantly at different back pressure levels and accounts for ≈23–25% in all cases (Figure 5a). FE for total C2+ products is however enhanced from 36.9% in the base case to 43.0% at ΔP = 70 mbar and 43.9% at ΔP = 130 mbar, and clearly stems not from ethylene but rather from oxygenate formation (Figure 5b). The ratio of >2e− oxygenates to hydrocarbons can be tuned between 0.53 and 0.85 at 0 < ΔP < 130 mbar. An enhancement of FEoxygenates from 13% to 20% (accounting for an improvement of 54% in oxygenate selectivity) is driven mainly by ethanol and propanol formation and can be achieved simply by varying the back pressure.
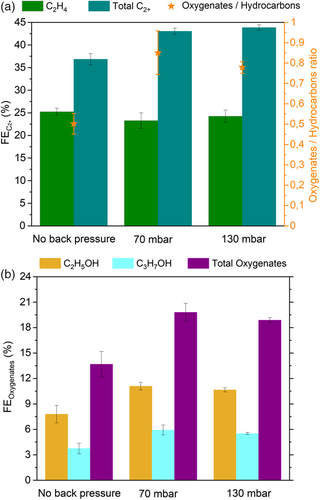
The observed correlation between back pressure and C2+ selectivity can be explained with the predicted second-order kinetic dependency of CO* coverage for C–C coupling,[ 37 ] leading to accelerated C2+ production kinetics with higher CO* coverage. Nevertheless, we do not exclude the effect of possible changes in local pH when local CO2 concentrations are higher due to back pressure. The selectivity between ethylene and oxygenates may be explained by the effects of high CO* coverage on the reaction mechanism, as Li et al. discussed with both density functional theory calculations and experimentation:[ 46 ] *CHCOH intermediates tendentially deoxidize to *CCH under lower CO* coverage, leading to the ethylene reaction pathway versus tending to hydrogenate to *CHCHOH under higher CO* coverage and hence the oxygenate pathway. Our experimental results confirm this. Oxygenate selectivity improvements (and correspondingly improved C2+ selectivity) achieved with higher CO2 or CO feed concentrations have similarly been reported by others.[ 3, 15, 51 ] We therefore demonstrate that such trends may also be influenced by applying a back pressure.
In parallel with the aforementioned stability of C2H4 formation, FEC2+ drops only minimally from 43.9% to 40.5% between the 3rd and 48th h of electrolysis when under ΔP = 130 mbar. In stark contrast to this, diminishes drastically from 36.9 to 22.8% within same period if no back pressure is applied. A detailed breakdown of product selectivities over time is given in Table S4, Supporting Information.
3.5 Deconvolution of Back Pressure Effects on Stability and Selectivity
Control of coverage over catalyst surface and capillary pressure control circumventing the electrode flooding have been mentioned as the possible underlying reasons of the stability and selectivity effects of back pressure application. To decouple these two phenomena from each other, two various experiment series both with ΔP = 130 mbar (P abs = 1.13) back pressure application at different two different feed compositions were performed: 100% CO2 feed (= 1.13 bar) and CO2: N2 feed in volumetric ratio of 88.5:11.5 (= 1.00 bar). The diluted feed experiments with ΔP = 130 mbar have the same CO2 partial pressure of 1.00 bar as the control experiments with no back pressure in the base case (P abs = 1 bar, = 1 bar).
C2H4 and H2 FEs over time are shown as the stability indicators in Figure 6 . N2-diluted CO2-fed experiments at ΔP = 130 mbar exhibit C2H4 stability for ≈48 h, almost identically to the base case with no back pressure. It is significantly inferior to the 72 h stability of pure CO2-fed experiments at ΔP = 130 mbar. H2 was not as suppressed with = 1.00 bar as it was with = 1.13 bar, its FE was on constant rise after 48 h, similar to the base case with no back pressure. In the light of these results, back pressure can provide H2 suppression and stable C2H4 formation primarily by means of increased coverage and not necessarily through capillary pressure preventing electrolyte incorporation into the catalyst layer, as the same ΔP = 130 mbar with diluted CO2 feed could not maintain stable C2H4 formation and H2 suppression.
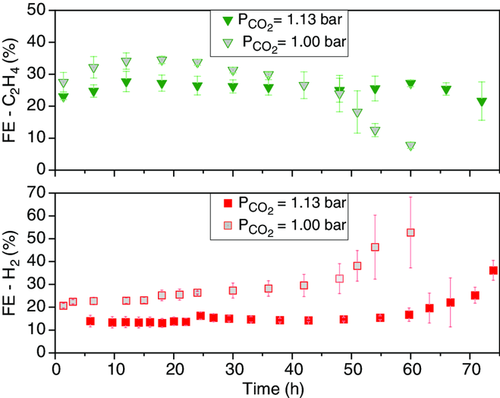
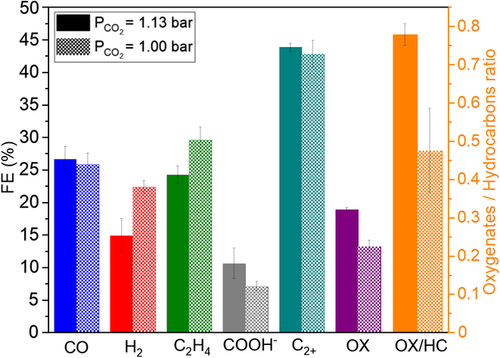
Figure 7 sets out the effects of on product distribution under the same back pressure of ΔP = 130 mbar. CO selectivity did not differ significantly and failure of H2 suppression at = 1.00 bar was discussed thoroughly above. was greater at = 1.00 bar with diluted CO2 feed (29.6%) compared to the = 1.13 bar case (24.3%). COOH− was formed substantially in smaller amounts at lower . Oxygenate selectivity was significantly improved at higher . In line with the previous findings, we confirm that high coverage at = 1.13 bar promotes COOH− and oxygenate selectivities. = 1.00 bar condition with diluted CO2 feed (88.5 vol%) possibly enabled a milder , shifting the oxygenate–hydrocarbon (C2H4) selectivity toward the hydrocarbon.
Base case experiments (P abs = 1 bar) and dilute CO2 feed experiments at ΔP = 130 mbar back pressure (P abs = 1.13 bar), both employing = 1 bar, showed similar product distribution (Figure S8, Supporting Information). The slight differences favoring CO and C2H4 over H2 in the dilute CO2 feed at ΔP = 130 mbar may be attributed to the prevention of electrolyte incorporation to the catalyst layer by the presence of back pressure.
3.6 Combined Effect of Back Pressure and Low Flow Rates
Despite the improvements obtained in terms of stability and selectivity toward C2+ oxygenates through back pressure applications, the increase observed in CO production remains (Figure 4) and limits the overall selectivity for C2+ that can be achieved as it implies lost opportunity for its further reduction. Additionally, improved C2H4 selectivity has not been achieved despite abundant surface coverage of provided by back pressure.
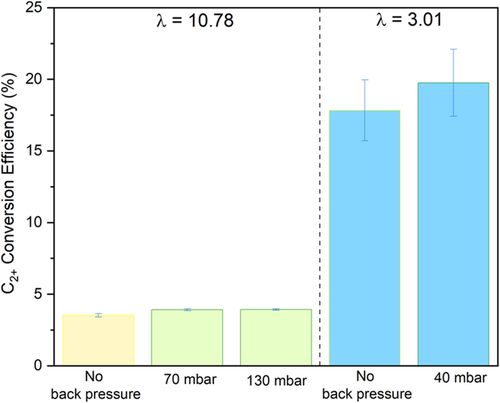
Shorter residence times at the catalyst-coated surface of the electrode is a possible reason for the above observations. A series of experiments at a lower CO2 feed flow rate were conducted to investigate whether a further reduction of CO* may be achieved by a longer residence time and a more optimum surface coverage for C2H4. Feed flow rates are expressed in terms of λ, which is the ratio of actual CO2 flow rate to the CO2 flow rate theoretically required for full utilization of electrons for ethylene formation ( = 100%; see Equation (2) in the Experimental Section). A CO2 feed of 50 sccm, equivalent to λ = 10.78, is supplied for high flow rate experiments and 14 sccm CO2, equivalent to λ = 3.01, is fed to the electrolyzer for low flow rate experiments. CO2RR was conducted under four different conditions: high flow rate experiments under ΔP = 130 and 0 mbar back pressure and low flow rate experiments under ΔP = 40 and 0 mbar back pressure. The back pressures applied in each of these flow rate conditions correspond to the maximum achievable back pressure if a flow-by operation were to be maintained; a pressure difference exceeding these values for the two cases caused flow-through operation. It is worth noting that the maximum achievable back pressure for flow-by operation strongly depends on electrode characteristics, cell design, catholyte wetting properties and gas flow rate, and the values reported here are therefore highly specific to the experimental materials and design employed.
It is important to emphasize that CO2 availability in the catalyst layer of the electrode changes fundamentally under low flow rate conditions. The bulk CO2 gas concentration is reduced from 81.9 to 33.3 mol%, when CO2 is fed into the electrolyzer cell inlet at 50 and 14 sccm, respectively (see Table S2, Supporting Information). The local CO2 gas concentration at the catalyst is predicted to be even lower in the low λ case, as a thicker gas boundary layer with higher mass transfer resistance can be expected. Therefore, the difference between the bulk and locally available CO2 gas concentrations is predicted to be greater at lower flow rates. Tan et al.[ 63 ] discussed the same trend for CO2 local availability in CO2RR environments at low flow rates.
As shown in Figure 8a, FECO declines from 18.3% to 7.0% when the CO2 flow rate was reduced from λ = 10.78 to 3.01. Interestingly, an even lower FE for CO was observed under combined back pressure and low λ conditions (from 26.7% to 4.4%). Back pressure enhanced CO production at higher λ, whereas it appeared to facilitate the opposite at lower λ. This suggests that the surface coverage at combined back pressure and low flow rates offers an environment where CO* does not desorb but further reacts to C2+ products. Lower λ conditions showed H2 FEs similar to that of high λ, at the ≈25% range, independent of back pressure. HER was not suppressed at combined low λ and back pressure ( = 25.0%) as much when compared with high λ and back pressure case ( = 14.9%). The interpretations from CO and H2 production signal that CO2 surface coverage reaches a smaller extent under lower flow rates, leading to lower CO* coverage and more abundant H*. going up to 1.83% at low λ confirms that H* availability is higher at lower flow rates.
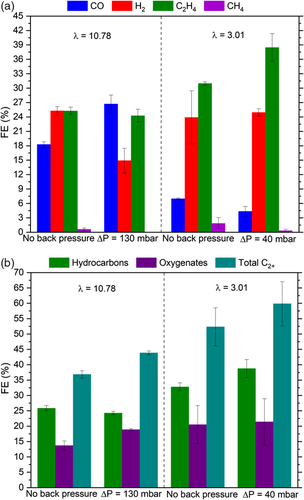
Most interestingly, a lower CO*/H* coverage ratio and shorter residence time obtained by combined back pressure and low λ boosted C2H4 production. is increased from 24.3% to 38.5% when a low flow rate is used in combination with back pressure. A smaller improvement to the base case, to of 31.0%, is observed at low flow rates without back pressure, this would suggest that back pressure contributes significantly to overall improvement and that the combined effects of optimum CO*/H* coverage and longer residence time in the catalyst layer favor C2H4 formation. Together with boosted C2H4 production, = 60% was achieved by combining back pressure and low flow rates, which is significantly greater than the 37% achieved in the base case (Figure 8b).
Finally, Figure 9 shows how C2+ conversion efficiency depends on feed flow rate and back pressure. A combination of low feed flow rate and back pressure delivers the highest C2+ conversion efficiency at 19.8%, compared to 3.5% in the base case. Significantly lower levels of unconverted CO2 at low feed flow rates and higher selectivity towards C2+ with back pressure and low flow rate enable this remarkable improvement in the conversion efficiency. C2+ conversion efficiency is defined in the Equation (3) in the Experimental section.
4 Conclusion
CO2RR on CuO gas diffusion cathode electrodes was investigated in a flow cell environment at an applied current density of 200 mA cm−2 under various back pressures and feed flow rates. Applying back pressure of 130 mbar was shown to prolong the stable operation time to 72 h ( < 50%, > 20%), doubling the duration observed from the base case. A high CO* coverage due to abundant provided by back pressure suppresses HER by blocking the active sites and/or changing the H* binding energy. Suppressing HER increases the selectivity toward CO2RR products in addition to prolonging CO2RR stability. By differing the partial pressure of CO2 at ΔP = 130 mbar, the primary reason for stability increase with back pressure application was shown to be abundant coverage rather than decrease in the degree of electrode flooding.
Back pressure at ΔP = 130 mbar not only lowers H2 production, but also enables higher production of CO and oxygenates. The ratio of oxygenates to hydrocarbons can be tuned from 0.53 to 0.85 at ΔP = 0–130 mbar range. This enhancement in oxygenate production stems from higher selectivity toward ethanol and propanol and is suggested to be driven by the formation of *CHCHOH intermediates under higher CO* coverage. While boosting stability and oxygenate selectivity, back pressure also results in a loss of CO* by desorption and therefore high CO production, possibly due to high coverage and short residence times in the electrode. For this reason, back pressure and low flow rates were combined to ensure a longer residence time and a more optimum coverage for C2H4 formation. This enabled a significant reduction of CO in favor of C2+ products, mainly ethylene. FEs of 38.5% for ethylene and 60% for C2+ and CO2 conversion efficiency to C2+ of 19.8% were reached. Mild CO*/H* coverage and long residence time in the catalyst layer are shown to be optimal for C2H4 production.
In summary, we demonstrate that the method of controlling back pressure is an easily implementable option in industrial applications toward manipulating the product selectivity in upscaled Cu-based CO2 electrolysis cells. Further research must be done to achieve the optimum electrode and cell design that enables a more stable operation for a possible future commercialization.
Acknowledgements
The authors thank Luke Luisman and Iain Malone from Johnson Matthey Public Limited Company for supplying the CuO cathode catalyst. B.S. would like to express his gratitude to Katia Rodewald from Technical University of Munich for her support with scanning electron micrograph characterization of the electrodes, to Professor Dr. Wolfgang Eisenreich from Technical University of Munich for his support with NMR measurements, to Nemanja Martic for conducting XRD measurements, and to Dr. Remigiusz Pastusiak and Dr. Kerstin Wiesner-Fleischer for the valuable discussions and support in the laboratory. B.S. and S.L. acknowledge support from the TUM Graduate School. This research did not receive any specific grant from funding agencies in the public, commercial, or not-for-profit sectors.
Open Access funding enabled and organized by Projekt DEAL.
Conflict of Interest
The authors declare no conflict of interest.
Open Research
Data Availability Statement
The data that support the findings of this study are available in the supplementary material of this article.


