Reversible High Capacity and Reaction Mechanism of Cr2(NCN)3 Negative Electrodes for Li-Ion Batteries
Abstract
A detailed study of the electrochemical reaction mechanism between lithium and the trivalent transition-metal carbodiimide Cr2(NCN)3, which shows excellent performance as a negative electrode material in Li-ion batteries, is conducted combining complementary operando analyses and state-of-the-art density functional theory (DFT) calculations. As predicted by DFT, and evidenced by operando X-ray diffraction and Cr K-edge absorption spectroscopy, a two-step reaction pathway involving two redox couples (Cr3+/Cr2+ and Cr2+/Cr0) and a concomitant formation of Cr metal nanoparticles is apparent, thus indicating that the conversion reaction of this carbodiimide upon lithiation occurs only after a preliminary intercalation step involving two Li per unit formula. This mechanism, evidenced for the first time in transition-metal carbodiimides, is likely behind its outstanding electrochemical performance as Cr2(NCN)3 can maintain more than 600 mAh g−1 for 900 cycles at a high rate of 2 C.
1 Introduction
The global energy demand and the necessity to store electrical energy is a hot topic in today's research. In this context, the development of Li-ion batteries has attracted a great amount of attention because of their high energy density. The performance of commercial graphite anodes (showing a specific capacity of 372 mAh g−1), however, has already reached the technological limit, so in the past decades great efforts have been devoted to the development of alternative high-capacity and long-cycle-life anodes.1-3 The main goal of this research is thus to seek for safer and higher specific capacity anode materials and study their reaction mechanism. To achieve that, numerous candidates from the p-block of the periodic table have been explored, such as silicon, tin, antimony, and phosphorus, as well as their oxides, sulfides, carbonates, etc.4-21 Conversion-type materials have also been widely explored.22-25 Among them, transition-metal-based compounds seem to be exciting and potential alternatives for graphite due to their high theoretical specific capacity. Nonetheless, several problems, such as high irreversible capacity in the first lithiation and a weak cycle life, prevent their practical use. The main reasons of such drawbacks are the formation of unstable solid electrolyte interphase (SEI) layers and huge volume expansion during the lithiation and delithiation processes.26
A newer class of transition-metal carbodiimides (MNCN, with M = Fe, Mn, Co, Cu, Zn, Ni) has emerged as promising anode materials for both Li- and Na-ion batteries. In 2016, our group reported the excellent performance of FeNCN with, for example, an impressive rate capability up to 30 C and stable capacity for more than 100 cycles.27 This article was followed by other reports exploring the reaction mechanism of transition and main-group metal carbodiimides versus Li and Na ions.28-32 Similarly to most transition-metal based anode materials, these materials are expected to react electrochemically with lithium through a conversion reaction but the reaction pathways or mechanisms of these carbodiimides, especially the trivalent ones, are not yet completely clarified.
In this work, we investigate the properties of Cr2(NCN)3—the only known trivalent transition-metal carbodiimide, to the best of our knowledge—as anode material for Li-ion batteries. It is worth recalling that Cr2O3—the oxide analogue of Cr2(NCN)3—has already been studied for its high theoretical capacity and low operating voltage compared to other transition-metal oxides.33-38 Cr2O3 reacts electrochemically with Li via a conversion reaction involving one redox couple (Cr3+/Cr0). However, the low electrical conductivity, the unstable SEI film, and the large volume change during cycling have hindered its possible application as an anode material. To overcome these issues, many researchers have turned to more sophisticated and therefore expensive approaches such as surface-modified Cr2O3 and also Cr2O3/carbon composites to improve its electrochemical performance.21, 39-47 This work shows that the electrochemical mechanism of the reaction of Cr2(NCN)3 with lithium is completely different from that of its oxide analogue, and how this difference influences its performances in lithium batteries.
2 Results and Discussion
2.1 Characterization of Materials
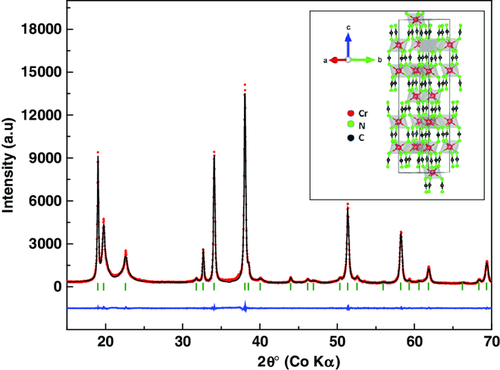
The refinement (Figure 1) of the X-ray diffraction (XRD) pattern of pristine Cr2(NCN)3 powder confirms that it crystallizes in the rhombohedral space group Rm, in agreement with Tang et al.48 The crystal packing of alternating layers of cations and anions along the c-axis is similar to that of other divalent transition-metal carbodiimides. Because of the larger cationic charge, however, the packing of the Cr layers is less dense than in the latter carbodiimides, with each Cr atom surrounded by only three Cr neighbors. The chromium coordination by N atoms corresponds to a slightly distorted octahedron. The Fourier transform infrared spectroscopy (FT-IR) and Raman spectra are shown in Figure 2a. The FT-IR results are comparable with those of Tang et al.48, with the asymmetric stretching modes of the (NCN)2− units visible as a strong peak at 2003 cm−1 and a broad peak between 2050 and 2150 cm−1. The bending contributions are visible at 633 and 695 cm−1. As reported previously and as expected from the D∞h point-group symmetry of the N═C═N2− carbodiimide moiety, its symmetric stretching is generally inactive in IR, and active only in Raman spectroscopy.48, 49 In the case of the N≡C—N2− cyanamide unit, conversely, such vibrations are active in IR-providing bands also in the range 1200–1400 cm−1 but they are absent in this case and rule out the presence of such ligands. From the Raman spectrum, the symmetric NCN vibration is found as a broad bump in the range 1300–1420 cm−1. The asymmetric and the deformation band ranges nicely match the IR spectrum values.

The scanning electronic microscopy (SEM) image, shown in Figure 2b, reveals an intergrowth of flakes that look like desert rose petals with a size of several micrometers. As reported for other transition-metal carbodiimide materials,32, 50 Cr2(NCN)3 also undergoes a minor initial weight loss (≈1.1%) in the 0–350 °C range followed by an abrupt loss (≈28%) at 400 °C, as shown from the thermogravimetric analysis (TGA) yellow plot in Figure 2b. The initial loss is mainly due to the departure of adsorbed water from the surface of the sample, whereas the second one corresponds to the decomposition into chromium oxide.50 The final weight loss step from 500 to 700 °C can be attributed to the decomposition to form nanocrystalline chromium oxide as seen in the normal transition-metal oxides.51
2.2 Electrochemical Performance
The electrochemical performance of Cr2(NCN)3 was investigated by cyclic voltammetry and galvanostatic cycling. The cyclic voltammetry results obtained for Cr2(NCN)3 between 0.005 and 3 V at 0.05 mV s−1 are shown in Figure 3a. Similarly to all transition-metal carbodiimides,8, 21, 26, 27, 32 a significant difference between the first cycle and subsequent ones is clearly visible in the cyclic voltammetry (CV) profile. This behavior is typical of conversion-type materials that undergo huge morphological and structural changes during the first lithiation.22 Indeed, the sharp and intense cathodic peak (P1) located at 0.43 V is attributed to conversion of micrometric Cr2(NCN)3 particles into a nanocomposite made of chromium metal and Li2NCN (vide infra). During the second and subsequent lithiation processes, the cathodic broadened peak (P2) takes place at a higher potential (0.85 V), indicating a lower polarization for the conversion reaction induced by the typical material nanocrystallization. Whereas cathodic scans show only one broadened peak, the anodic ones (P3, P4) exhibit two broadened peaks at 1.5 and 2.5 V associated with the oxidation of chromium, suggesting a two-step mechanism (cf. inset in Figure 3a). The minor peaks below 0.3 V are probably due to some (de)intercalation of lithium ions in/from the carbon matrix21, 41, 43 or to the reversible precipitation/dissolution of a polymeric product of the partial decomposition of the electrolyte (vide infra).

The galvanostatic profile (Figure 3b) is in good agreement with CV observations concerning the nature of the involved processes: peak P1 would correspond to the long plateau observed in the first lithiation at 0.6 V, corresponding to the conversion reaction of Cr2(NCN)3, whereas the other peaks correspond to the slopes observed during the following lithiations (P2) and delithiations (P3 and P4). Moreover, the galvanostatic profile also highlights the high irreversible capacity during the first lithiation. Indeed, depending on the current density, the initial specific capacity can range from 1200 to 800 mAh g−1 for C/10 to C/4, respectively, which significantly exceeds the theoretical capacity of 718 mAh g−1. This irreversible extra capacity generally disappears after ten cycles (see Figure 3c).
This phenomenon is commonly observed in conversion anode materials and constitutes one of their main drawbacks.52 It is usually explained, in analogy with transition-metal oxide anode materials,21, 26, 43 by the reversible formation/dissolution of a thin polymeric gel film at the surface of the transition-metal nanoparticles (created by the conversion of the initial compound) via the partial degradation of electrolyte components such as alkyl carbonates at low potentials, usually occurring in the slopy region below 0.5 V.18, 26, 53-56
Regarding capacity retention and cycle life, after the first 10 cycles the Cr2(NCN)3 electrode stabilizes and maintains a stable capacity exceeding 600 mAh g−1 for more than 500 cycles when cycled at a current density of 360 mA g−1 (Figure 3c), and more than 500 mAh g−1 is maintained after 950 cycles (Figure SI-1, Supporting Information). The coulombic efficiency rapidly reaches an average of 99.2% and increases slightly to 99.7% after 500 cycles. It is worth noting that the observed increase of capacity around 200 cycles is also commonly observed in transition-metal conversion anode materials.21, 56
Another excellent property of the Cr2(NCN)3 electrode is its rate capability. Figure 3d shows that even at 4 C (480 mA g−1) a capacity as high as 540 mAh g−1 can be retained without any deterioration of the active material, showing that this anode material can easily manage fast (dis)charging. This excellent capability rate reflects the overall high conductivity (both electronic and ionic) of the chromium carbodiimide electrode. All these excellent electrochemical features make Cr2(NCN)3 the best carbodiimide observed until now in terms of capacity and capacity retention.
2.3 Density Functional Theory Study
To understand the reaction pathway during a discharge process, one needs to conduct a thorough survey of the possible intermediate compounds, that is, Li–Cr–NCN ternaries. Here, four structural bases were adopted,48, 59 i.e., Cr2(NCN)3, Li2NCN, CrNCN, and LiCr(NCN)2, as shown in Figure SI-2, Supporting Information. A 3 × 3 × 1 supercell was used for Li2NCN (or CrNCN) and 2 × 1 × 1 for LiCr(NCN)2. For Cr2(NCN)3, the unit cell was used since the number of atoms included in a unit cell was large enough. Based on these structures, Li insertion and (or) Li/Fe exchange were conducted to create 154 Li–Cr–NCN ternaries at various configurations. The Ewald summation technique implemented in Pymatgen was employed to identify the compound that gives the lowest electrostatic energy at each given configuration, as tabulated in Table 1.
| Structural basis | Space group | Number of calculated compounds |
|---|---|---|
| Cr2(NCN)3 | (no. 167) | 30 |
| Li2NCN | I4/mmm (no. 139) | 41 |
| CrNCN | P63/mmc (no. 194) | 51 |
| LiCr(NCN)2 | Pbcn (no. 60) | 32 |
As one could suspect from the battery equation, there are two ideal reaction pathways for trivalent carbodiimides upon lithiation. The first one presents a conversion reaction to occur only after a complete intercalation reaction, in other words, sequential intercalation and conversion (denoted as Cr3+–Cr2+–Cr0). The second one indicates a pure conversion reaction from the very beginning to the end of lithiation without any intercalation reaction, that is, a one-step conversion reaction (denoted as Cr3+–Cr0). In addition, there could be a third one that combines both, in which the intercalation and conversion reactions occur simultaneously (denoted as “mixing” mechanism).
These established compounds were then classified depending on which pathway they belong to, as shown in Figure 4. As regards Cr3+–Cr2+–Cr0, Li ions intercalate into the Cr2(NCN)3 cathode, without introducing a major structural transformation (at low lithium content). A concomitant reaction occurs in the electrode where Cr3+ ions get reduced to Cr2+, rather than to elemental Cr0. In this stage, the Li–Cr–NCN ternaries share a general formula LixCr2(NCN)3 (0 < x ≤ 2). After a full Li intercalation, a conversion reaction dominates, where two Li+ ions exchange for one Cr2+ (due to the charge balance) and the ternaries share a general formula of LixCr3−x/2(NCN)3 (2 < x < 6). For Cr3+–Cr0, no intercalation reaction occurs and a conversion reaction dominates from the very beginning. It means that three Li+ ions exchange for one Cr3+ for charge compensation, which yields a general formula of LixCr2−x/3(NCN)3 (0 < x < 6) for the ternaries. In addition, the compounds that follow the so-called mixing mechanism have a more flexible atomic configuration.
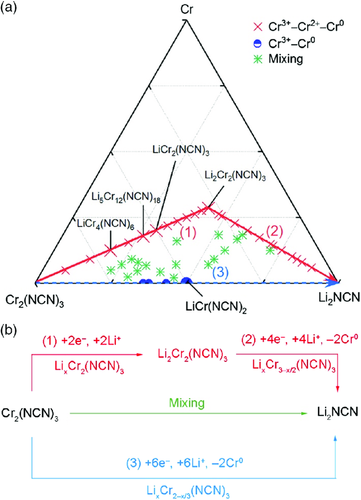
The ternaries that yield negative formation energies are shown in the phase diagram (Figure 4a). Most of the stable compounds belong to the Cr3+–Cr2+–Cr0 or the “mixing” mechanism, so the Cr3+–Cr2+–Cr0 pathway is energetically preferred. Following Cr3+–Cr2+–Cr0, one can observe an inflection point between pure intercalation and pure conversion reactions. At stage (1), two Li ions delivered through the electrolyte and two electrons from the external loop gather at the electrode Cr2(NCN)3 to form Li2Cr2(NCN)3.61 At stage (2), as the lithiation continues, four Li ions and electrons join into the electrode to eventually form Li2NCN, accompanied by a deposition of elemental Cr0. For the Cr3+–Cr0 mechanism, however, a direct conversion reaction dominates. During stage (3), six Li ions and electrons enter the electrode with a concomitant deposition of elemental Cr0 (Figure 4b).
Figure 5a shows the formation energies of the intermediate compounds with respect to the Li content. The set of ground-state structures giving an energy lower than any other structure of the same composition forms an energy convex hull.62 The convex hull for the Cr3+–Cr2+–Cr0 (Cr3+–Cr0) pathway is displayed with a red solid (blue dotted) line. It shows that at a wide range of Li content, namely, the Li–Cr–NCN ternaries following the Cr3+–Cr2+–Cr0 pathway, is much more stable than the Cr3+–Cr0 counterparts. Resembling the cell voltage, each voltage pair (two stable ternaries with adjacent Li content) gives a voltage plateau. By combining all voltage plateaus along the reaction pathway (energy convex hull), we obtain the corresponding voltage profile shown in Figure 5b. For comparison, we also present the experimental profile obtained below C/10 rate at the second cycling in a Li-ion battery. The computed stepwise profile for the Cr3+–Cr2+–Cr0 pathway agrees nicely with the experiment and, therefore, confirms the hypothesis that a conversion reaction occurs only after a complete intercalation reaction for Cr2(NCN)3 upon lithiation.
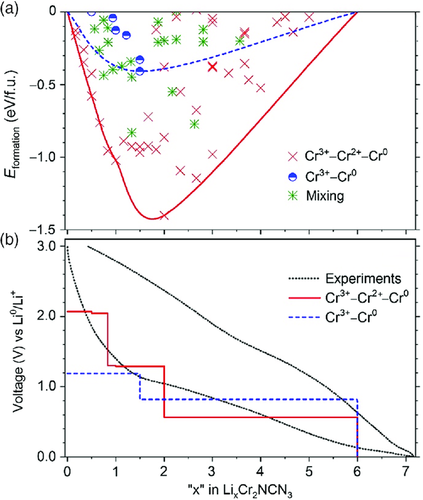
During the discharge (lithiation) process of the Cr2(NCN)3 electrode, a reduction reaction occurs. The electrochemical reduction potentials of Li+/Li0, Cr3+/Cr2+, and Cr3+/Cr0 redox couples are −3.04, −0.42, and −0.74 V, respectively, according to previous literature results.63 Electrochemically speaking, the more positive the reduction potential of a redox couple, the greater the species’ affinity for electrons and tendency to be reduced. That means a reduction from Cr3+ to Cr2+ is much more likely to take place than that from Cr3+ to Cr0, which provides another explanation for the aforementioned assumption.
2.4 Experimental Examination
To establish the reaction mechanism of Cr2(NCN)3 versus lithium and validate the DFT results, combined XRD and X-ray absorption spectroscopy (XAS) operando analyses were conducted. Operando XRD patterns collected during the first discharge and first charge are plotted as a function of time in Figure 6, together with the corresponding galvanostatic profile. At first discharge, the main intense reflections of Cr2(NCN)3, namely, (006), (012), and (116), are clearly visible and remain unchanged until the first pseudoplateau. After that, a gradual decrease of intensities is observed, indicating the reaction of Cr2(NCN)3 with lithium.
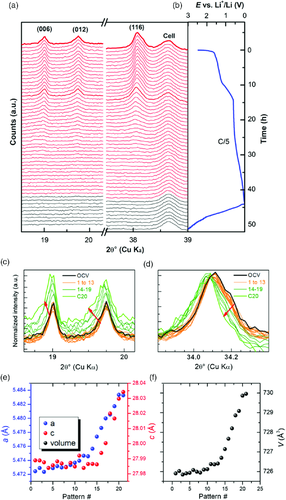
At the end of discharge and during the whole charge process, no trace of crystalline products is observed by XRD, so either the phases formed are amorphous or their crystallites are smaller than the detectable range of XRD (usually a few nanometers, depending on the investigated material). This amorphization effect renders the data collected after 20 h unutilizable. A closer observation of the diffraction peak between open-circuit voltage (OCV) and 20 h (after intensity normalization at the (116) reflection), however, shows a slight but clear shift toward low angles (Figure 6c,d). The shift is very small between OCV and pattern #13, but becomes more significant between pattern #14 and #20. It is worth noting that the peaks of the beryllium window of the in situ cell serving as an internal calibration standard are not shifted during cycling, confirming that the active material's volume is enlarged by lithium intercalation (see Figure SI-3, Supporting Information). In conclusion, the observed change of the lattice parameters at the beginning of lithiation supports an intercalation Cr3+–Cr2+ pathway, while the subsequent amorphization process is in good agreement with the Cr2+–Cr0 conversion process. This observation is in line with the reaction pathway predicted by DFT calculation, which includes an intermediate intercalation step with the formation of a stable insertion compound.
Additional short-range information was obtained based on XAS, which is not affected by the loss of crystallinity of the material during reaction. A total of 70 in situ Cr K-edge XAS spectra were collected during the first lithiation, as shown in Figure 7a along with the corresponding galvanostatic profile. The different current rates in the electrochemical test from C/8 to C were imposed to complete the discharge within the available beamtime. For the same reason, it was impossible to collect in situ data during the subsequent delithiation, and only selected ex situ XAS spectra were collected at different states of charge. Considering the difficulty of accurately analyzing each spectrum separately, a chemometric approach implying principal component analysis (PCA) and multivariate curve resolution–alternating least squares (MCR–ALS) analyses was conducted to extract the maximum useful information from this large dataset. A detailed description of this analytical approach is given by Fehse et al.64 The PCA variance plot shown in Figure SI-4, Supporting Information, suggests that at least three components are needed to describe the whole dataset. These three pure components were reconstructed thanks to the MCR–ALS algorithm (Figure 7c). The evolution of the reconstructed components during the discharge is shown in Figure 8. The three components, representing the pristine material (Comp1), an intermediate species (Comp2), and the final discharge product (Comp3), were analyzed using standard methods. Component 2 shows its maximum after 40 spectra from the beginning of the discharge, corresponding to the reaction of about five Li+ with Cr2(NCN)3.
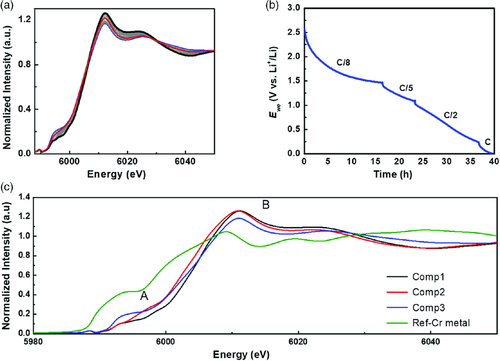
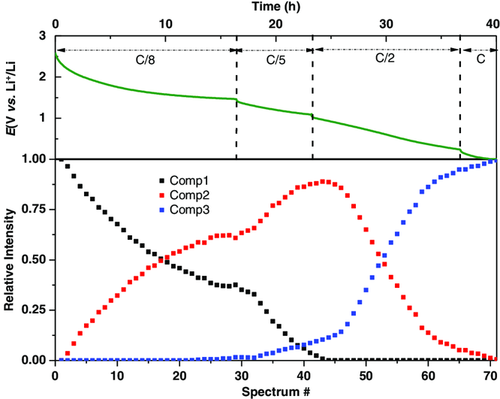
The near edge structure (XANES) of the reconstructed XAS components is very sensitive to the metal valence and coordination. The spectrum of component 1 overlaps with that of the pristine Cr2(NCN). Moreover, the pre-edge doublet seen around ≈5993 eV is commonly observed for Cr3+,65, 66 in line with the attribution of component 1 to pristine Cr2(NCN)3. The slight shift toward lower energies observed on going to component 2 testifies the reduction of Cr3+ to Cr2+, which is again consistent with the Cr3+–Cr2+–Cr0 pathway predicted by theoretical calculations (vide supra). Apart from the edge shift, the difference between Cr2+ and Cr3+ spectra can also be seen in the appearance of an intense shoulder on the absorption edge, usually observed for divalent chromium.67 Finally, the broad bump at ≈5992 eV appearing in component 3 corresponds well to the formation of Cr metal.67 However, the comparison of this spectrum with the Cr metal reference clearly shows that the conversion is incomplete. Therefore, the final component could correspond to a mixture of Cr2+ and Cr0. The comparison of the third component to the corresponding ex situ sample discharged at 0.005 V is given in Figure SI-5b, Supporting Information.
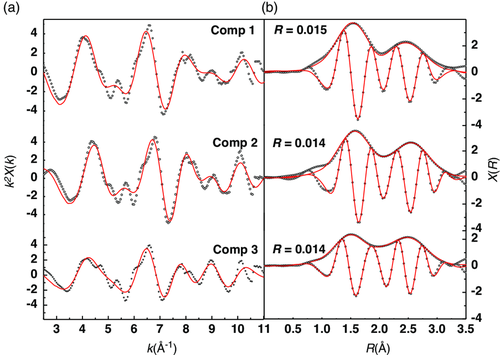
In contrast to XANES, the extended fine structure (EXAFS) region of the XAS spectra provides information about the local coordination environment and bond distances around the chromium centers. The EXAFS oscillations in reciprocal (k)-space and the magnitude of their Fourier transform in direct (R)-space of the reconstructed components are shown in Figure 9. Using the model for the pristine Cr2(NCN), the central Cr atom is surrounded by six N atoms at 2 Å and by six C atoms at 2.9 Å, so we need to consider the multiple scattering path due to the Cr—N═C and the single scattering path due to three Cr at 3.1 Å. As regards the obtained results for the first four shells of pristine Cr2(NCN)3, the bond distances coincide well with the theoretical values, and the Debye–Waller factors (σ2) hold reasonable values (Table 2). Component 2 could be fitted directly with the same pristine structure. The partial conversion of Cr3+ to Cr2+ seen in the XANES region is indicated here by slightly longer bond distances in the first and second shell without, however, registering major structural changes. It confirms that lithium intercalates into the Cr2(NCN)3 host, leading to the intermediate species LixCr2(NCN)3, which possibly contains both Cr3+ and Cr2+, in line with the theoretical calculations. Finally, component 3 at the end of discharge is optimally fitted by combining the first two shells of LixCr2(NCN)3 and the first shell of Cr metal, leading to a phase composition corresponding to about 45% LixCr2(NCN)3 and 55% Cr. The slightly lower Cr—Cr bond distance compared to bulk Cr metal suggests the formation of disordered and/or nanosized structure of the Cr metal particles, in line with XRD observations and usually obtained results in conversion reactions.22 The final phase at the end of first lithiation can be thus defined as the mixture of LixCr2(NCN)3, Li2NCN (implicitly formed by the complete reaction of pristine Cr2(NCN)3) and Cr metal nanoparticles.
| State | Phase | Shell | N | R theory | R measured | σ 2 | |
|---|---|---|---|---|---|---|---|
| Comp1 | Cr2(NCN)3 | Cr–N | 1 | 6 | 2.090 | 2.054(1) | 0.010(1) |
| Cr–C | 1 | 6 | 2.973 | 3.034(3) | 0.010(1) | ||
| Cr–N–C | 1 | 12 | 3.115 | 3.163(4) | 0.010(1) | ||
| Cr–Cr | 1 | 3 | 3.161 | 2.953(1) | 0.013(2) | ||
| Comp2 | Cr2(NCN)3 | Cr–N | 1 | 6 | 2.090 | 2.061(1) | 0.010(1) |
| Cr–C | 1 | 6 | 2.973 | 3.132(2) | 0.010(1) | ||
| Cr–N–C | 1 | 12 | 3.115 | 3.195(4) | 0.010(1) | ||
| Cr–Cr | 1 | 3 | 3.161 | 2.963(1) | 0.011(2) | ||
| Comp3 | Cr2(NCN)3 | Cr–N | 0.45 | 6 | 2.090 | 2.016(1) | 0.009(1) |
| Cr–Cr | 0.45 | 3 | 3.161 | 3.149(2) | 0.005(1) | ||
| Cr | Cr–Cr | 0.55 | 8 | 2.497 | 2.419(1) | 0.029(1) | |
| Cr–Cr | 0.55 | 6 | 2.883 | 2.975(2) | 0.009(2) | ||
| 1.5 V | Cr2(NCN)3 | Cr–N | 0.78 | 6 | 2.090 | 2.029(1) | 0.011(1) |
| charge | Cr–Cr | 0.78 | 3 | 3.161 | 3.008(2) | 0.008(1) | |
| Cr | Cr–Cr | 0.22 | 8 | 2.497 | 2.678(1) | 0.011(1) | |
| Cr–Cr | 0.22 | 6 | 2.883 | 2.903(2) | 0.005(2) | ||
| 3 V | Cr2(NCN)3 | Cr–N | 0.90 | 6 | 2.090 | 2.036(1) | 0.008(1) |
| charge | Cr–Cr | 0.90 | 3 | 3.161 | 2.967(2) | 0.006(1) | |
| Cr | Cr–Cr | 0.10 | 8 | 2.497 | 2.687(1) | 0.017(1) | |
| Cr–Cr | 0.10 | 6 | 2.883 | 2.837(2) | 0.003(2) |
To investigate the reversibility of the lithiation process, two ex situ electrodes stopped at 1.5 and 3 V through the charge were analyzed. The XANES and EXAFS portions of the ex situ charged samples were analyzed and compared with the spectra at the end of the discharge and pristine material (Figure 10). Increasing the voltage from 0 to 1.5 V results in a slight positive shift of the XANES edge corresponding to the partial oxidation of chromium atoms. EXAFS fitting (Figure 10b,c) of this particular state leads to 78% LixCr2(NCN)3 species with very short Cr—N distances and 22% Cr metal. At 3 V, the EXAFS spectrum is very similar to that of the pristine electrode. Its fitting shows that 90% of the Cr metal was oxidized back to Cr3+ (and possibly some Cr2+). A similar conclusion can be drawn from the Fourier transform of the ex situ data shown in Figure SI-5c, Supporting Information.
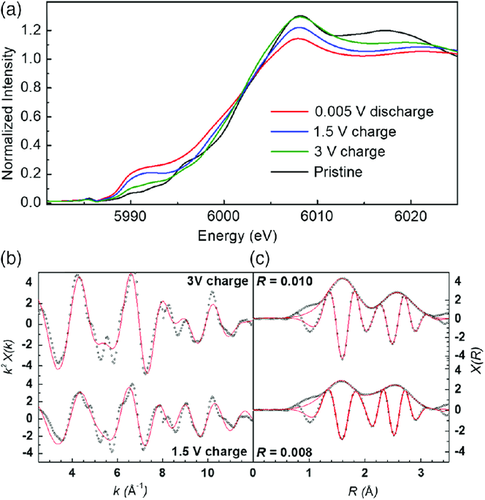
To summarize, the delithiation mainly leads to oxidized chromium (Cr3+ and possibly some Cr2+) but, as expected, the delithiated phase is not identical to that of the pristine Cr2(NCN)3 due to structure disorder, amorphization, and/or an incomplete oxidation process. Such an ill-defined structure, however, is not an obstacle to achieving outstanding electrochemical performance, due to the nanostructured electrode produced during the first lithiation.
2.5 Proposed Mechanism
-
Upon lithiation
- Cr2(NCN)3 + xLi → LixCr2(NCN)3 (x < 2)
- LixCr2(NCN)3 + (6 − x)Li → 2Cr + 3Li2NCN
-
Upon delithiation
- 2Cr + 3Li2NCN → xCr2(NCN)3 + (1 − x)Li2Cr2(NCN)3 + (6 − 2x)Li
During the first stages of lithiation one mole of Cr2(NCN)3 reacts with fewer than two mole of lithium, and Li+ insertion causes a partial reduction of Cr3+ to Cr2+, leading to the formation of LixCr2(NCN)3. Even though it was impossible to determine its exact chemical composition and crystal structure given its low crystallinity, DFT calculations suggest the possible formation of different compositions such as Li0.5Cr2(NCN)3, Li5/6Cr2(NCN)3, LiCr2(NCN)3, and Li2Cr2(NCN)3 during lithiation. At the end of the lithiation, XAS evidences the formation of metallic chromium nanoparticles, therefore implying the concomitant formation of Li2NCN. Even though only partial reactions (intercalation and conversion) can be experimentally observed, they do not compromise the cycling performance of chromium carbodiimide. Lastly, the extra lithium consumed in the first lithiation is attributed to the partially reversible degradation of the electrolyte, leading to an active polymeric gel.26, 52 Similarly to all conversion materials, the huge irreversible capacity in the first lithiation is still an apparent demerit, to be solved by realizing an authentic intercalation carbodiimide material, a true challenge for both theory and synthesis.
3 Conclusions
In conclusion, we report the electrochemical performance and reaction mechanism of chromium carbodiimide as an anode material in Li-ion batteries. Cr2(NCN)3 offers superior cyclability and rate performance compared with the other divalent transition-metal carbodiimides. It exhibits a specific capacity as high as 600 mAh g−1 that can be sustained over more than 900 cycles at a 2 C current rate (240 mA g−1) with a coulombic efficiency close to 100%. Similarly to all other conversion-type anode materials, a huge irreversible capacity in the first lithiation is also observed for Cr2(NCN)3 due to the formation of the SEI layer and electrolyte degradation. DFT calculations rationalize the outstanding cycling performance of Cr2(NCN)3 which results from a two-step pathway for the lithium reaction. Instead of pure intercalation or pure conversion, Cr2(NCN)3 reacts by following a mixing mechanism combining Cr3+–Cr2+–Cr0 and Cr3+–Cr0 pathways. Therefore, we propose a two-step process involving two redox couples (Cr3+/Cr2+ and Cr2+/Cr0), as also witnessed from experimental operando and ex situ XRD and XAS analyses. This work opens a new approach for seeking transition-metal carbodiimide electrode materials allowing pure intercalation reactions for future lithium-ion and sodium-ion batteries of high energy, high power, and long lifespan.
4 Experimental Section
Synthesis
Chromium carbodiimide was prepared by a metathesis route via the reaction between CrCl3 and ZnNCN. All the synthetic steps were conducted in an argon-filled glove box. The reaction precursors consisted of CrCl3 and ZnNCN in a molar ratio of 2:3 and LiCl/KCl (46:54) as a flux. The reactants and flux were initially heated at 300 °C under dynamic vacuum for 12 h and 550 °C for another 2 days. Then, the resulting powder was washed with diluted HCl followed by water and acetone to get the final green-colored Cr2(NCN)3 powder.48
Material Characterization
XRD patterns were collected with a PANalytical Empyrean equipped with a Co Kα source. The profile fitting was done using PANalytical high score plus. Morphological characterization was performed by SEM (a Hitachi S-4800 scanning electron microscope equipped with a field emission gun). FT-IR and Raman spectroscopy measurements were done employing a Bruker spectrometer IFS66V equipped with an ATR diamond crystal and a confocal LabRAM Aramis spectrometer (Horiba), equipped with a HeNe laser, an 1800 grooves mm−1 grating, and a Peltier-cooled CCD detector, respectively. TGA was performed using a NETZSCH Jupiter STA 449 F1 thermobalance with a ramp rate of 5 °C min−1 in air flow.
Electrochemical Measurements
The electrochemical tests were conducted in coin-type half cells with a lithium foil as both the counter and reference electrode. In these cells, the Cr2(NCN)3 electrode was tested as the positive electrode, and therefore, in this article, the lithiation is referred to as the discharge and the delithiation as the charge. Electrodes were prepared by mixing 60 wt% Cr2(NCN)3 powder, 20 wt% conductive additives (carbon black and vapor-grown carbon nanofibers, VGCF) and 20 wt% carboxymethyl cellulose (CMC) as the binder together with water. The aqueous slurry was then coated over a copper foil via a traditional doctor blade technique with a thickness of 150 μm, dried at room temperature in air and finally at 100 °C under vacuum for 12 h. The disc-shaped electrodes with a 4 mm diameter were cut from the film with an active material loading of 1–2 mg cm−2 and mounted in coin cells inside an argon-filled glove box. Whatman glass fiber GF/D and a 1 m LiPF6 solution in ethylene carbonate (EC), propylene carbonate (PC), dimethyl carbonate (DMC) (1:1:3 in weight) with 2% vinyl carbonate (VC) and 5% fluoroethylene carbonate (FEC) additives were used as the separator and the electrolyte, respectively. Galvanostatic measurements were performed using Biologic and/or Neware systems at a C/n rate (indicating 1 mole of Li reacted in n h mole−1 of Cr2(NCN)3). CV measurements were performed with a scan rate of 0.05 mV s−1 between 0.005 and 3 V.
Operando and Ex Situ Measurements
Operando XRD measurements were conducted using self-supported electrodes in a specially designed in situ cell68 at C/8. All the Cr K-edge XAS measurements (operando and ex situ) were conducted in the transmission mode at the ROCK beamline69 of the SOLEIL synchrotron. For the in situ XAS measurements, an aqueous slurry containing the formulated electrode material was directly cast on the beryllium window of the specially designed in situ cell,70 whereas ex situ electrodes were the 4 mm diameter pellets recovered from the coin cells cycled until the desired voltage. In XAS experiments, the monochromatic X-ray beam intensity was measured by three consecutive ionization detectors, with the in situ cell placed between the first and the second ionization chamber and a Cr metal reference between the second and the third one, respectively, to ensure energy calibration during the XAS experiment. Electrochemical measurement began initially at a C/8 rate, but later sped up to C/5, C/2, and then C to complete the collection of the XAS data of the whole lithiation process within the allocated beamtime. A few selected ex situ XAS spectra were measured to study the following delithiation. The energy calibration and normalization of the operando XAS spectra were performed using the Athena software.71 The normalized operando spectra were analyzed globally using a chemometric approach implying PCA and MCR–ALS, via a procedure described in detail by Fehse et al.64 This analysis allows one to extract the pure spectral components that are necessary to describe, via adapted linear combinations, the entire dataset. Such components, as well as the ex situ spectra, were finally analyzed using the Arthemis software.71 Fourier transforms of the EXAFS data were performed in the 3–10.5 Å−1 k range, and the fitting was done in the R-space up to 3.5 Å.
DFT Simulation
Spin-polarized calculations were performed with projector-augmented-wave (PAW) potentials, as implemented in the Vienna ab-initio simulation package (VASP).72 The exchange-correlation parameterization as provided by PBE was adopted. To correctly include the coulombic interactions among the d levels in the transition metals, we used a Hubbard U = 3.5 eV for Cr, as successfully used in prior research by Jain et al.73 A plane-wave energy cutoff of 600 eV was set. The Vaspkit was used to generate Γ-centered Monkhorst–Pack k-meshes with a recommended value of 0.04 × 2π Å−1, which yields, for example, a k-mesh of 5 × 5 × 1 (7 × 7 × 3) for the simulated Cr2(NCN)3 (Li2NCN) unit cell. The Pymatgen tool was employed to establish hundreds of intermediate compounds during the discharge process.74
Acknowledgements
J.J.A. and K.C. contributed equally to this work and should be both considered as first authors. J.J.A. acknowledges ALISTORE-ERI for funding her Ph.D. grant. K.C. is grateful for the financial support from the Alexander von Humboldt Foundation. The simulation work was supported by the IT center of RWTH Aachen University under grant JARA-HPC (JARA0179). Synchrotron Soleil (France) is acknowledged for providing beamtime at the beamline ROCK. S. Belin and V. Briois are gratefully acknowledged for their expert advice on beamline operation. This work was supported by two public grants overseen by the French National Research Agency (ANR) as part of the “Investissements d'Avenir” program (Projects ANR-10-EQPX-45 (Equipex ROCK) and ANR-10-LABX-76-01 (Labex STOREX)).
Conflict of Interest
The authors declare no conflict of interest.


