Integrated Research as Key to the Development of a Sustainable Geothermal Energy Technology
Abstract
As estimated by the International Energy Agency, geothermal power can contribute to 3.5 % of worldwide power and 3.9 % to heat production by 2050. This includes the development of enhanced geothermal systems (EGSs) in low-enthalpy systems. EGS technology is still in an early stage of development. Pushing EGS technologies towards market maturity requires a long-term strategic approach and massive investments in research and development. Comprehensive multidisciplinary research programs that combine fundamental and applied concepts to tackle technological, economic, ecological, and safety challenges along the EGS process chain are needed. The Karlsruhe Institute of Technology (KIT) has defined a broad research program on EGS technology development following the necessity of a transdisciplinary approach. The research concept is embedded in the national research program of the Helmholtz Association and is structured in four clusters: reservoir characterization and engineering, thermal water circuit, materials and geoprocesses, and power plant operation. The proximity to industry, closely interlinked with fundamental research, forms the basis of a target-orientated concept. The present paper aims to give an overview of geothermal research at KIT and emphasizes the need for concerted research efforts at the international level to accelerate technological breakthrough of EGS as an essential part of a future sustainable energy system.
1 Introduction
1.1 Potential of geothermal energy
Geothermal energy offers an enormous potential for future power and heat provision. As a sustainable energy form, geothermal energy is renewable and low emission. It has a high availability and, as a domestic resource, it is decentralized and import independent. In contrast to other renewables, such as wind and solar power, geothermal energy is base-load capable and steerable. It is an ideal complement to fluctuating renewable energy sources within a renewable energy mix. Contributing to a secure future energy supply, geothermal energy is of major significance for the energy transition.
According to an estimation of the International Energy Agency (IEA), a contribution of deep geothermal energy of 3.5 % to the global electricity production and 3.9 % of projected final energy for heat by 2050 is realistic; thus avoiding 800 megatons of CO2, whereas half of the expected increase is made up by enhanced geothermal systems (EGSs).3 The IEA aims to install a minimum of 50 EGS research power plants and scaling up the EGS capacity by a factor of 3 until 2025. Eventually, 50 MWe power plants are planned to be realized in 2050 by the serial installation of EGS modules to achieve an EGS portion of 60 % of worldwide geothermal production. In Germany, geothermal energy is expected to provide 5 % of the power production and 10 % of the primary energy demand, providing that EGS technologies are utilized.
1.2 Requirements
EGS technologies have a key role for the establishment of geothermal technologies with a critical market share. However, the technology has not yet reached the state of maturity that is necessary for large-scale industrial application. The intended scaling up of power plant capacities from currently significantly below 10 MW to 50 MW in the future presents severe obstacles, including the assurance of efficiency, profitability, and safety of geothermal facilities. Among the most important challenges and milestones for EGS developments, as defined by the IEA,3 are 1) the reduction of drilling costs by advancing the development of cheaper drilling technologies; 2) arousing interest and confidence from investors in geothermal projects by defining medium- and long-term targets for geothermal energy technologies; 3) the economic harvesting of geothermal energy from different geological environments; and 4) improving social acceptability of the technology by controllability, that is, facing environmental impacts and safety.
Pushing EGS technologies towards market maturity presupposes a long-term strategic approach and requires massive investments in research and development. Comprehensive multidisciplinary research programs,1, 2 combining fundamental and applied research concepts, to tackle technological, economic, ecological, and safety challenges along the EGS process chain are required.
It is the task of fundamental research to create a sound basis for technological development by providing a profound understanding of the involved thermal, hydraulic, mechanical, and chemical (THMC) processes in the reservoir and underground and surface installations. To achieve this, there is an urgent need for an enhanced experimental benchmarking data set. This is also the necessary basis for the further development of numerical simulations, which enable model-based process predictions.
Generic test sites, and finally large-scale demonstration plants, have to be established for technological research and development based on objective criteria. Target-oriented research projects have to be defined in close cooperation with industrial partners.
It must be the distinct goal of all required research efforts to enhance—hand in hand with technological advancements for economic viability—the acceptability of EGS technologies for society in terms of ecological sustainability and risk mitigation. Indeed, this aspect has evolved to become a crucial issue, since public confidence in geothermal energy has weakened, particularly after incidents involving induced seismicity, as in Basel in 2006.4 In close collaboration with social sciences, communication and participation concepts on the basis of objective information and transparent research findings are necessary to accompany the envisaged technological breakthrough of EGS.
1.3 Transdisciplinary research concept
Objective and transparent research is of major significance for the technological development of EGS at the current state of technology advancement. Complying with the outlined complex requirements will be only successful with a systematic approach across disciplines and scales, incorporating new scientific concepts.
The Upper Rhine Graben (URG) offers remarkably favorable conditions for deep geothermal energy utilization (Figure 1). Hydrothermal convection cells in crystalline basement rocks and deep-seated sediments result in basal heat flow rates up to >150 mW m−2 and temperature gradients up to 110 °C km−1 in the URG. It is therefore not surprising that numerous geothermal projects have been developed, ranging from the well-established hydrothermal doublet system in Riehen to the newly installed EGS plant in Rittershoffen, France, used solely for the supply of industrial process heat. The European geothermal research project at Soultz-sous-Forêts became a milestone for the utilization of deep geothermal energy: The concept of EGS as a further advance of the hot dry rock approach was developed and made the URG a leading center of EGS technology development.
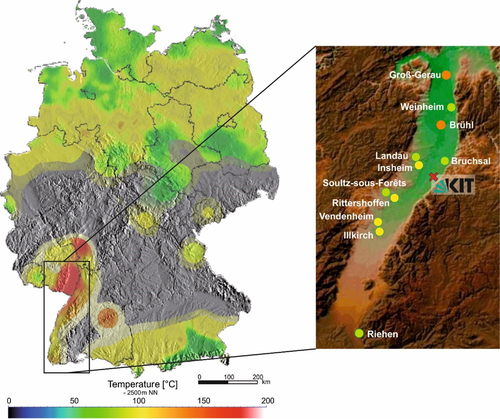
Underground temperatures in Germany at a depth of 2500 m. The enlarged part shows the URG, with the Karlsruhe Institute of Technology (KIT) close to geothermal projects. Green: project running, yellow: project under construction, orange: abandoned. Temperature map modified after Leibniz-Institut für Angewandte Geophysik (LIAG), Hannover.
The KIT, located within the URG, takes advantage of these framework conditions and has defined a comprehensive research program on EGS technology development, following the necessity of a transdisciplinary approach. Research activities cover the whole EGS process chain, including system integration and span from fundamental to applied research across scales. The geothermal research group at KIT has collaborated with various projects in both the German and French parts of the URG. The proximity to industry, closely interlinked with fundamental research, forms the basis of a target-orientated research concept. It incorporates not only the perspective of geoscientists, but combines the disciplines of geosciences, geophysics, materials science, engineering, geochemistry, and numerics.
The following overarching goals with respect to EGS technology development have been defined: 1) safe, predictable, and effective reservoir engineering; 2) enhanced productivity and economic feasibility; 3) minimal environmental impact; 4) systematic quality assurance; and 5) reliable and intelligent system integration.
These goals serve the final aim of sustainability and societal acceptability of EGS as a pillar of a future renewable energy portfolio.
The KIT research concept is embedded in the national research programs of the Helmholtz Association. The topic “geothermal energy systems” within the program “Renewable Energies” in the research fields “Energy” is tackled together with the partners GFZ (German Research Center for Geoscience) in Potsdam and UFZ (Helmholtz Center for Environmental Research) in Leipzig.
1.4 Necessity for large-scale infrastructures
An early technical breakthrough is critical to success in developing EGS and requires—together with the discussed interdisciplinary system thinking and multiscale approaches—technology-specific research infrastructures. Integration into national research programs allows, in addition to strategic medium- to long-term planning with the incorporation of various research groups, the establishment and provision of infrastructure platforms as a unique opportunity for large-scale research. To give EGS research urgently needed impetus, two large-scale infrastructures comprising both ends of the EGS process chain, which allow research close to real scale, are currently being planned or established, respectively: the underground facility of the Geothermal Underground Laboratory (GeoLaB) and the modular low-temperature power plant cycle Modularer Niedertemperaturkreislauf Karlsruhe (MoNiKa). MoNiKa and GeoLaB have the potential to form core elements of geothermal research and serve as interdisciplinary platforms for various research groups at KIT and the research community; these are already at the stage of planning and establishment.
MoNiKa is a generic power plant circuit to investigate low-temperature geothermal electricity production. It is designed as a modular and mobile test stand, which offers unique opportunities to study geothermal power generation and low-temperature power generation in general. The goal is to characterize the exchangeable main components and their interdependencies and, finally, to optimize power plant cycle thermodynamically and economically to achieve highest possible efficiency. Currently, the test facility is under construction (see Section 4.1).
The planned underground laboratory, GeoLaB, is designed as a generic underground research laboratory in the Black Forest or the Odenwald. The target rock is representative of the world's most widespread geothermal reservoir rock, the crystalline basement. GeoLaB shall address fundamental challenges of reservoir technology and borehole safety. The target goals of research in GeoLaB are 1) to increase the efficiency of EGS with a unique geothermal underground laboratory for fundamental research; 2) to reduce induced seismicity by controlled, in situ, high-flow experiments (CHFE) in a reservoir simulator; 3) to reduce the prospecting risk by benchmarking for future geothermal projects in crystalline rock; and 4) to promote the social acceptance of geothermal projects by developing methods and technology for efficiency, safety, and ecological sustainability. As an interdisciplinary and international research platform, GeoLaB will cooperate with the German Research Foundation (DFG), universities, industrial partners, and professional organizations to foster synergies and technological and scientific innovations. Hence, GeoLaB will significantly contribute to our understanding of processes associated with increased flow rates in crystalline rock (see Section 4.2).
2 Scientific Priorities
Forecasting processes and interactions of materials and circulating fluids within geothermal reservoirs and EGS power plants represent a major scientific goal. The operational reliability and economic viability remain to be demonstrated to gain the necessary support and acceptance from industry and the population. This gives rise to the following technological and scientific focuses for EGS-related research.
Detailed knowledge of the subsurface reservoir characteristics, including its complex structure, is of major importance for the success of geothermal installations during planning and establishment, reservoir engineering, and operation. Present exploration and monitoring methods are not standardized and often not suited to clearly identify potential reservoirs. The goal is to develop and standardize novel geophysical exploration and monitoring techniques, including inversion methods of magnetotelluric (MT) and gravimetric data and electromagnetic and self-potential monitoring. Accordingly, the high drilling costs and high prospecting risk due to the unreliable identification of exploitable zones can be minimized, which increases the attractiveness for potential investors. During stimulation and operation, knowledge about the subsurface structures and evolving geochemical and geomechanical characteristics of fractures are a prerequisite to understand the dynamic behavior of the reservoir and to develop, based on this knowledge, smart stimulation techniques. Efficient observation networks for temporally and spatially high-resolution (HR) data have to be defined to detect potential environmental impacts already in the forefront. Developing reliable data analysis and modeling techniques to image the seismic cloud are evidently a basic prerequisite in managing the seismic hazard.
Borehole integrity is a precondition for the safe and long-term operation of geothermal power plants. Experimental and simulation studies with a focus on durable and thermal shock resistant cementations and safe abandonment measures are the goal of ongoing research towards a long-term reliable sealing. In situ experiments, as an extension to laboratory studies, will provide new insights into the drilling behavior of brittle magmatic or metamorphic rocks with possibly extended damage zones and into the behavior of the involved materials and the complex interactions among each other and the surrounding rocks and fluids. Thus, reliable access to subsurface structures can be guaranteed, while ensuring integrity.
During operation of EGS power plants, a commonly observed phenomenon is the precipitation of minerals from geothermal fluids in surface installations. These mineral precipitations may incorporate naturally occurring radioactive minerals that are hazardous to human health and the environment. Current research focuses on the inhibition and avoidance of scaling; thus enhancing the safety and durability of EGS systems. Reduction of scaling will also enhance heat transfer and decrease pressure losses in the system.
Scaling occurring within the reservoir after reinjection of the thermal brine (e.g., baryte) can strongly decrease injectivity, and hence, the long-term efficiency of a plant. Fundamental understanding of the related processes of scaling formation forms the basis for the development of scaling inhibitors.
The highly saline character of the fluids and the high load of mineral particles cause mechanical abrasion, as well as corrosion, on power plant components. Related enhanced microbial activity inducing corrosion, even at lower temperatures, or biofilm formation are the focus of corrosion research. New resistive materials have to be selected and developed based on results gained from in situ and laboratory experiments with artificial and real geothermal brines.
The basis for an adequate selection of durable materials is a profound understanding of the influence of the fluid properties on the precipitation and corrosion process by hydrothermal simulations and hydrochemical modeling. Both experimental and modeling approaches are necessary to understand the relationship between geological parameters and structures and observed THMC processes in fractures and the reservoir.
Despite site-specific framework conditions, geothermal plants are still constructed from off-the-shelf components. Multiscale process simulations, combined with experiments, are essential to provide important insight into the processes at different resolution levels and to serve as a basis for the subsequent design and adaption of technical components. Hence, the operational costs, as well as expenses for investment and maintenance, can be minimized and the efficiency of components, such as pumps and heat exchangers, can be increased.
EGS systems require a vast range of measuring instruments to control their reliable installation and operation and to satisfy increasing environmental concerns of the public. There is a need to develop high-temperature logging tools that are economically suitable for deployment under conditions typical for geothermal reservoirs.
Developing an efficient reservoir through stimulation and managing the high flow rates in the reservoir to harvest geothermal energy in an economically viable, predictable, and sustainable manner is a core task of geothermal research and development. Essential conceptual achievements have been made to establish EGS technology, especially through projects in the URG. Current research aims to transfer the previously followed learning curve in this regard, which was rather practically and economically oriented and case specific, to universally applicable scenarios. Another focus is on the transferability of geothermal experience in sedimentary rocks, in which flow mostly takes place in the pores, to projects in crystalline rocks, in which fractures are the main flow paths.
To give EGS technology the decisive momentum towards a more widespread and socially accepted usage, research and development will be closely tied to previous EGS experiences. It is also crucial to develop a fundamental understanding of the THMC interacting processes in the reservoir to provide generic solutions. As a precondition for this, fundamental scientific data have to be acquired and new research approaches followed. High-rate fluid flow in fractured media has to be addressed. The currently unknown constitutive flow laws for large-scale processes have to be derived. The dynamic processes in space and time that result in mechanical stress variations have to be qualitatively and quantitatively described. A 4D benchmark data set of THMC parameters is needed.
A highly topical issue is the transfer of results from experimental laboratory data to the reservoir scale. The identification and quantification of experimental uncertainties, model uncertainties, and process uncertainties are integral parts of scaling processes up and down. A major focus of geothermal research must therefore be on the scale dependence of THMC processes and the development of strategies for scaling up and down. This includes process-related investigations based on multiple data acquisitions, data description, and modeling over various scales. These considerable research challenges can be successfully tackled with a technology-specific underground laboratory as a generic reservoir simulator to bridge laboratory and field scales and serve as a research platform across disciplines.
An underground laboratory, as proposed with the GeoLaB concept, can provide a further essential function: to serve as an objective information platform. Recent seismic events within the framework of EGS projects and their public perception show the importance of scientific outreach. Hence, the geothermal research community has to enter into a continuous dialogue with the public and be a neutral information platform to communicate technological risks and opportunities. The formulation of regulatory guidelines and political decision-making processes requires the unbiased scientific input of large-scale geothermal research.
3 Research and Development
Structured in four clusters, KIT scientists contribute to all major parts of the development of a geothermal project from the prospection and exploration of potential reservoirs to the economic operation of an EGS power plant. The four clusters are (Figure 2): 1) reservoir characterization and engineering, 2) thermal water circuit, 3) materials and geoprocesses, and 4) power plant operation.
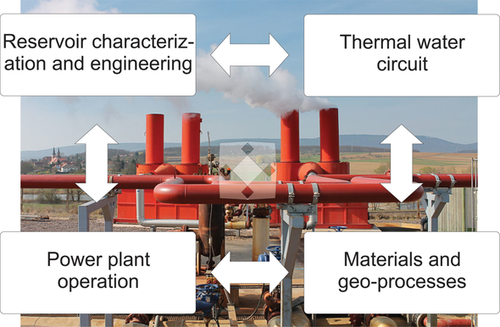
Overview of the four cross-cutting clusters of geothermal research at KIT.
These clusters comprise the EGS process chain and have numerous interfaces due to overlapping system processes, methodological cross-cutting issues, and increasingly due to future infrastructures as integrating research platforms (see Sections 4.1 and 4.2). This section provides a description of the clusters and gives an insight into ongoing work. It should also be considered an invitation to future collaborations.
3.1 Reservoir characterization and engineering
Central Europe hosts a number of important heat flux anomalies that are linked to upwelling fluids of enhanced temperature in a specific geological and tectonic setting. Major anomalies are located in the central URG to the east of the Black Forest5 and to the south of the Black Forest at the High Rhine,6 reaching heat flux densities up to 150 mW m−2. They are predestined for the development of EGS, since they are fault- and fracture-bound and susceptible to reservoir engineering measures.7 A reservoir characterization study is the basis for the development of a reservoir model.
For an optimization of the lifetime performance of a geothermal reservoir, a profound understanding of the reservoir rocks and fluids through accurate measurements and characterization is necessary.
Rock and fluid properties are characterized by formation evaluation based on downhole measurements, formation testing, and laboratory analyses. Petrophysical analysis is performed by using a wide variety of measurements to understand the reservoir and its detailed characteristics. Measurements at scales from pores to reservoirs are analyzed and interpreted to develop micro- and macrogeological models. Knowledge of local and field-wide structure and variability helps to achieve optimal reservoir performance and to avoid hazards.
Geophysical exploration methods provide a large image from the reservoir and its geological context, whereas wellbore-scale seismic and petrophysical data deliver detailed formation parameters. Large-scale sensing is used for the prospecting of geothermal reservoirs in all types of environments, providing the basis for a 3D reservoir model with its physical properties.
Reservoir engineering provides an understanding of fluid flow and phase behavior at all scales, for all kind of fluids and geological environments. A combination of downhole sampling and measuring techniques, as well as laboratory experiments, is used to estimate the reservoir potential and to model future performance. The integrative analysis of data acquired with various measurement techniques enables the development of sophisticated reservoir models to optimize reservoir performance, while mitigating seismic and environmental hazards.
In the following sections, specific research topics and results are presented.
3.1.1 Geophysical exploration of geothermally relevant faults
Geothermal exploration of EGS mostly targets the crystalline basement. The HR imaging of its structural setting from the surface is challenging. The nature of seismic reflectors within the crystalline basement remains the subject of inference, except where reflections have been traced directly to outcrop.8 Due to the lack of seismic reflectors, broadband MT surveys are crucial in geothermal exploration in volcanic areas to locate possible reservoirs. In particular, the detection of high-enthalpy reservoirs is performed indirectly through the detection of cap layers because their hydrothermal alteration products possess a high electrical conductivity.9 For the exploration of medium-enthalpy systems (<160 °C), the identification of fault zones is in the focus of recent research.10 Fractured reservoir zones may display a resistivity contrast to surrounding host rock when hydrothermal alteration products enhance electrical conductivity, and thus, can be resolved by audio-magnetotelluric (AMT) sounding by using adjusted interstation distances.11
Through an AMT approach, data are acquired in a period band of 10−3–512 s. A mean interstationing of 1–2 km is used on profiles of typically between 15 and 25 km. To respect geoelectric strikes, profiles are typically oriented perpendicular to the fault or fracture zones, on which convective heat transport is expected.12 Data are typically acquired over 1–3 days to allow for robust data processing. Measurements are performed by using Metronix MT stations with ADU-06 or ADU-07e data loggers, three MSF-06 or MSF-07e coil magnetometers, and four EFP-06 electrodes. In a project in the area of the Southern Black Forest, SPAM IV data loggers (from the Geophysical Instrument Pool (GIPP) at GFZ Potsdam) were used. Magnetometers and electrodes are oriented north (N)–south (S), east (E)–west (W), and vertically. Horizontal magnetic and electric sensors are installed at a depth of about 20 cm. Vertical magnetic sensors are buried completely. Cables are fixed to the surface and partly buried to reduce motion, for example, by wind. Remote stations are operated quasi-continuously at near (few 10 km) to intermediate (few 100 km) distances during the measurement campaigns. Time series data are processed to determine the impedance tensor by using mutual remote reference processing to reduce local electromagnetic noise.13
Typically, two different processing codes are applied. The WinGLink© code, including a 50 Hz and harmonics notch filter, yields good-quality transfer function data. If necessary, at long periods (T>1 s), robust data processing techniques are later applied.14
MTs in the granitic basement at the European EGS project in Soultz-sous-Forêts (France) imaged, for the first time, a naturally fractured reservoir.11 Three reservoir levels at depths of 2000, 3600, and 5000 m characterize the Soultz EGS project. Although comparably high natural hydraulic yields of 10−3 to 10−1 m3 MPa−1 s−1 and smectite and illite hydrothermal alteration products occur in the upper reservoir, the intermediate and lower reservoirs reveal a natural hydraulic yield in the order of 10−4 m3 MPa−1 s−1 and illite only in fractures.7 Given the low variation in salinity of the geothermal brine with depth, the successful visualization of the upper reservoir by very low electric resistivity (<4 Ω m) can be attributed to the high cation-exchange capacity (CEC) of smectite.
The presence of a comparably high volume of high saline fluid with a low amount of total dissolved solids (TDS=about 100 g L−1) may also contribute to this resistivity anomaly. Lower CEC and smaller fluid volume appear to prevent visualization of the intermediate and lower reservoirs.
Geothermally relevant faults have also been investigated in the volcanic crystalline basement by using MT.10 In the Villarrica volcano area in the Andean Cordillera of southern Chile, more than 20 thermal springs occur, mainly along the regional fault zones, the N–S striking Liquiñe-Ofqui fault systems (LOFS) and subperpendicularly the Villarrica-Quetrupillán-Lanín (VQL) volcanic chain. Fluid chemistry of the springs shows generally low TDS with a maximum of 850 mg L−1 for the fault-distant springs.
A HR broadband MT survey reveals two major geoelectric strike directions parallel to LOFS and VQL in phase tensors and induction arrows. The 2D inversion of the full impedance tensor shows intermediate resistivity zones (ρ>20 Ω m) along both fault systems down to a depth of >10 km, at which the brittle–ductile transition is expected.
To investigate the relatively high electric resistivity in these hydrothermally productive fault zones, clay mineralogy was investigated at Coñaripe, together with a hydrothermal alteration reference of the El Toro high-enthalpy geothermal field. A high fluid temperature at the Coñaripe spring (about 70 °C) and high reservoir temperature of about 130 °C determined from sulfate geothermometry, which is based on the temperature-dependent fractionation of oxygen in H2O and SO4,15 characterize this spring.
Clay mineralogy was determined from 50 mg powder with a grain size of 500 μm by means of simultaneous thermal analysis (STA) between 35 and 1100 °C at a heating rate of 10 K min−1. A Pt/Rh crucible was used under a nitrogen atmosphere with a STA 449 C Jupiter instrument connected to a quadrupole mass spectrometer QMS 403 C (Netzsch). Bulk powder and texture XRD was measured with a Siemens D5000 diffractometer with CuKα radiation for 2θ angles of 5–80° and 2–35°, respectively, in steps of 0.02° and 3 s. Oriented samples were prepared by mixing the sample material with deionized water and pipetting onto a glass slide after ultrasonic treatment. After drying, the textured samples were measured by starting with an untreated texture sample. Measurements were continued by adding ethylene glycol to the sample and first heating it to 375 °C and then to 550 °C.
Results of STA-MS show significant differences between the clays sampled near the El Toro and Coñaripe hot springs. In contrast to the reference, in which a large amount of swelled three-layer clay is indicated by an endothermic peak in the differential scanning calorimetry (DSC) results between 123 and 157 °C, Coñaripe clays reveal no indication of hydrothermal alteration minerals (Figure 3). Endothermic peaks indicate crystal water. XRD texture analyses determined smectite as the major clay mineral fraction in the reference sample. In contrast, at Coñaripe, powder XRD analysis revealed silica and feldspar only.
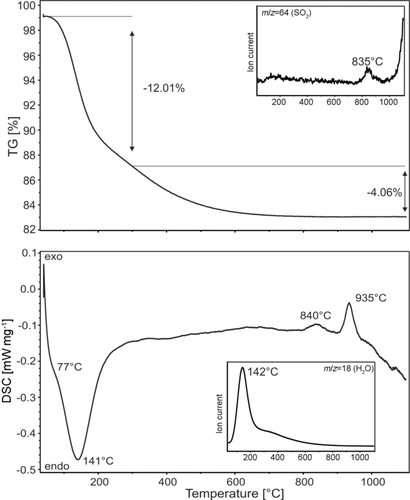
STA-MS analyses of the altered crystalline basement at Conaripe thermal spring (Villarrica area, southern Chile). TG: thermogravimetry.
With respect to the development of exploration approaches for EGS in the central European crystalline basement, further MT studies were performed in the granitic basement in the Southern Black Forest,16 where the basement is outcropping at the surface. This area is also one of the possible sites for GeoLaB17 (see Section 4.2). Differences in 3H and 14C contents for Ca−Na−HCO3-type water in the springs in the Southern Black Forest, compared with Na−SO4−HCO3−Cl-type water in northern Switzerland, led to the interpretation that fluids in the crystalline basement of northern Switzerland were recharged in the Black Forest.18 A series of fault systems striking ESE–WNW to SE–NW is expected to provide related fluid pathways (Figure 4). After a period of inactivity during the Mesozoic Era, the Variscan Vorwald and related faults were reactivated. Recent displacements are seismically expressed, for example, in the Schopfheim earthquake (on May 5, 2009, with ML=4.5).

Geological map of the outcropping granitic basement of the southern Black Forest.
Regarding clay mineralogy in the Southern Black Forest, at Wilhelminenstollen, powder XRD analyses of fracture fillings indicate the presence of mica/illite together with an illite–smectite interstratification in the alteration products. No indication of free smectite is found.
In the Badenweiler-Lenzkirch zone, alteration with 60–90 wt % of illite, chlorite, and kaolinite19 resembles the clay mineral assemblage at the Soultz site. At the Lindau test site, only kaolinite occurs. Interestingly, clay minerals occur preferably in NW–SE striking fractures (Himmelsbach, personal communication).
In the framework of the geothermal power plant project,15 a 12 km long MT profile across the Vorwald fault, including 13 stations was investigated for low-resistivity anomalies. Analyses of ellipticity and dimensionality revealed a rather consistent mean geoelectric strike of N28°E that coincided with the strike of the Variscan faults and veins, including the Vorwald fault. It defines thus the rotation angle of the impedance tensors. Inversion was performed by using the regularization parameter τ=1. Because our inversion concept is based on 2D subsurface structures and transient electric (TE) mode is more sensitive to 3D effects, error levels for the apparent resistivity for TE and (transient magnetic (TM) modes of 100 and 10 %, respectively, and 1.5° for the phase shift of the modes are used.
The 2D inversion results for a low overall RMS of 1.5 are displayed in comparison with major fault zones in Figure 5. Generally, the area reveals a very high electric background resistivity of ρ>10 kΩ m, in which two major anomalies, A and B, with 1 kΩ m<ρ<5 kΩ m are embedded. These anomalies are robust features; an overestimation of their extension to depth, however, is possible.
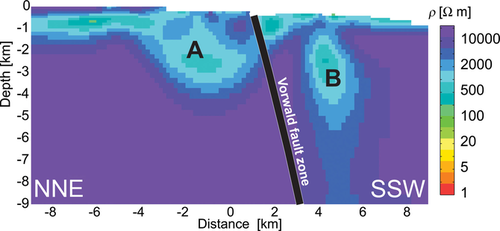
The 2D inversion of the MT profile across the Vorwald fault (Southern Black Forest).
In conclusion, it is observed that smectite fosters the occurrence of low-resistivity anomalies in conventional and EGS reservoirs. However, intermediate resistivities also characterize geothermally relevant structures. This is most likely to be due to porosity changes, as predicted by Archie's Law.
3.1.2 Multiscale fluid flow in fractures
Apart from appropriate temperatures, permeability represents one of the most important subsurface parameters of geothermal reservoirs for an economic energy generation. In particular, fractures can play a crucial role by enhancing existing reservoir permeability (e.g., in porous media) or by creating new pathways in nearly impermeable rocks (e.g., EGS). However, under reservoir conditions, the presence of flow paths or flow channels (Figure 6 III) is not only a geometrical issue, but also depends on coupled boundary conditions, such as temperature, mechanics, and chemical processes that affect the actual permeability of fractures and associated discrete fracture networks (DFNs).
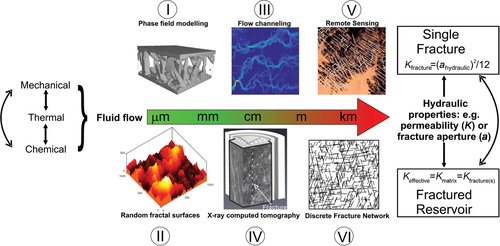
Multiscale fracture investigations from the micro- to kilometer scale. The color gradient of the scale bar indicates increasing uncertainty of hydraulic fracture properties with increasing fracture scale. Typically, hydraulic properties underlie coupled mechanical, chemical, temperature-dependent processes. Examples represent I) a phase field model (PFM) of fracture sealing;20 II) a synthetic model21 of a typical self-affine, rough fracture surface (fractal dimension=2.2[22]); III) a local cubic law visualization of typical flow channels based on aperture distributions;23 IV) a medical X-ray computed tomography (CT) scan of a fractured core sample;24 V) lineament interpretations based on remote sensing;25 and VI) a random stochastic DFN model.26 Fracture or DFN studies provide improved permeability predictions of single fractures (analytical,27 numerical24, 28) and fractured geothermal reservoirs (analytical,29 numerical24, 25, 30).
Typically, fracture permeability can be described by the well-known cubic law to simplify a fracture as a pair of parallel plates.27 However, due to their roughness, natural fractures are better represented by self-affine surfaces (Figure 6 II). Because, in most cases, fracture surfaces are mismatched to each other, the resulting mechanical and hydraulic apertures facilitate fluid flow and also fluid-induced reactive transport processes, which can affect hydraulic and mechanical fracture properties.31
In particular, fracture sealing plays an important role when considering time-dependent reservoir scaling and activation or utilization of (partly) sealed structures. Thermodynamically consistent PFMs provide a useful numerical tool that is able to reproduce polycrystalline sealing scenarios, such as tectonically unaffected crystal growth32 or syntectonic crack–seal processes.31, 33, 34 Wendler et al. showed that PFMs were able to reproduce hydrothermal quartz growth experiments (Figure 6 I).20 Hence, such models provide new insights into various sealing structures and corresponding flow paths. To fate, PFMs have only been used to simulate pure sealing processes on micro- to millimeter scales. However, under reservoir conditions, there should be an interaction of precipitation and dissolution processes, as shown in core-scale reactive percolation experiments under high pressure–temperature conditions with CO2-rich brines.28 Because reactive transport in fractures depends on available response surfaces, mechanically induced fracture geometries are crucial. However, hydraulic properties typically show a pronounced stress dependency. Applying stresses induces kinematical processes within the fracture, which typically close fractures and result in a permeability reduction, which is strongly linked to mechanical (e.g., stiffness) and geometrical properties of the fracture surfaces, such as roughness, matedness, or the distribution and shape of contact areas. Indeed, several studies have implemented such properties into the analytical cubic law since the pioneering work of Louis;27 however, these approaches cannot cover all fracture flow features and processes. Hence, numerical models based on more realistic fracture geometries provide an effective method to gain novel insights into fracture flow. Nevertheless, stress-dependent fracture geometries and fluid flow still represent a challenge. Typically, there are two approaches: 1) matching (scanned or synthetic) fracture surfaces by appropriate mechanical models, or 2) applying elaborate in situ fracture data (e.g., by X-ray CT). Accordingly, Schoenball et al.35 used synthetic fractal surfaces to show that shearing implicated a significant flow anisotropy within the fracture. Huber et al.36 used μCT scanning of an unaffected natural fracture to prove the significance of fracture heterogeneity on flow behavior. On the other hand, Kling et al.24 introduced a useful method to transfer in situ medical CT data of fracture flow under loading–unloading condition into flow simulations (Figure 6 IV).
Although the investigations mentioned above are not on the reservoir scale, at which fractures can form DFNs, DFN studies can reproduce fundamental fracture input parameters, such as fracture length and density, which are crucial for scaling up to reservoir models. One common approach to simulate fluid flow in multiple-fractured reservoirs is provided by stochastic DFN models (Figure 6 VI) based on statistical fracture network data.26, 30, 37 In this context, Zeeb et al.38 introduced the new toolbox called FraNEP to statistically analyze natural fracture data and to enable transformation into more consistent artificial DFNs by using customized fracture network generators.26 Whether these DFNs are representative of a reservoir or not depends strongly on the availability of outcrops and subsurface data; this is often provided, for example, by field measurements, terrestrial laser scanning,39 and remote sensing40 (Figure 6 V), as well as a applied sampling method, such as scanline or window sampling.38
In conclusion, the evaluation of fluid flow in fractured reservoirs is a matter of scales, ranging from single fracture scales (μm to cm scale, mechanically and chemically induced geometries) to the field scale (cm to km scale, transferability of DFN geometries), the interactions of which have to be better understood to provide more reliable geothermal reservoir models.
3.1.3 Particle deposition in granitic fractures
Little attention has been paid to the presence of colloids within the permeable fractures and their impact on porosity and permeability in geothermal reservoirs.41 In addition to negative economic issues, such as pore clogging (formation damage), during extraction of fluids from the subsurface or reinjection into the reservoir,42 in fractured reservoirs, the deposition of clay colloids enhances reactivation potential, and thus, permeability.11, 43
Investigations into the effects of mineralogy and surface roughness on controlling particle deposition/attachment can be found in the literature, including work from KIT.44, 45 We use the combination of fluorescence microscopy, laser scanning microscopy (LSM), and SEM as a methodological approach to obtain information on the colloid deposition/attachment behavior and spatial distribution as a function of, for example, mineralogy, surface roughness, and fracture orientation (horizontal/vertical). To prove the feasibility of this technique, postmortem analyses of the fracture surface are performed on continuous-flow experiments with horizontal fracture orientation on a cut Grimsel granodiorite core with a parallel-plate aperture of 0.75 mm by using synthetic monodisperse 1000 nm carboxylated fluorescence colloids. In these experiments, the flow velocity (1.66×10⁻⁵ and 5.47×10⁻⁵ m s−1) and colloid concentration (1 and 10 ppm) was varied. Further information on the experimental conditions, setup, and sample location can be found in Ref. 46.
After transport experiments, the flow cell is opened and the granodiorite disc is removed for postmortem analysis. After installation and adjustment of a pinhole aperture, the colloids are observed directly by using a fluorescence microscope (Axioplan 2 Imaging, fluorescence microscope, Zeiss, 10× magnification, image size 1401×1048 μm2). Focus stacking, also known as z stacking, is used in this case to obtain images with a greater depth of field (DOF) to compensate for surface roughness. To compare the results with LSM and SEM measurements, the same areas on the surface are investigated. By using ImageJ software,47 the z-stacking files are displayed on one plane. With the Particle and Pore tool implemented in the SPIP™ software package (Image Metrology), the colloids are quantified.
The colloid deposition (kinetics) are determined by calculating the dimensionless Sherwood number (Sh); for details, see Ref. 44.
Post mortem analysis was performed on 12 regions of interest (ROIs), covering 1.5 % surface area (17.63 mm2) of the total Grimsel granodiorite disc surface (1134.12 mm2). Under the prevailing geochemical conditions (pH 5, 1 mm NaCl), colloid retention values calculated on the basis of measured experimental breakthrough curves (BTCs) show an overall low colloid retention (maximum 5 %) and tend to increase with decreasing flow velocity (=increasing residence time). Retention on the granodiorite surface obtained by fluorescence microscopy is an extrapolated value based on the sum of the counted colloids in the abovementioned 12 ROIs. In the range of the error, the extrapolated percentage is, in all cases, comparable to or higher than the percentage obtained by BTC analysis. Colloid concentration variation revealed a limited site capacity for colloid retention under the experimental conditions. However, the use of fluorescence microscopy single-colloid analysis revealed no influence of flow velocity under the uncertainties of 2–3 % given.
 (1)
(1)in which L is the characteristic length in m, D is mass diffusivity in m2 s−1, and K is the convective mass transfer film coefficient in m s−1.
 (2)
(2)By comparing the calculated Sh values under these unfavorable attachment conditions as a function of surface roughness (Figure 7), the highest values of colloid attachment could be observed for low colloid concentration and high flow velocity (1 ppm, 5.47×10⁻⁵ m s−1) with a tendency of Sh to increase with roughness most probably overcoming electrostatic repulsion. In contrast, lower Sh numbers are visible for experiments, including 10 ppm colloid concentration under the same flow velocity (7 mL h−1 or 5.47×10⁻⁵ m s−1), and lowest Sh values for low (1 ppm) colloid concentration at low flow velocity (2 mL h−1, 1.66×10⁻⁵ m s−1).
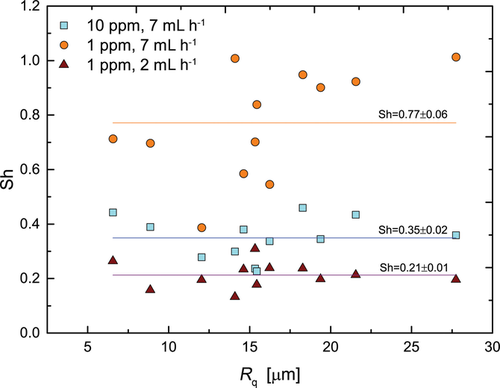
Sherwood number (Sh) as a function of surface roughness of continuous flow experiments with varying colloid concentration and flow velocity for 1000 nm colloids (lines with average Sh to guide the eye).
When comparing these findings to AFM measurements,46 it is reasonable to assume that there is no influence of surface roughness on colloid retention on 1000 nm colloids. The LS/LB ratio, which describes the dominating influence of either gravity (LS/LB>1) or Brownian diffusion (LS/LB<1) by comparing the ratio of the characteristic sedimentation length and diffusion length, is 1.19 for 1000 nm colloids at 1.66–5 m s−1. Based on this value, colloid deposition at 1.66×10⁻⁵ m s−1 is neither fully dominated by gravity nor by diffusion. Both forces act equally on the colloids. Under these conditions, a significant effect of colloid deposition by gravity, relative to the higher flow velocity (5.47×10⁻⁵ m s−1), is not expected.
In a further study, the specific role of fracture orientation and gravity on colloid retention is studied by simulating stagnant phases by stop–flow conditions (similar to geothermal power plant downtime periods), as partly documented in Stoll et al.46 Both experiments and hydrodynamic simulations by using COMSOL Multiphysics (Version 5.0) could univocally show that gravity plays a major role for colloids ≥1 μm.
To investigate colloid retention on granodiorite minerals, the self-fluorescent signal of the minerals obtained by changing the filter cubes of the microscope was compared with mineral deposition information. This additional procedure was performed exclusively for an experiment that involved a 1 ppm colloid suspension at 1.66×10⁻⁵ m s−1. Information from SEM/energy-dispersive X-ray spectroscopy (EDX) measurements of each ROI helps to identify the mineral phases. The combined image is shown in Figure 8 with marked mineral phases. The colloids are distributed evenly over the whole investigated ROI. No mineral-dependent increase or decrease of colloid deposition is detectable. This finding supports surface potential measurements and force volume measurements obtained by means of AFM, which show overall negative surface potentials and unfavorable repulsive conditions. Comparable observations are made for the other ROIs.

Colloid distribution (white spots) on granodiorite mineral phases of plagioclase (Plag), quartz (Qz), and micas muscovite (mu) and biotite (bi) in a continuous-flow experiment with a 1 ppm colloid concentration and 1.66×10⁻⁵ m s−1 flow velocity (ROI 90_2).
In summary, the results presented herein demonstrate that the multimethod approach of using macroscopic flow experiments and microscopic postmortem analysis provides an in-depth process understanding on the colloid–granite surface interactions under well-constrained laboratory conditions. By using this method, spatially resolved colloid deposition was quantified as a function of mineralogy and surface roughness. Current research is heading towards more realistic boundary conditions concerning hydro-geochemical parameters (higher ionic strength, higher flow velocity) and especially the use of natural clay colloids separated from the Soultz system (Figure 9).
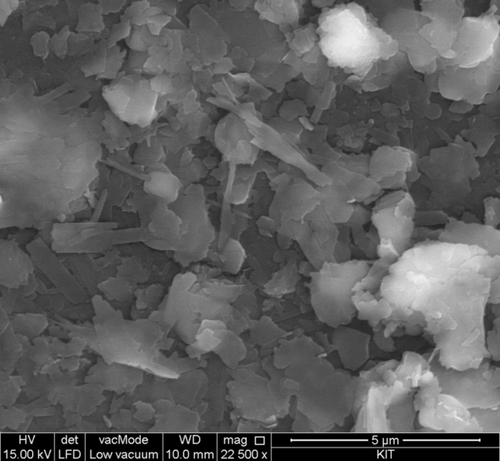
Natural illite-dominated colloids obtained from the fracture surface of drill core K117 at exploration well EPS-1 from the geothermal test site Soultz-sous-Forêts.
3.1.4 Mineral nucleation process for secondary-phase formation
The neoformation of secondary mineral phases can lead to colloid/particle formation or, through accumulation, to scaling, which changes the porosity of water-conducting features and potentially results in clogging phenomena. Furthermore, the sorption or incorporation of naturally occurring radioactive material (NORM) radionuclides into secondary mineral phases can strongly influence their migration within the thermal water circuit. The prediction of secondary-phase mineral formation requires knowledge of the kinetics of reactions involved in fluid–rock interactions.48 To predict such reactions by reactive transport codes, a prerequisite is a consistent thermodynamic database (TDB), including reaction kinetics (mineral dissolution/precipitation data).49 The kinetic data implemented in reactive transport codes to solve precipitation reactions frequently relies on mineral dissolution data that assume the same rate constant.50 Therefore, a potential reason for discrepancies observed between model and experiment might be an inappropriate TBD. KIT follows the objective to determine kinetic parameters for the nucleation and growth of mineral phases [herein, for example, celestite (SrSO4)] as a function of specific reaction variables (e.g., temperature, ionic strength, supersaturation ratio, addition of dissolved silicate) and the interaction of trace elements (radionuclides, heavy metals).
The nucleation of celestite is examined by means of laser-induced breakdown detection (LIBD),51 which allows a determination of the induction times (tind). The LIBD method has been applied here for the first time to study the kinetics of nucleation (Figure 10). The latter is defined as the time elapsed between the achievement of supersaturation and the detection of the first nuclei in solution. This is combined by crystal growth experiments that provide rates by using mixed-flow reactors (MFRs).52 The determined induction times allowed the calculation of rate constants, activation energies, and interfacial tensions. LIBD could show that the occurrence of quantitative nucleation is always preceded by the formation of early-stage nuclei (ESN). HR-TEM analysis confirmed that the ESN were already well crystalline in the case of celestite, which had a gyration radius of (29±10) nm, comparable to that of the radius estimated from LIBD data. The addition of dissolved silica to solutions supersaturated with respect to celestite caused a prolonged induction time.
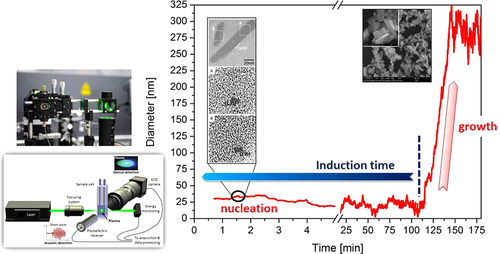
Synopsis of the LIBD approach, showing the general optical setup of the system (left) and one example of evolution of the nanoparticle size with time. Nucleation and the growth state are shown; these determines the induction time.
In conclusion, by using the LIBD method, kinetic data on the onset of nucleation and growth can be determined; this provides a tool to obtain kinetic data to feed into TDBs.53 Ongoing studies focus on the effect of elevated temperatures, other mineral systems, and the influence of inhibitors.
3.1.5 Induced seismicity
The development of deep geothermal fields, in particular, EGSs, is often associated with induced seismicity. Induced seismicity is a unique phenomenon that helps to image geothermal reservoir properties. Without such information, a description of the underground structure away from the production and injection wells is very difficult. However, this seismicity can be felt by the population and many efforts are made to better understand the THMC processes at its origin and to mitigate it.54 Hence, from both points of view, induced seismicity has to be considered for the sustainable development of deep geothermal fields.
In this domain, research efforts at KIT are following three main directions: 1) the recording of induced seismicity, 2) the reliable processing of seismological data, and 3) the interpretation of the results. These working directions are often linked and can be found in the European H2020 DEEPEGS project, which started at the end of 2015.55 The general goal of the DEEPEGS project is to demonstrate the feasibility of EGS for delivering energy from renewable resources across Europe. Three different resource systems in three different locations and geological formations in Europe have been selected as demonstration sites.
Access to databases of seismicity induced in geothermal fields is of prime importance to understand this phenomenon, especially given that such databases are not numerous worldwide. In 2013 and 2014, KIT was involved in the seismic monitoring of the deep geothermal field of Rittershoffen (France) located 6 km from Soultz-sous-Forêts.56
The power plant inaugurated in June 2016 delivers 24 MWth thermal energy to a biorefinery located 15 km away. In cooperation with the field operator ECOGI, the Électricité de Strasbourg-Géothermie Company, the LABEX G-EAU-THERMIE-PROFONDE of the University of Strasbourg, and support from the GIPP Potsdam, KIT deployed a temporary seismic network in addition to the permanent one to improve the monitoring of seismicity induced during the development phases of the geothermal reservoir (Figure 11). KIT also participated in the real-time data processing. Several hundreds of microearthquakes were recorded; none of them were felt by the local population. Doctoral work is currently ongoing to process and interpret the recorded events.
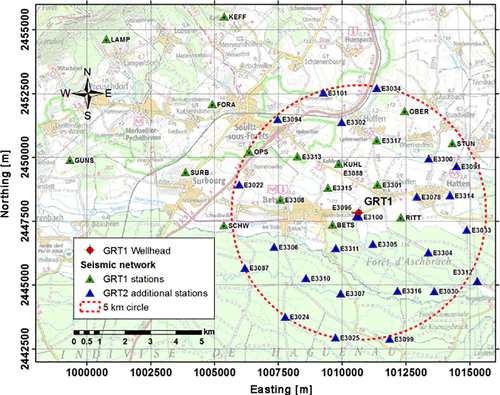
Map of the seismic network deployed at Rittershoffen in 2013 and 2014. The green triangles show the locations of the seismic stations that monitored the early operations in the GRT-1 well; for the monitoring of the GRT-2 well drilling and further operations, the blue triangle stations were added. The E3 stations belong to the KIT temporary network.
For meaningful interpretation of the induced seismicity, especially in terms of reservoir geometry, reliable catalogues listing the location, origin time, magnitude, and focal mechanisms of the earthquakes should be available. One of the means to achieve this is to provide each parameter with realistic errors. This requires errors introduced at different steps of seismological data processing to be better accounted for and/or modeled.
For example, for the Rittershoffen field, uncertainties of absolute earthquake locations, which are associated with the quality of the recorded data, vary spatially and are larger than ±150 m at the reservoir depth (≈2.5 km). Additionally, if the location is recorded without taking into account the normal fault that constitutes a major structure within the geothermal reservoir, the earthquake hypocenters can be shifted by 350 m57 (Figure 12). Such studies are of importance and may have economic consequences.
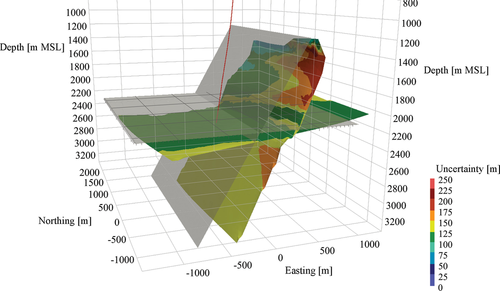
Rittershoffen case study: modeling location errors of earthquake hypocenters. The earthquakes initially located on the gray planes within a 3D velocity model are relocated on the colored surfaces if a 1D velocity model is applied. The color scale represents the location uncertainty.
Valuable information can also be gained by better constraining the earthquake hypocenters. This basic attribute is usually computed by using arrival times of seismic waves observed on monitoring networks. Time information is related to the distance between the seismometer and the earthquake. However, the widespread use of three-component sensors also gives access to additional information: the wave arrival direction. With support from the Landesforschungszentrum Geothermie and the Ministry of the Environment, Climate Protection, and the Energy Sector of Baden-Württemberg, a new Bayesian formulation has been developed that defines a probability density function of the earthquake hypocenter as a function of seismic body wave polarization.58 This probabilistic formulation, combined with usual ones, allows the accuracy of earthquake locations to be improved.
Earthquakes are associated with rock failures and highlight fracture or fault zones geomechanically perturbed in the subsurface. In deep geothermal fields, in which forced fluid injection can take place, such seismogenic zones may be representative of preferential fluid circulation pathways. Hence, induced seismicity, once correctly located, can be used to highlight DFNs in the geothermal reservoir. In recent work, the well-known three-point method is improved, which looks for preferred planar distribution of earthquakes in a seismic cloud of earthquakes by introducing weighting factors that depend on interevent distance and event magnitude. additionally, a novel statistical analysis of seismic clouds was developed to provide pseudospatial probability of an event-driven fracture network. This method also applies distance and magnitude weighting, but additionally allows the use of fault plane solution of the earthquakes. After testing and validating both approaches on synthetic data, they were applied to the seismicity induced in 2000 during the hydraulic stimulation of well GPK2 at the Soultz-sous-Forêts geothermal site. The results obtained at Soultz are comparable to those of previous works59 (Figure 13).
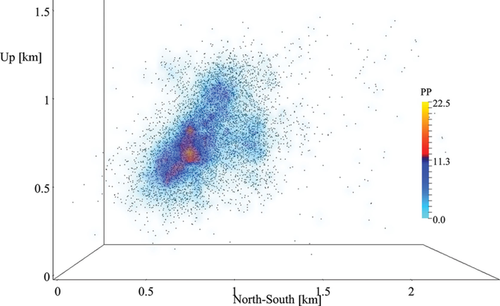
Soultz case study: seismicity induced in 2000 during the GPK2 stimulation. Pseudoprobability of earthquake connection as an indicator of the fracture network. PP=pore pressure, Up=vertical extension from defined origin.
3.1.6 Borehole Failure
Not only does a seismic survey of the reservoir allow monitoring of the principle mechanical response, but also important rheological parameters and the stress state before and/or during fluid injection can conventionally be inferred from observations made in boreholes. Such data are inevitable for forecasting the behavior of the subsurface at the scale of the entire reservoir. Thus, inducing fractures potentially leading to breakouts of the host rock wall surrounding a borehole is, at the same time, an undesired and welcome side effect while penetrating underground through drilling or fluid injection. Catastrophic failure can cause substantial additional costs, which may endanger the success of a geothermal project. However, creating fluid pathways and enhancing permeability through hydrofracturing the reservoir rock are considered to be prerequisites for the exploitation of deep geothermal systems.60 Furthermore, knowledge of the in situ stress field, its highly debated rotations, and mechanical properties of the reservoir obtained from borehole breakout patterns are essential for reservoir engineering in terms of the stability of the construction and the predictability of seismic hazards that result from production across the entire reservoir.61, 62
3.1.6.1 Insights from the Soultz-sous-Fôrets case study
On basis of field observations obtained from the Soultz-sous-Forêts geothermal field, a geomechanical model to simulate the dynamic response of the reservoir to drilling and fluid injection/production has been implemented. The Soultz project is arguably the most comprehensive research project in the field of EGS, which was developed more than 25 years ago, and thus, is well documented.63 Therefore, this case study is predestined for the development and testing of techniques applicable to characterize the mechanical properties of any crystalline reservoir.
Studies of the wellbore stability during drilling are usually based on extensive observations from geophysical log data at the GPK4 well in the Soultz reservoir. Detailed analyses of failure patterns along this well have indicated a stress heterogeneity in the deep reservoir at a depth of around 5000 m (Figure 14).64 At such depths, slight variations in stress magnitude and orientation play a significant role. In addition, the deeply seated reservoir is highly fractured. Fractures are repeatedly accompanied by mineral alteration, acting as weak zones, which potentially promote failure along such heterogeneities. Combined with sonic logs65 and alteration logs,66 the impact of fractures and alteration on mechanical rock properties has been quantitatively estimated for the upper part of the crystalline section. For instance, the elastic moduli of fractured granites were 60 % lower than that for the intact granite.67 This result is in agreement with in situ laboratory measurements of the Soultz granite.68, 69 Furthermore, this finding suggests that integrated analyses of borehole log data, as shown by our study, could be used as an alternative to in situ laboratory measurements, and help to explain localized wellbore failure inside a highly stressed rock. Because the availability of core data is limited and in situ laboratory measurements are costly, this concept could play a significant role in the geomechanical modeling of deep EGS reservoirs.
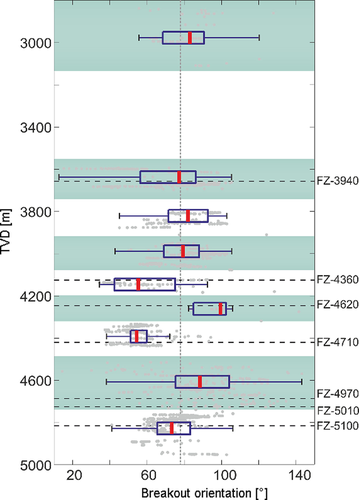
Profile of breakout orientations in the GPK4 well. Box plots are used to summarize the distribution of depth intervals. TVD is the true vertical depth below the wellhead. The lower and upper fences, the first and third quartiles (rectangles), as well as the median value, are plotted. As the median values of the breakout orientation scatter and deviate from the principle (far-field) stress field along the borehole, we are able to detect local stress rotations due to material heterogeneities. The depths of the intersected major fractures were taken from Ref. 70 and are indicated by dashed lines.
Such geomechanical modeling may provide a solid basis for understanding the dynamic behavior of the reservoir during hydraulic stimulation. In our study, injection is targeted inside the deep reservoir that consists of two different granites with different petrographic characteristics. The impact of rock characteristics on seismicity has long been observed in the engineering of mines and tunnels,71 but has not been analyzed for geothermal problems, to date. Herein, we are able to link the sharp mechanical contrast between different granites in the reservoir to the occurrence of microseismic events, that is, 85 % of events are located within highly fractured two-mica granite (Figure 15). Microseismicity in the two-mica granite occurred much earlier, when the increase of borehole pressure was still around 3 MPa, whereas fractures in the less-fractured porphyritic granite were reactivated 15 h later, when the borehole pressure stabilized at around 15 MPa (Figure 15). Furthermore, the pattern of microseismicity in each zone could also be matched with different injection schemes used in the field; this suggests that an adapted injection strategy can be developed based on the reservoir model proposed in this study. Because a majority of EGS projects target crystalline rocks, the understanding of lithological controls on seismicity achieved in this study is crucial for future developments. For further details of the geomechanical results, please see Refs. 62, 66, 67, 72, 73.

Fracture reactivation in the vicinity of the borehole. Microseismic events within 100 m radius from the borehole are selected to represent the reactivation of fractures in the vicinity of the borehole. Wellhead (thick line) and hole bottom (dashed line) pressures are also plotted. Fractures are reactivated at different borehole pressures and times, that is, the reactivation of deep fractures occurs before shallower ones. (M=magnitude).
3.1.6.2 Failure mechanisms and material behavior
The failure mechanisms and associated structures of borehole breakouts have long been regarded as a purely brittle time-independent response, for example, microfracturing of a Mohr–Coulomb material. For such solid mechanical materials, material parameters (internal friction angle, failure angle) can be inferred from deformation experiments under controlled laboratory conditions, and they have conventionally been extrapolated to reservoir rocks at shallow crustal levels under low-temperature conditions. However, recent observations made in deep boreholes (see previous sections) indicate complex coupled and time-dependent damage or mechanisms (Figure 14),72 as-yet undetected transient microphysical processes,74 and the severe influence of local material or structural instabilities.64 For these microprocesses, naturally encountered at elevated temperatures at which EGSs are located (depth>5 km), lower deviatoric stresses and/or longer geological timescales are required to induce localization instabilities.75 At this point, even unconventional brittle material assumptions fail to correctly predict the rock strength because the material reveals a severe temperature and rate sensitivity. This observation, next to often overlooked scaling effects, leads to significant gaps in knowledge of processes operating in deep geothermal systems and drilling technologies. Among other issues, these obstacles challenge the standard assumption that well costs linearly increase with depth in EGSs.60 Therefore, from both an academic and economic perspective, it becomes necessary to approach borehole failure with alternative concepts.
3.1.6.3 Recent advances in THMC modeling
At this point, continuum mechanics formulations, including nonequilibrium thermodynamics, have been applied to geothermal issues.75 In such a framework, the dynamic evolution of damage, permeability, and coupling effects between THMC processes are incorporated into the constitutive relationship of a creeping material.76 Although there are powerful numerical tools that are able to link the mechanics to the hydraulic effects at the reservoir scale,77 they do not implement the multiphysics and multiscale processes that operate at the scale of single grains at the borehole wall up to the entire reservoir. For such highly nonlinear applications that implicitly consider the effects of dissipative strain softening on chemical reactions and reactive transport, a parallel high-performance computing infrastructure is needed. To this end, recently developed tightly coupled THMC codes,78, 79 based on the multiphysics object-oriented simulation environment (MOOSE) finite element framework,80 have been adapted for geothermal applications. For example, the richness of borehole failure modes, such as the formation of compaction bands, shear bands, and shear fractures,74 can be captured by means of self-consistent THMC simulations that stem from ductile instabilities if both volumetric and deviatoric contributions to rate-dependent deformation are incorporated.78
3.1.6.4 Future perspectives
In light of engineering purposes, further steps have to be undertaken to retrieve fundamental material parameters directly out of borehole observations, as attempted in Figure 16, following first promising simulations that treat deformation structures as fundamental material instabilities.81 Next, great attention has to be paid here to realistically scale up microphysical damage processes to predict the behavior of an EGS. It is suggested to embark on the multiapplication features the MOOSE framework offers80 and to deal with critical sets of material parameters and boundary conditions. The numerical techniques presented herein do not rely on oversimplified material characteristics, obtained by costly laboratory experiments, and they are able to account for the multiscale and multiphysics of an entire EGS embedded in a complex tectonic setting. Such techniques can be readily adapted for related scientific disciplines, for example, for the disposal of radioactive waste.
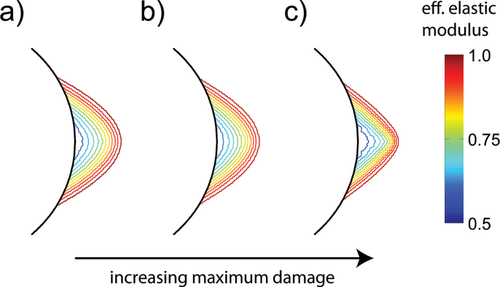
Shape of borehole breakouts (colored contour lines) computed for differences in the effective elastic modulus, Eeff (see legend), ranging from convex (a) to linear (b) and concave (c) patterns with increasing maximum damage parameters. A comparison between simulated and natural failure patterns allows mechanical rock properties to be derived, that is, the elastic properties of the reservoir rock, directly from boreholes. The black curves represent a section of the borehole wall. Figure taken and modified from Ref. 72.
3.1.7 Effects of hydrothermal alteration on mechanical reservoir properties
In the granitic reservoir of the geothermal site in Soultz-sous-Forêts, many fractures are affected by hydrothermal alteration involving the precipitation of clay minerals on the fracture surfaces. The mechanical weakness of clay-filled fractures has been demonstrated in several studies.82 Laboratory experiments suggest that even small amounts of clay on fracture surfaces determine the mechanical properties of the fault zone when an external stress is applied.83 It is assumed that the critical pressure, which is the pressure required to rupture, depends significantly on the clay inside the fault. Hence, the characteristics of induced seismicity should reflect the mechanical properties of the fractures. This study aimed to create probabilistic models of the critical pressure of fractures, which is the pressure required to induce shear movements on this fracture, in and around GPK1 by taking into consideration the clay content of the fractures. These models are compared with induced seismicity recorded during the 1993 stimulation of GPK1.
 (3)
(3)in which Pc is the critical pressure, σ is the effective normal stress acting on the fracture, τ is the effective shear stress acting on the fracture, c is its cohesion, and ϕ the friction angle. The value of Pc is controlled by the orientation of the fracture in the prevailing stress field, the mechanical properties of the rock represented by its internal friction and cohesion, and by the pore pressure. The orientation of fractures in Soultz is known from borehole logging and the clay content can be derived from synthetic clay content logs (SCCLs), as developed by Meller et al.,66 which are semiquantitative models of the clay content of fractures along the Soultz boreholes. Friction and cohesion parameters can be chosen according to the clay content of a fracture. The SCCLs represent the density of clay-filled fractures in five groups. SCCL group 1 represents low-density intervals, whereas SCCL group 5 applies to the highest density. The synthetic log for well GPK1 is presented in Figure 17.
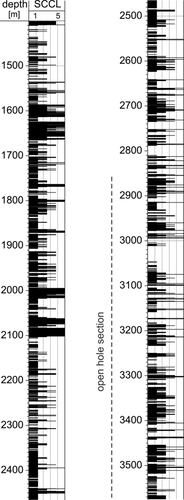
SCCL log for well GPK1. SCCL group 1 represents the fractures without clay filling, whereas SCCL group 5 contains fractures with the highest amount of clay. The open-hole section of the well between 2847 and 3590 m is marked by the dashed line.
Fractures identified on UBI logs of the open-hole section of well GPK1 were used to create a probability distribution of fracture orientations. The orientation and magnitude of the principal stress components, which are required to calculate the critical pressure for a fracture, are taken from reports by Valley68 and Cornet et al.,84 who provided the most recent solutions for the stress field magnitude and orientation at Soultz.
The overpressure in a reservoir corresponds to the wellhead pressure corrected for a frictional term related to friction of the stimulation fluid along the borehole. If the overpressure in the reservoir equals the critical pressure of fractures, shear is induced on each fracture with a Pc smaller than that of the applied overpressure. If each shearing fracture induces exactly one seismic event, the calculated distribution of Pc can be directly transferred to a seismic event curve versus stimulation pressure.
Well GPK1 is 3580 m deep with an open-hole section spanning the lowermost 730 m of the borehole. In September 1993, hydraulic stimulation of the open-hole section was performed in eight steps to approach a maximum injection rate of 37.8 L s−1. During and shortly after the stimulation operations downhole, which continued 15 days from September 2, the downhole seismic network recorded about 12 000–13 000 seismic events. Shut-in was on September 17, but the record of pressure and induced seismicity continued for another 13 days until the wellhead pressure reached zero.
Comparison between recorded seismicity and the probabilistic curves of Pc may deliver an insight into the frictional properties of the reservoir, yet several assumptions have to be made for such a comparison. One of the strongest is that time variation of the pressure is not taken into account here. Indeed, to do so, a correct model of pressure propagation would be necessary, which is not a simple task, as identified by Cornet.85
The stimulation phase for wellhead pressures between 0 and 9.3 MPa is selected for this analysis. Figure 18 a shows the evolution of seismicity during stimulation between 0 and 9.3 MPa. It is compared with five probabilistic curves obtained by using different friction and cohesion parameters (Figure 18 b–f).

Semilogarithmic cumulative curves of the events during the September 1993 stimulation of GPK1 (a) and fractures versus Pc values calculated with the probabilistic fracture model (b–f) between 0 and 9 MPa. In b), the friction coefficient decreases with increasing clay content. In e), cohesion decreases with increasing clay content and in f) cohesion and friction coefficients decrease with increasing clay content.
The cumulative curve of seismic events during the September 1993 stimulation reveals an onset of seismicity at a downhole pressure of around 6 MPa. Between 6 and 8.3 MPa, the number of events approximately exponentially increases, resulting in a sublinear curve in the semi-logarithmic plot. The five steps in the curve are attributed to large structures inside the reservoir, which affect the propagation of fluid and seismicity. These structures could be either large fracture zones focusing fluid flow and microseismicity, as postulated by Evans,43 or very clay-rich zones, which hamper spreading of the seismic cloud.62
In Figure 18 b, constant friction coefficients and cohesion are used for the calculation of Pc. The evolution of seismicity illustrated by Figure 18 a and b is very different. Whereas the number of seismic events exponentially increase in Figure 18 a, the uniform friction and cohesion curve of Figure 18 b shows a rapid increase in the number of sheared fractures with increasing pressure. In this curve, 40 % of all fractures have a critical pressure between 6.5 and 7.5 MPa; this implies that 40 % of all fractures would shear within a pressure increase of 1 MPa at the beginning of the stimulation.
In Figure 18 c, the friction coefficient decreases linearly between 0.98 for SCCL group 1 and 0.58 for SCCL group 5. With these parameters, 1 % of the fractures would shear within a pressure increase from 3.5 to 4 MPa, followed by an exponential increase in the number of shear events. The gradient of the linear section in the semilogarithmic plot is smaller than that of the real seismic event curve of Figure 18 a. A steeper gradient is obtained when the range of friction coefficients between SCCL1 and SCCL5 is smaller. In Figure 18 d, the friction coefficient was linearly interpolated between 0.98 for SCCL group 1 and 0.68 for SCCL group 5. A similar result is obtained when the friction coefficient is kept constant, but the cohesion decreases with increasing clay content (Figure 18 e). The gradient of the linear section in this curve depends on the range between maximum and minimum cohesion. If both cohesion and friction coefficient decrease with increasing clay content, the gradient of the linear section is even smaller.
From these curves, it is clear that the evolution of seismicity cannot be explained by a uniform friction and cohesion throughout the reservoir. With uniform cohesion and friction, above a certain pressure level, all seismic events would happen within a small pressure range in the order of 1 MPa; this is not observed during the September 1993 stimulation. The exponential increase in the number of seismic events can only be reconstructed by discriminating fractures with different cohesion and friction. This highlights the importance of weak zones for the evolution of seismicity, especially at low stimulation pressures.
A common feature of the probabilistic curves created with distinct friction and cohesion parameters is the step at the onset of the curve, at which the number of fractures quickly increases to about 1 % within a small pressure increase of 0.3–0.5 MPa, which is not observed in the real seismic event curve. When comparing the probabilistic curves to the evolution of seismicity during GPK1 stimulation, it is assumed that all fractures inside the reservoir shear and produce a seismic event. This is not necessarily the case. Fractures with high clay contents, for example, might shear without producing microseismicity. The existence of such movements has been constrained for GPK1 stimulation by Cornet et al.86 on the basis of borehole image logs run before and after stimulation.
Despite modeling uncertainties and simplifications, the results show that there have to be several fractures with a friction coefficient below 0.98 to explain the evolution of seismic events. Even a low number of such weak fractures significantly affects the observed pattern. Considering that only 8 % of all fractures are SCCL groups 4 to 5, the effect of this small proportion of clay-rich fractures has a huge effect, especially for low overpressures. The results have shown that most of the fractures with low critical pressure are fractures with high amounts of clay inside. Without these weak fractures, the minimum Pc would be about 3–5 MPa higher and the evolution of induced seismicity would most likely be different from what was observed during the 1993 stimulation of GPK1. The onset of induced seismicity at low overpressures and the slow increase in the seismic rate until 8.5 MPa clearly indicate that weak fractures dominate the evolution of induced seismicity in the initial stage of hydraulic stimulation.
The study shows that 1) clay-filled fractures are most likely a weak link inside the reservoir, exhibiting much lower frictional and/or cohesive parameters than unaltered rock, and 2) the presence of such clay-rich fractures significantly affects the pressure-dependent evolution of induced seismicity. This indicates that the role of clay and lowering of the mechanical friction cannot be neglected in models of induced seismicity. Specifying the frictional properties of fractures according to their clay content is a new approach to explain the characteristics of induced seismicity. In future, this approach could be integrated into more complex structural and hydraulic models to develop stimulation strategies for geothermal wells. In particular, for soft stimulation, in which the goal is to mitigate large seismic events, the Pc distribution in time and space is a necessary input to adapt the stimulation pressure.
3.1.8 Well integrity
Deep geothermal boreholes are drilled into the ground to utilize its heat. To reach the target formation, drinking-water horizon(s) need to be penetrated. In addition, aquifers with different pore pressures may become connected through the drilling operation, leading to differential subsidence or elevation; this lead to undesired side effects with enormous damage in the past.
To avoid drinking-water contamination and the interconnection of different aquifers, the drilled holes need to be properly completed. Usually, a series of cemented steel casings are used 1) to ensure long-term stability of the well, 2) to avoid contamination of drinking water, and 3) to keep different pressurized aquifers separated. The functionality needs to be ensured beyond the time of utilization of the well. To ensure long-term integrity, even after abandonment, cement plugs are usually used. Well abandonment was the focus of a special series of full-scale in situ experiments at KIT (Figure 19), for which the system integrity of cemented casings at elevated temperatures (80 °C) and pressures (up to 8 MPa) were investigated.87
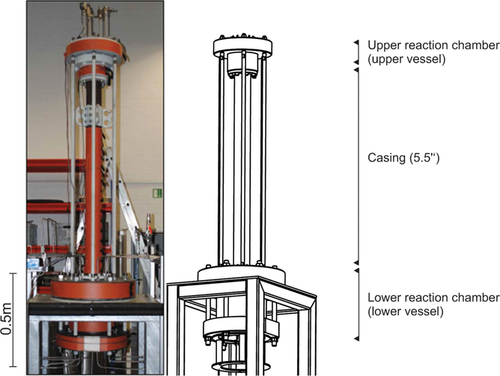
Photograph (left) and schematic (right) illustration of the full-scale autoclave COBRA for in situ tests of well integrity. Maximum 100 bar (1 bar=105 Pa) and 100 °C. Construction by Dustec Hochdrucktechnik GmbH.
Experiments show that the surface texture (especially roughness) of the drilled well has a significant influence on the formation of mud channels to create possible leakage pathways.87 Even under idealized cementation conditions of a laboratory, and while using a cement recipe that is characterized by a very low shrinkage, microannuli are formed that allow for fluid migration.87 The formation of microannuli could not be completely suppressed during cement hardening. Under the more complex conditions of a field drill site for the laboratory, deduced microannuli can be regarded as the lower bound for migration.
Beyond pathways, the migration of considerable amounts of fluids towards, for example, protection goods require a driving force; for example: 1) a sufficient pressure gradient, or 2) negative density gradient (lower density fluid beneath a fluid with higher density). In other words, if driving forces can be eliminated, contamination can be avoided.
Most of the known abandonment operations have been successfully tested in the oil and gas industry, in which fluids with low density (oil and gas) need to be securely prevented from migration. The lower density of these fluids relative to that of water result in the tendency to migrate upwards. Because abandonment is, in most cases, performed after oil and gas exploitation, a strong pore-pressure reduction within the reservoir level can be anticipated. Hence, the driving force of fluid migration can be considered rather small. Nevertheless, the low density of gases lead to an observed migration towards the surface in insufficiently completed systems.
For the postoperational phase on geothermal sites, some consequences of reservoir management occur. In classical geothermal applications, the circulated fluid is brine from the target formation. These fluids can be considered in a first approximation to have an original density comparable to that of or even higher than that of the overlying aquifers (due to natural density stratification). If higher saline fluids are involved, the density of the geothermal fluid will have an even higher density than that of drinking water, which is the legally protected goods. Furthermore, due to the exploitation of heat, the temperature of the geothermal fluid within the target formation should be colder than that of fluids within the overlying aquifers. Due to cooling of the fluids through geothermal exploitation, the overall pressure within the system usually should not exceed the initial natural hydraulic pressure; moreover, in most cases, a lower hydraulic pressure can be expected within the geothermally utilized formation. Therefore, if, due to reservoir management, the pressure within the reservoir is kept beneath the original hydraulic pressure level and the pressure level of the overlying aquifer, driving forces for brine migration can be excluded. Consequently, based on adequate reservoir management, the missing driving forces effectively eliminate contamination of the protected goods by brine through abandoned geothermal wells, even if the abandonment procedure is not perfectly performed.
3.2 Materials and geoprocesses
Circulating waters in deep geothermal power plants are not in equilibrium with in situ conditions concerning pressure, temperature, and chemical composition. Therefore, complex fluid–rock interactions occur, including mineral dissolution and/or precipitation reactions. These processes cause changes in the long-term hydraulic behavior of the reservoir and the mobilization of reservoir-specific naturally occurring chemo- and radiotoxic elements. Simulation of such processes plays an essential role in an efficient, secure, and durable construction; in the use of geothermal power plants; and it represents an indispensable tool for a quantitative understanding of the complex THMC processes in fractured crystalline reservoirs. The basis for process simulations is an artefact-free geochemical monitoring and analysis of circulating waters; an appropriate thermodynamic description of the brines, including the prediction of mineral precipitation; and their kinetics and the mechanistic understanding of technical solutions (e.g., inhibitor application) to prevent secondary-phase formation (scales/scalings).
Computational multiphase flow simulations based on equations of state are developed to estimate the dynamic chemical and physical conditions of a wellbore. They allow the estimation of parameters, such as temperature, pH, CO2−, Cl− concentrations, and the process of degassing of the fluid, which are prerequisite for studying corrosion conditions and material behavior. Another major challenge is to find suitable corrosion inhibitors for the complex and varying geochemistry at different geothermal sites. Apart from the investigation and evaluation of new and existing inhibitors, corrosion phenomena of various materials are generally investigated in electrochemical experiments and in exposure tests.
Due to their high salinity, geothermal brines are highly corrosive to materials applied in geothermal power plants. Material corrosion of metallic construction materials is therefore a major concern for operators in the geothermal industry. A reasonable material selection and corrosion engineering can enhance power plant availability and decrease the operating costs. The goal is to minimize corrosion processes of construction materials in geothermal power plants.
Material simulations are furthermore developed to capture electrochemically induced phase transitions, which are employed for the simulation-aided prediction of corrosion and damaging processes for various materials and temperature conditions. Hydrothermal simulations and hydrochemical modeling are used to investigate the influence of the fluid properties on the precipitation and corrosion process. An analysis of the corrosion tendency, depending on the geometry factors of the construction elements, forms the basis of an optimized construction of the power plant.
This cluster is closely linked to the cluster thermal water circuit (see Section 3.3).
3.2.1 Simulation of free growth of polycrystalline grain structures and crack sealing processes in veins
Large-scale phase-field simulation studies are performed to investigate both free growth of polycrystalline grain structures and crack sealing processes in veins. A multiphase-field method88 is successfully applied to study the influence of various parameters, roughness, opening velocity, and trajectory, on the crack–seal microstructure.33 In particular, the role of anisotropy in crystal/fluid surface energy on a polycrystalline sealing is examined.89 A detailed numerical study indicates that anisotropy in the surface energy of the growing crystals causes the grain boundaries to curve/oscillate during repetitive crack sealing processes, if wall rock is not sufficiently rough and the crack-opening rate is increased gradually, while still ensuring complete crack sealing before every opening event. The fineness of the fibrous microstructure is directly related to the number of peaks on the facing wall surface. Furthermore, the transition from fibrous to elongated blocky morphology in the vein microstructure caused by varying the crack-opening rate is observed.
Figure 20 illustrates the workflow of 3D phase-field simulations of vein sealing for uni- (one-sided) and bitaxial (two-sided) grain structure formation. To prepare the simulation domain, a fractal surface of the crack is generated and an initial grain structure is filled. The subsequent simulation formulates the advancing path of the wall rock as a boundary condition and computes the crystal evolution from either one or two walls of the crack. The resulting polycrystalline microstructures are analyzed to derive pattern formation properties, such as the grain size distribution, grain barycenter evolution, and 3D grain shapes. Correlations of the morphologies and the crack parameters are found.

Overview of phase-field simulations of crack-sealing processes. The workflow contains the computation of uni- (top chain) and bitaxial growth (bottom chain) and indicates possible quantities derived from microstructure analysis methods.
In unitaxial crack sealing, the influence of an algorithmically generated fracture surface is determined that opens up temporally along a curved trajectory on vein sealing in 3D. The 3D simulation results are supplemented by innovative numerical postprocessing and advanced visualization techniques.34b The newly proposed methodologies to measure the tracking efficiency in fractured veins reflect incremental fracture opening and demonstrate the importance of accounting for the temporal evolution of grains in 3D. No such information is usually accessible in field studies and difficult to obtain from laboratory experiments. The grain growth statistics obtained by numerically postprocessing the 3D computational microstructures show that the grain boundaries and multijunctions are preferentially arrested at fracture peaks, thereby enhancing the tracking behavior of syntectonic rock microstructures. By analyzing the temporal evolution of the numerically simulated vein microstructure, the grain multijunctions are pinned more strongly at the peaks on the fractured surface, compared with those at the grain boundaries.
Bitaxial crack sealing by epitaxial crystal growth is the most common vein-forming process in the earth's crust, but the details of the microstructural processes in those are not well understood. In Ref. 31, the evolution of bitaxial crack–seal veins in 2D and 3D are numerically modeled by using the phase-field method. The simulations show the influence of different parameters, such as the obliquity of crack opening and crack location, grain size, and orientations on the evolving vein microstructure. The underlying growth competition observed during epitaxial growth of quartz is examined. Results show many similarities with natural microstructures, such as stretched crystals, and compare well with previous numerical findings. Because the ratio of crack aperture and matrix grain size for the present studies are chosen to be sufficiently large for growth competition to occur before complete sealing, it leads to the formation of crystal fragments along the crack-opening trajectory. It is explained how such fragment trails act as potential indicators of the opening of crack–seal veins, if they are confirmed to be common in natural microstructures. In particular, the importance of accounting for the third dimension in the numerical simulations is highlighted by analyzing the evolution of fluid connectivity in 2D and 3D during the sealing process.
Apart from recent applications of the multiphase-field model88 to numerically simulate 3D vein sealing (summarized above), the phase-field approach is used to investigate the influence of wetting angle on coarsening dynamics in partially molten grain structures90 and polycrystalline evolution in zeolite thin films.32
3.2.2 Effect of reservoir rock composition on geothermometry—An experimental approach
The determination of reservoir temperatures is a major goal in geothermal exploration. Deducing in situ temperatures from the chemical composition of geothermal fluids emerging at the earth's surface is a commonly used and relatively low-price method. These geothermometers can provide valuable data, especially when no other temperature information is available (e.g., from borehole measurements). Over nearly five decades, a great number of geothermometers have been established; these can be assigned to three groups:
-
Solubility geothermometers, based on the temperature-dependent solubility of certain mineral phases, such as quartz and chalcedony.91
-
Cation-ratio geothermometers, such as Na−K, based on the temperature-controlled relative concentrations of Na and K that result from incongruent weathering of albite to sanidine.92
-
Isotope geothermometers, such as the oxygen isotope fractionation between dissolved sulfate and water,93 based on the temperature-dependent exchange of stable isotopes between two constituents.
Despite great efforts over the years, the application of geothermometers is still afflicted with great uncertainties.94, 95 Even when applied to the same fluid sample, calculated temperatures from different geothermometers often show intolerably varying results,96-99 with differences of up to 100 K.
Geothermometers are usually developed and calibrated by using data from a particular geothermal system that is distinguished by site-specific physicochemical conditions (dilution, mixing, boiling, dissolution/precipitation, etc.) Transfer to other geothermal sites can therefore be challenging. To overcome this limitation, often data from several locations are evaluated statistically. This strategy, however, masks the impact of every individual determinant on the calculated temperatures. The separation of those factors and the quantification of their sensitivity on the system would facilitate an effective improvement of the technique. Thus, an approach of well-constrained laboratory experiments is chosen, in which effects related to fluid flow are eliminated and only the reservoir rock composition controls the fluid chemistry.
To investigate the influence of rock composition on the geothermometers, a series of long-term batch experiments at 140 °C were performed. Experiments lasted for 1, 2, 4, 6, 8, 10, 20, 30, 45, 60, 90, 120, and 180 days. Each time step represents an autonomous experiment. Finely ground (grain size <63 μm) tonalite (≈40 % quartz, ≈30 % plagioclase, ≈15 % muscovite, ≈10 % biotite, ≈5 % chlorite) and andesite (≈40 % plagioclase, ≈25 % pyroxene, ≈10 % clays, ≈10 % magnetite, ≈5 % K-feldspar, ≈5 % chalcedony, ≈5 % chlorite) was exposed to pure H2O (130 mL) in two separate experimental series. The rock/water ratio was 0.3. The rock composition was determined by XRD and thin-section microscopy. The fluids were analyzed by inductively coupled plasma (ICP) mass spectrometry, photometry, and ion chromatography.
The Na−K temperatures were calculated from the batch solution composition, according to the procedure described in Ref. 100-102, and plotted versus reaction time (Figure 21). The results clearly show that calculated temperatures are far too high (between 300 and 500 °C) at the beginning of the experiment, but approximate to the ambient temperature of 140 °C with increasing reaction time. Both experiments attain near-steady-state conditions after around 120 days. On one hand, the Na−K geothermometers of the andesite experiment are in very good agreement with the actual reaction temperature, but, on the other hand, the tonalite experiment delivers unrealistic high temperatures of about 300 °C. Similar results have been observed (data not shown) by applying other geothermometers (e.g., Na−K−Ca, Na−K−Mg, K−Mg, Na−Li, Rb−Na, and solubility of SiO2 polymorphs), whereby the calculated temperatures are compatible to either the tonalite or the andesite experiments.
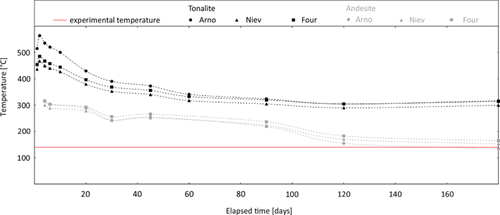
The results suggest that the mineral composition of reservoir rocks is of great importance and should be considered to calculate realistic temperatures. Ongoing research focuses on a number of further experimental studies, including typical reservoir rocks over a broad temperature range to provide results that are more systematic and to describe the effect of mineral assemblages on geothermometer calculations.
3.3 Thermal water circuit
Geothermal fluids are the transport medium of heat and are therefore an integral part of geothermal power generation. Depending on numerous parameters, such as the type of reservoir rock, fluid age, origin, and in situ P–T conditions, geothermal fluids typically show a complex chemical composition with strongly elevated contents of dissolved minerals. Commonly, deep geothermal brines are considered to be in equilibrium with the reservoir rock. The decrease of temperature and pressure during production results in imbalances to this complex chemical system and changes the solubility properties of the fluid. When saturation is exceeded, mineral precipitation (scalings) can occur. Apart from the insulating effect of scalings in the heat-exchanger systems, continuous precipitation in the wellbore or in surface installations causes a reduction of pipe diameters and can end up in complete clogging, which requires regular and expensive cleaning. Even more harmful to the sustainable operation of a geothermal power plant are scalings that occur after reinjection within the reservoir. Here, scalings can strongly decrease injectivity, and hence, the long-term efficiency of a plant.
Deep geothermal brines often contain chemotoxic constituents in critically high concentrations, as well as naturally occurring radioactive material. Mobile daughter nuclides of the decay chains of 238U, 235U, and 232Th are typical for fluids originating from a granitoid reservoir. Among these, the radioactive isotopes of radium (223Ra, 224Ra, 226Ra, and 228Ra) and lead (210Pb) are particularly in the focus of geothermal research. Due to their appropriate ionic radii, radioactive radium and lead are often incorporated in typical scaling minerals (sulfates and sulfides).
A profound monitoring and understanding of properties and interactions of elements in geothermal brine form the basis for scaling inhibition and the creation of fluid transport models.
In the thermal water cycle of a geothermal power plant, the precipitation of minerals (scalings) from geothermal fluid is a common observation.103 Scalings form due to pressure reduction and triggered degassing of the geothermal fluid, and they can result in a reduction of the pipe diameter and efficiency drop. In the worst case, complete clogging requires shutdown of the power plant to clean the pipe system by acidification or the porous and/or fractured reservoir rock formation is completely clogged and the reservoir has to be abandoned.
3.3.1 Forced barite precipitations in geothermal reservoir rocks
As observed in Soultz-sous-Forêts (France), barite is one of the dominant scaling minerals.104 Knowledge about the early stage of scale deposition (nucleation and growth kinetics) enables better prediction of long-term performances of geothermal wells. Thus, the hydraulic effect on rock samples over geothermally relevant pressure and temperature ranges has been investigated in detail. This research focuses on the correlation between barite scaling and permeability changes by simulating the reinjection environment on a laboratory scale.
Core-flooding experiments were performed with a setup named HydRA (hydrothermal reaction apparatus; Figure 22). The individual components are an autoclave for the core sample, two reservoir tanks for the hydrochemical solutions, three membrane pumps (LEWA), a scale, heaters, and a number of pressure and temperature sensors. All components are connected by pipes made of 1.4571 noncorrosive austenitic steel.105 The rock sample is fixed by a core holder and is tightly enclosed by a silicon tube to avoid fluid flow around the rock. The confining pressure, which is always ≥10 % higher than the experimental pressure, is applied by deionized water. The test solutions are pumped by two separate membrane pumps to ensure the regulation of mass flow. The flow rate is adjusted by the lifting height and speed. In all tests, this parameter is fixed to 1 cm3 min−1 for each pump.
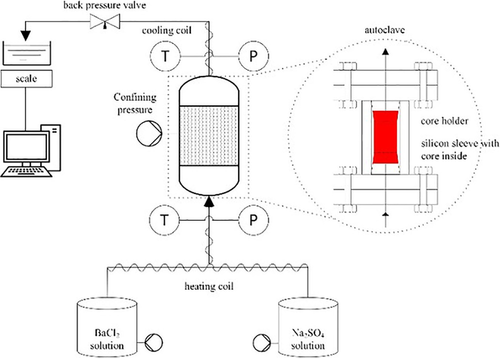
Scheme of the experimental setup HydRA, which is used to perform the core-flooding experiments.
The three membrane pumps of the setup work with deionized water. This concept guarantees that the pumps are not contaminated with the salty solution, which might cause corrosion of certain components. Parameters such as temperature, pressure, and the mass flow are recorded digitally, stored, and visualized using the software OPAL.106
To simulate the change of permeability, a rock sample is percolated with a supersaturation with one mineral phase within the HydRA apparatus. The sample is a sandstone of the Mittlerer Buntsandstein formation, which is a common reservoir rock for geothermal energy in the Upper Rhine Valley.
 (4)
(4)Each of the parent solutions consists of a solution Na−Ca−Cl with around 100 g L−1 of total dissolved solids (resembling the Soultz-sous-Forêts geothermal fluid)107 and a specific concentration of BaCl2 and Na2SO4. Both solution speciation and finally intended supersaturation have been computed by using the geochemical code PHREEQC108 and its default database.
The effluents are frequently analyzed and measured by inductively coupled plasma optic emission spectroscopy (ICP-OES; Optima 4300 DV; PerkinElmer) to keep track of the precipitation process and some water–mineral interactions. To examine the change of the mineral phases and precipitations into the pore spaces, thin-layer sections are prepared and analyzed by SEM (DSM 982 GEMINI, Zeiss) with a dedicated EDX unit (INCA Pentafet™, Oxford) to analyze the elements.
 (5)
(5)in which k(t) is the intrinsic permeability (in m2), n is the dynamic viscosity (in Pa s), Q is the flow rate (in m3 s−1), L is the length (in m), A is the cross section (in m2), and Δ p is the differential pressure (in Pa).
Barite crystals with different habits are visible in the SEM image (Figure 23). They are positioned in the pore spaces between the initial mineral phases, which are mainly quartz and feldspar. Growth can be considered as free homogenous nucleation into space. This is confirmed by the observation that the growth of the crystals has no preferred position, such as accretions around some preexisting minerals. The crystals are embedded into an undefined matrix that is visible in the SEM image. This material is the resin from the preparation, which is detectable in all free spaces (dark-gray areas in Figure 23, marked by the arrow.
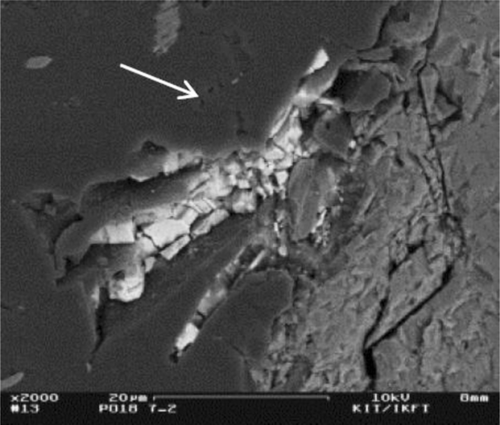
Back-scattered electron (BSE) photomicrographs of barite crystals appearing in white in the pore space of the rock sample.
The white areas are barite crystals with a size of approximately 25 μm, their habits are subrhombic and tabular. In other SEM images, the crystals are more thinly tabular.109 By looking at the change of the solution, the effluents are analyzed with regard to the following elements: Ba2+, Cr3+, Mg2+, Ca2+, Na+, Sr2+, K+, Fe2+, Li+, Al3+, Si4+, and SO42−.
The startup of HydRA was performed with deionized water. Thus, the desired mass flow, temperature, and pressure were adjusted. This results in the first dilution of the supersaturated solution until all deionized water is displaced. For the barium concentration, the curves have a characteristic shape (Figure 24).
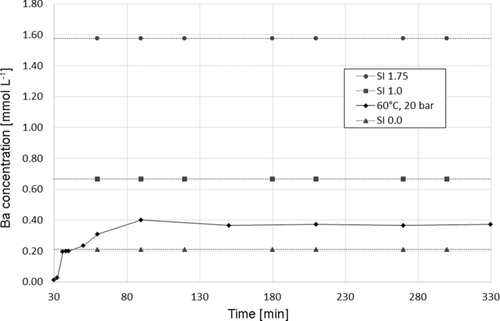
Time-dependent development of barium concentration relative to different saturation indices (SIs).
The database for this diagram is an experiment that was conducted at 60 °C, 20 bar (system pressure), and an initial supersaturation of SI 1.75. The abscissa shows the elapsed time since the start of the experiment and the ordinate shows the barium concentration in mmol L−1. The slow increase in barium concentration at the beginning of the curve is caused by the abovementioned dilution effect. Then a significant increase of the barium concentration is a stable concentration of 4 mmol L−1. This concentration plateau can be observed over the whole experimental process. The equilibrium state (SI 0.0) was reached at t=0; the concentration remained the same between SI 1 and SI 0.
Further investigations covering the research field regarding higher temperatures. Currently, all tests are conducted at temperatures of 20 and 60 °C. The next steps will cover the injection environment around the geothermal well with temperatures up to 200 °C. Following the successful approach of Ruiz-Agudo et al.,110 future research could involve studying the interaction of chemical additives (e.g., phosphonates, carboxylates) with existing barite minerals (redissolution, growth blocking) and retardation of barite precipitation.
3.3.2 In situ measurements of degassing and scaling in geothermal power plants
In most power plants, the pressure is kept high to avoid degassing and scaling and to optimize the power plant cycle to reduce power costs of the pump.
This research focuses on degassing and scaling affected by the parameters (e.g., pressure and temperature) of the thermal fluid cycle inside the power plant. For this purpose, a mobile test facility was installed next to the geothermal power plant Unterhaching, Munich, located in the South German Molasse Basin. Within the BMWi funded project Scaling and Degassing in Geothermal Power Plants (FKZ: 0325160A), in situ measurements of degassing and triggered scaling with a focus on calcite precipitation were performed at this site.
To perform degassing and scaling tests, geothermal fluid is directly taken from the power plant. In the following discussion, all pressure values are given in absolute pressure. Degassing tests are performed inside a pressure tank. Therefore, the pressure tank is filled with geothermal fluid at around 10 bar and a temperature between 90 and 120 °C (pressure and temperature arriving from the power plant) then the pressure is slowly reduced to ambient pressure. The amount and composition of the forming gas are measured from 5 bar down to ambient pressure, in steps of 0.25 to 0.5 bar. Measurement and analysis of the gas is started at 5 bar due to the determined degassing point of the geothermal fluid at around 4 bar.111
 (6)
(6)Therefore, filter tests are performed to determine the amount of scaling triggered by degassing. The filter case with filter paper of 0.45 μm pore size is integrated into the test facility at different points (Figure 25). The preset pressure from 8 bar down to ambient pressure was held constant over the whole test facility to sample only scalings forming at a specific pressure level. To obtain representative results, all filter tests were performed for approximately 1 h with a mass flow rate of 25 L h−1. All data shown herein are taken from temperatures between 90 and 120 °C, which is the temperature range of the fluid arriving from the power plant. During all measurements, external heating was only used to keep the temperature over the whole test line constant. Further scaling measurements were performed without external heating to obtain data at lower temperatures.
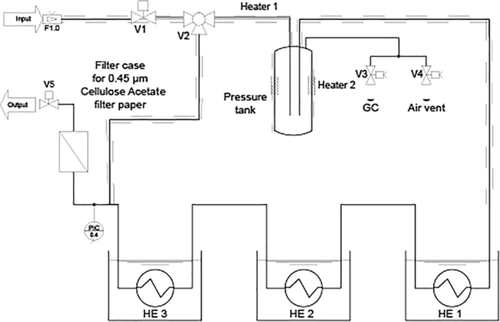
Schematic illustration of the experimental setup installed next to a power plant for performing degassing and scaling measurements. V: valves, HE: heat exchanger, GC: gas chromatograph, F: filter.
The mobile test facility for the degassing and scaling experiments (Figure 25) consists of the following components: flow control valve (V1), pressure tank (heated) for the degassing tests, gas chromatograph (PerkinElmer), three heat exchangers for temperature drop, pressure maintenance valve (V5), and a filter case for the filter tests. All components are connected by heated pipes to keep the temperature constant until the heat exchangers at which the temperature is gradually reduced. The filter case can be integrated before and after the pressure tank and heat exchangers. The geothermal fluid is extracted directly from the power plant in front of the filters and arrives with a mass flow rate of about 120 L s−1 and a pressure of around 10 bar. Inside the test facility, it is reduced to 10–25 L h−1 and 1–4 bar. Parameters such as pressure, temperature, and flow rate are recorded digitally by using the software OPAL.106 With OPAL, it is also possible to operate the test facility by remote control.
All components of the forming gas were analyzed. Herein, only selected results are shown. The filter case was installed in front of the heat exchangers (Figure 25). Figure 26 shows the amount of CO2 forming and the mass of precipitated scalings for each pressure step. Pressure values are read from right to left. The graph clearly shows that the degassing process starts at around 4 bar, which agrees with the theoretical value reported in Ref. 111. With decreasing pressure, the portion of CO2 in the forming gas increases to 39 vol % at a pressure of 1.25 bar. Scalings are present at all pressure levels. Above the degassing point, the mass is below 0.2 mg L−1. By reaching the degassing pressure, the data show a significant increase in the mass of scalings. This correlates positively with the amount of CO2 forming and reaches the highest value with a scaling of 0.53 mg L−1 at ambient pressure.
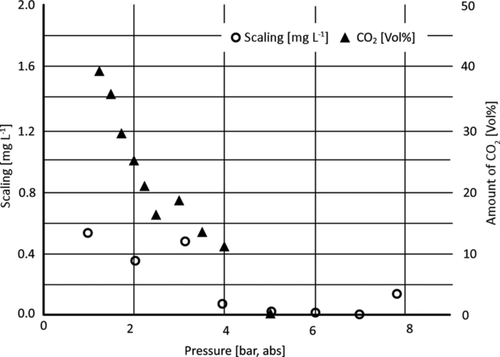
Amount of scaling (left) and amount of degassing CO2 (right) versus pressure of the geothermal fluid.
In the South German Molasse Basin, scaling formation is primarily related to a pressure drop below the degassing point and triggered degassing, especially of CO2. In the present experiment, scaling formation above the degassing point of the investigated geothermal fluid is also observed. The mass of scalings shows a significant increase when reaching the degassing point. Therefore, it is suggested to always operate geothermal power plants above the degassing pressure of the geothermal fluid used. To optimize the thermal water cycle of the power plant, it is advisable to determine the degassing pressure of the specific geothermal fluid and operate the power plant slightly above this point. An operation mode just above the degassing point can reduce power costs of the whole power plant significantly without reducing efficiency due to scaling formation and clogging.
3.3.3 Mineralogical analyses of scaling samples precipitated in the presence and absence of sulfate scaling inhibitors
In the frame of several projects, a mineralogical analysis of scaling samples from geothermal power plants was performed. The mildly radioactive samples were treated and analyzed in the controlled area at the Institute for Nuclear Waste Disposal at KIT by X-ray photoelectron spectroscopy (XPS), SEM-EDX, powder XRD, and Raman spectroscopy.
Scalings precipitated in the absence of scaling inhibitors in or after the heat exchanger consist mostly of mixed sulfate minerals (Ba,Sr,Ca)SO4. These solid solutions host traces of the natural uranium and thorium decay products 226Ra and 228Ra. Along with the sulfate minerals, we observe sulfide minerals, either crystalline galenite (PbS) or X-ray amorphous mixed sulfide minerals of varying composition, (Pb, As, Sb, Cu)S. A SEM image of such a scaling, showing lamellar aggregates of (Ba,Sr,Ca)SO4 and PbS crystals, is displayed in Figure 27 a.
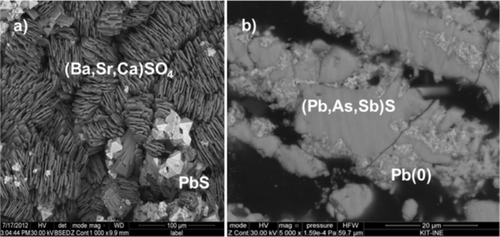
SEM images of mineral scalings. a) Sulfate scaling exhibiting lamellar aggregates of (Ba,Sr,Ca)SO4 and galenite (PbS) crystals. b) Typical scalings formed during application of a sulfate scaling inhibitor. These consist mainly of amorphous (Pb, As, Sb)S and elementary lead (Pb0, bright spots in the BSE image). Scale bars correspond to 100 and 20 μm.
Sulfate scaling inhibitors are applied very successfully in some geothermal power plants in the URG. The application of inhibitors led to the absence of sulfate minerals in the geothermal scalings. Nevertheless, thin layers of porous scalings form at the surfaces of pipes in and after the heat exchanger. These consist of amorphous mixed-sulfide phases that are rich in arsenic, antimony, elementary lead, traces of laurionite [PbCl(OH)], and other minerals (Figure 27 b).
The use of inhibitors drastically decreases the total amount of scalings formed. Due to the absence of sulfate minerals, radium deposition in the scalings no longer plays a significant role, and the total amount of deposited radioactivity decreases. However, the remaining lead and sulfide scalings are enriched in natural 210Pb and exhibit an even higher specific radioactivity (in terms of Bq g−) compared with previous sulfate scalings.
3.3.4 Surface interactions of phosphonate inhibitors with scaling minerals
Scaling inhibition is a topic of major importance in geothermal energy production because it reduces efficiency and profitability of a geothermal power plant.112 Although empirically determined mixtures of inhibition additives are added to avoid precipitation, the inhibition mechanisms remain unclear, as well as the kinetic properties of phosphonate complexation and adsorption. If inhibition is merely a kinetic effect, this phosphonate application can simply relocate the scaling process upon reinjection of the geothermal fluid into the lower parts of the piping system or the reservoir. Therefore, a better understanding of these mechanisms is crucial to avoid unnecessary expenses, losses, and pollution of the environment.113
The interaction of phosphonates with barite and calcite surfaces was investigated through multiple series of 24 h batch experiments. Supersaturated solutions (40 mL) of barite (SI 0.5–3.0) or calcite (SI 0.1–1.5) in the presence of phosphonate inhibitors (10–250 μmol L−1; 1-hydroxyethane 1,1-diphosphonic acid (HEDP) or diethylenetriamine penta(methylene phosphonic acid) (DTPMP), and unconditioned or preconditioned substrates (25–75 mg scaling minerals barite, calcite, reservoir minerals quartz and kaolinite, or piping rust mineral goethite) were used in experiments performed with ionic strengths of 0.1 mol L−1 KCl, at 25 °C and 1 atm, to determine handling amounts and concentrations for later geothermally relevant conditions. Changes in the solution composition were determined by photometry (phosphate), atomic absorption spectrometry (AAS; Ca) and ICP OES (Ba, S). The solid phase was characterized by means of SEM coupled to X-ray fluorescence (XRF).
Results showed that trace amounts of DTPMP generally reduced barite precipitation by 40–50 % relative to that with HEDP, which showed little inhibition (Figure 28). Goethite, however, was highly efficient in adsorbing nearly 97–100 % of the inhibitor, nullifying its effectiveness. Preconditioning reservoir minerals with phosphonate inhibitors had little to no effect. Results also showed HEDP inhibition to be more effective on calcite precipitation (data not shown) than that of barite. As observed by SEM (Figure 29), rhombohedral calcite surfaces were covered with 50 nm thin phosphonate layers (EDX measurements confirmed P content) after they were treated with 50 μmol L−1 HEDP. In situ IR measurements also showed the inhibition equilibrium to be reached almost instantly.
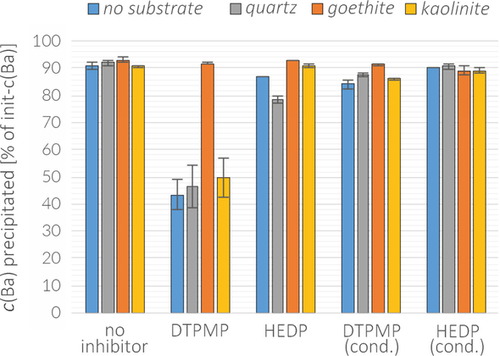
Barite precipitation differences between the addition of 25 μmol L−1 HEDP or DTPMP and unconditioned or preconditioned 50 mg substrates of quartz, goethite, or kaolinite with 25 μmol L−1 HEDP or DTPMP (solution: SI 2.45, 0.1 m KCl, 25 °C, 1 atm; calculations were performed by using remaining Ba content in solution).
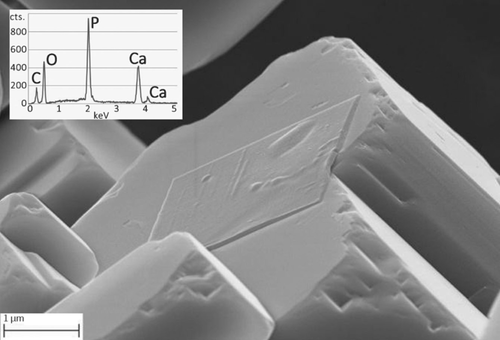
SEM image of an HEDP layer on rhombohedral Merck calcite (75 mg) treated with a solution of calcite (40 mL; SI 0.1) with 50 μmol L−1 HEDP and 0.1 m NaCl.
Our study clearly confirms the previously reported, but still not explained, substoichiometric effectiveness of phosphonate inhibitors.114 As proven by SEM observations, phosphonates interact with the mineral surface and may prevent further precipitation by blocking a critical amount of kink sites, as also discussed by Ukrainczyk et al.115 In this context, surface properties of different reservoir minerals and speciation or complexation of the inhibitor molecule seem to be of importance, as discussed by Ukrainczyk et al.,115 Baynton et al.,116 and Shaw et al.117 DTPMP, for example, is much less effective when goethite, as a proxy for corrosion products, is present instead of kaolinite or quartz (Figure 29). This can be partly explained by a lack of positively charged surfaces of the last two minerals compared with that of goethite. However, as also proven by the lack of effectiveness of preconditioned substrate minerals at inhibiting precipitation, the generally observed effectiveness cannot be purely attributed to surface inhibition effects, but must also result from phosphonate complexation properties, as discussed by Drela et al.;118 hydrophobic repulsion, as discussed by Tomson et al.;112 or a combination of all three.
Our study demonstrates that more basic research is necessary to unravel these phosphonate inhibition mechanisms on a molecular and on a macroscopic level, which is a prerequisite for more effective use. Future research will focus on batch and flow reactor experiments with geothermally relevant solution compositions and temperature/pressure conditions, in combination with in situ monitoring tools and sophisticated surface-sensitive methods.
3.3.5 Influencing parameters on the precipitation of BaSO4 from geothermal brines
Due to its very low solubility, barium sulfate (barite, BaSO4) is often involved in scaling formation.104, 119 Once precipitated, it can only be removed by mechanical means. For a better understanding of the mechanisms of barite precipitation, experiments were performed to investigate the influence of the following parameters on the precipitation rate of BaSO4: 1) supersaturation, 2) overall salt concentration, 3) shear rate (as a measure of the flow conditions), and 4) molar ratio of n(Ba2+)/n(SO42−).
Model solutions of Na−Ca−Cl were prepared to resemble typical geothermal water from the North German Basin (NGB) and the URG (see Table 1). Experiments were performed in an annular gap apparatus (Figure 30) and in glass vessels.
Salt |
Content in brine type [g L−1] ([mol L−1]) |
|
|---|---|---|
|
NGB |
URG |
NaCl |
104 (1.774) |
77.1 (1.320) |
CaCl2 |
161 (1.449) |
24.8 (0.224) |
TDS[a] |
264 |
106 |
- [a] TDS: total dissolved salt.
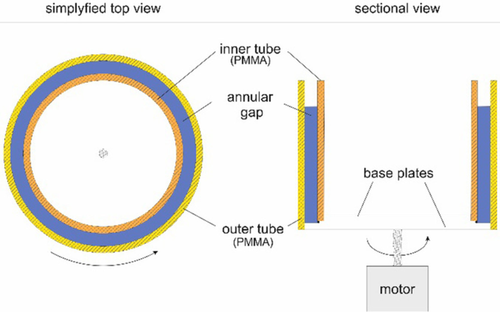
Schematic drawing (top and sectional view) of the annular gap apparatus setup (for details, see Ref. 120). PMMA=poly(methyl methacrylate).
The influence of solution movement on precipitation can be determined by using well-defined fluid shear rates. To keep the shear rate nearly constant throughout the fluid, an annular gap apparatus was built. It consisted of two PMMA tubes (inner diameter of the outer tube: 400 mm) mounted with an annular gap of 10 mm on two pivot-mounted circular base plates. When rotating the outer tube with different velocities, different shear rates are applied throughout the solution in the annular gap. The rotational speed was varied to investigate the influence of different shear rates on the precipitation rate of BaSO4.
 (7)
(7) (8)
(8)in which a(Ba2+)actual and a(SO42−)actual are the actual activities of barium and sulfate ions and a(Ba2+)equil and a(SO42−)equil are the activities of barium and sulfate ions at equilibrium. A higher SI means that more barium sulfate can precipitate. SIs were calculated with PHREEQC, version 3.1.2, software.108
In geothermal plants, brine saturated with minerals is cooled in the heat exchanger. With decreasing temperature, the solubility of barite decreases, resulting in supersaturation with barite. Experiments in this study were performed at room temperature. Supersaturation was attained by adding solutions of BaCl2 and Na2SO4 in the necessary excessive amounts.
At predetermined times, samples were removed, filtered (pore size 0.2 μm), and diluted. Nitric acid was added and the barium concentrations were determined by ICP-OES. For more details, see Ref. 120.
Figure 31 shows barium ion mass concentrations, normalized to the initial concentration, versus time at different SIs between SI 0.49 and 1.98. The model brine used is that of NGB type with stoichiometric ratio of n(Ba2+)/n(SO42−).
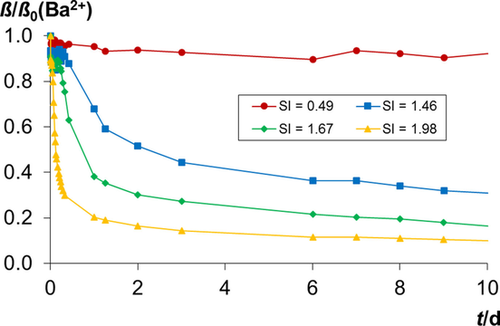
Barium ion mass concentration, β (normalized to the initial concentration β0), versus time at four different SIs in NGB model brine (Ba2+/SO42−=1, glass vessel, stirred).
It can clearly be seen in Figure 31 that the decrease of the barium mass concentration, and thus, the formation of barite, becomes faster with higher supersaturation. With the lowest SI, the barium mass concentration remains nearly constant. Even after 10 days, no significant decrease is observed.
Supersaturation is one of the driving forces of precipitation. Higher supersaturation results in the precipitation of more barite. With higher supersaturation, the concentrations of Ba2+ and SO42− ions rise, and therefore, the probability that a Ba2+ ion finds a SO42− ion to form BaSO4 also increases.120
By comparing model brines at different overall salt concentrations, the barite precipitation rates decrease with rising overall salt content. At lower barite supersaturations, there is a clearer difference between precipitation rates when different overall salt concentrations are used. This corresponded well with the results reported by Jones et al,121 who suggested that slower precipitation with increasing ion concentration resulted from the higher solubility of barite, and thus, lower supersaturation. Hennessy and Graham suggested a further explanation that foreign ions acted as a nucleation inhibitor.122 This effect seems to be more pronounced at lower supersaturation.
Figure 32 shows the results of annular gap experiments at given shear rates in the URG model brine. The influence of the shear rate is distinct; precipitation is slow at 0 min−1, faster at 2 min−1, and fastest at 40 min−1. In the NGB model brine, there is no significant difference between the three shear rates of 0, 2, and 10 min−1 (not shown herein).
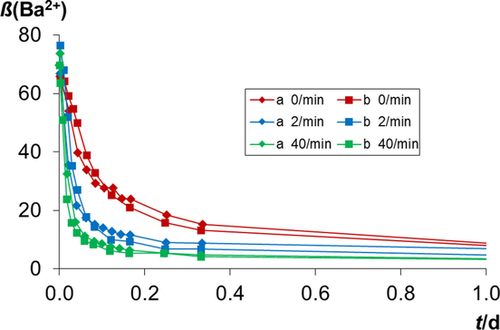
Barium ion mass concentration, β, versus time at different shear rates in URG model brine (Ba2+/SO42−=1/6.16, SI 1.96, annular gap). Shear rates for two different measuring series a and b are given as rotation velocity of the annular gap apparatus.
In the URG model brines, in which barite precipitation is generally faster than that in the more saline NGB model brine, transport processes seem to be the limiting factor of the reaction. Fitchett and Tarbell studied the influence of mixing on barite precipitation rates in pure water and found that the barite growth rate increased with higher mixing speed.123 They also proposed mass-transfer-limited particle growth.
Experiments at different molar ratios of n(Ba2+)/n(SO42−) in the URG model brine have shown that barite precipitation becomes faster with rising sulfate excess. In the stirred solution, there is an increase in precipitation rate from stoichiometric to 6.16-fold sulfate excess. However, when the sulfate excess is doubled from 6.16 to 12.5, only a little difference, if not a slight decrease, in precipitation rate can be seen.
Relative to the stoichiometric ratio, excess sulfate accelerates barite precipitation in these saline brines. An excess in SO42− ions enhances the probability that a Ba2+ ion comes into contact with them; thus forming barite. This is more important in the unstirred solutions, in which transport processes are slower than those in the stirred solutions. Therefore, the effect in unstirred solutions is more pronounced.
Further experiments and details can be found in Ref. 120. The influences of different parameters on the barium sulfate precipitation rate have been studied. Precipitation rate rises with rising supersaturation, with lower overall salt concentration, with higher shear rate, and if sulfate is added in excess.
There are interdependencies between the parameters, for example, at higher shear rates, whereas some other influences become less pronounced.
3.3.6 Solid-solution thermodynamics of (Ba, Ra)SO4
As one key parameter to enable the geochemical modeling of Ra2+ incorporation into barite scalings, the thermodynamic properties of the (Ba, Ra)SO4 solid solution is investigated by means of batch-type barite recrystallization experiments in the presence of 133Ba and 226Ra. This approach enables the simultaneous quantification of the amount of recrystallized barite and the corresponding amount of 226Ra taken up by the solid solution, and to monitor the partition coefficient as a function of time. The corresponding partition coefficients measured at three different initial Ra2+ concentrations, 5×10⁻¹⁰, 10−9, and 10−8 mol L−1, at room temperature, converge after about 80 days to a constant value of 0.54±0.08. The results are best described by a regular solid-solution model by using the tabulated solubility constants for RaSO4 and barite, 10−10.26 and 10−9.97,124 respectively, and a nondimensional Guggenheim parameter, a0=1.3±0.1. The results are in excellent agreement with a recent theoretical investigation into (Ba,Ra)SO4 miscibility.125 The corresponding relationship between the equilibrium compositions of the aqueous and solid solutions is displayed in the Lippmann diagram in Figure 33. It shows an allyotropic point at around X(RaSO4)=0.25.
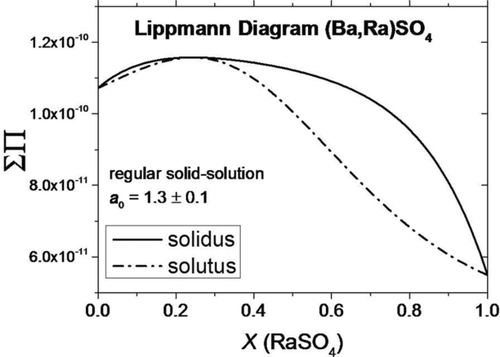
Lippmann diagram showing the relationship between aqueous and solid solutions in the (Ba,Ra)SO4 system. X(RaSO4) is the molar fraction of RaSO4 in the solid and liquid phase, respectively. ∑Π is the overall solubility product, according to Lippmann theory.126
3.4 Plant operation
Power plant cycles used for geothermal power generation from hot fluids are usually designed as Clausius Rankine or modified Clausius Rankine processes. Although the use of geothermal power for the generation and storage of energy is based on the thermodynamic laws of common energy technology, the influence of geological conditions has to be considered and the design of algorithms and optimization strategies have to be developed. Therefore, this cluster aims to investigate energy- and process-related aspects of geothermal power production.
The research fields are broad in scope. They include aspects of surface technologies from conception to the technical design and construction of system components. The main goal is the efficiency increase of geothermal power production through the optimization of heat transfer or by site-specific adaption of the components to each other. The obtained results can be directly transferred to other low-temperature heat applications.
The focuses are on the analysis of physical properties of thermal fluids and the validation of parameters for geothermal cycle processes. This also includes parameters in supercritical media. Another focus is on heat transfer in heat-exchanger modules. Power plant processes are simulated in numerical models and strategies for concepts and optimization of power plant components are developed.
A special aspect of geothermal power plants is that they are individual and site specific with different framework conditions. By investigating a modular constructed cycle, the relationship between individual components is analyzed to accelerate site-specific adaptions.
The heat exchanger plays a decisive role in increasing efficiency. Therefore, processes in thermal water and in heat transfer media inside the heat exchanger are the focus of investigation. Hereby, experimental analyses are accompanied by numerical process simulations.
3.4.1 Tool design for the thermoeconomic optimization of geothermal power plants
Low-temperature heating between 100 and 200 °C can be used for power production through organic Rankine cycles (ORCs). Despite their superior power output, supercritical ORC plants have been largely ignored by industry because of their significantly higher investment costs. However, a properly optimized ORC operating at supercritical pressure could have a higher net power output, and therefore, a better economic return over its life cycle, as past studies have demonstrated.127 Here, two thermodynamic models of optimized plants are developed for the same boundary conditions, and their costs are compared by using correlations from literature and industry. The first is a subcritical cycle utilizing isopentane as a working fluid; the second a supercritical cycle with propane. The net power outputs over a lifetime of 20 years is compared by taking into account parasitic requirements. It was shown that the supercritical cycle had a higher net present value (NPV) compared with that of the subcritical cycle.
The Rankine cycle is a conventional and proven technology known for many years. One heat source is that of geothermal energy and the supercritical ORC is one such system that can harness underground heat energy due to its suitability with mid-to-low enthalpy sources. Figure 34 shows the temperature versus entropy (T–S) graph of a supercritical ORC with propane. The direction of geothermal fluid and cooling air is also shown. However, high pressures are required for the fluid to reach a supercritical state and this creates a higher investment cost for the components needed to withstand such conditions. The thermodynamic optimum is not the decisive factor for the best economic result. It is desired to use an in-house Matlab code GeSi (geothermal simulation) as a framework to create a thermoeconomic tool that will optimize an economic objective function, such as NPV.128
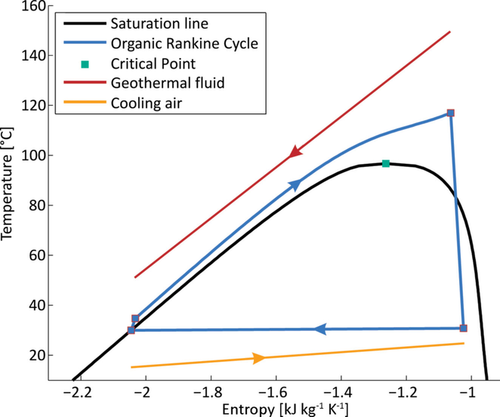
The T–S diagram of the design point of the simulated supercritical process with a schematic illustration of the temperature curves of geothermal fluid (red) and cooling air (yellow).
In previous studies, Vetter et al. showed that significant performance improvements were possible under supercritical conditions.129 A study in Bayreuth compared the specific costs of sub- and supercritical cycles, and showed a shorter payback period for a supercritical RC318 cycle than that for a subcritical cycle of the same fluid and specific investment cost (SIC).130 They concluded that a supercritical mode of operation had significant potential for increasing gross power at medium temperatures (130–160 °C). For this study, GeSi was used to model and simulate the process of the power plant.
Information was obtained on well depths, flow rates, and groundwater temperatures throughout Germany.131 A thermal water availability of 40 kg s−1 at 159 °C, a condensing working fluid temperature of 30 °C, and an ambient temperature of 19 °C was chosen for the boundary conditions of the hypothetical plant.
Both cycles (sub- and supercritical) are nonrecuperated, air-cooled cycles with isopentane for subcritical and propane for supercritical modes. Areas in which this technology can be most effectively applied tend to be those with limited cooling water supplies. Air-cooled condensers are more expensive and require more power to operate than either water-cooled or wet-cooling towers, but, if water is scarce, and for ease of modularization, air cooling is practically and economically reasonable.
Only the portion of the plant above the surface was included here. Therefore, the thermal water system, including drilling and pumps was not included as part of the cost. Other factors not considered relevant for this comparison are the pressure loss in the piping system, working fluid costs, parts replacement, and heat-exchanger fouling over its lifetime. The main components of the power plant model are the evaporator, condenser, turbine, and pump. The condensing temperature can be optimized, along with other factors of the system. If the condensing temperature is raised, less power is required from the fan to cool the tubes, but the system becomes less thermodynamically efficient and can produce less power. If the condensing temperature is held constant, then fluctuating ambient temperatures will require that the fan produces a higher or lower mass flow of air across the tubes, which means more power is required for the fan. A temperature profile of Karlsruhe was created to model the condenser performance throughout the year by using a historical weather API.132
The turbine and pump are modeled based on their power output and consumption, respectively, and accounted for in the physical model based on their efficiencies. A turbine/generator efficiency of 0.7 was assumed, and a pump/motor efficiency of 0.8.
Based on thermodynamic optima obtained from GeSi, further calculations were performed to create a basic model of each plant that would allow a first-order financial analysis. The costing parameters require that key parameters of the evaporator, condenser, turbine, and pump be calculated (Table 2).
Property |
Isopentane |
Propane |
|---|---|---|
ORC flow rate [kg s−1] |
30.5 |
44.8 |
ORC pressure [MPa] |
0.7 |
6 |
steam temperature [°C] |
100 |
130 |
net power output [kW] |
1386.7 |
1656.3 |
pump power usage [kW] |
43.6 |
908 |
fan power usage [kW] |
89.6 |
486.7 |
The purchased equipment cost (PEC) includes the cost of the major components, and is the value upon which the remainder of estimates is based. This will be usable for a study estimate of +20 to −30 %.The supercritical plant is of a higher capacity and it is expected that the capital cost will be significantly greater because of the added area and higher pressures that the heat exchanger will need to withstand. The PEC for the subcritical cycle is about €1.5 million and for the supercritical cycle €2.35 million. The total fixed capital investment (FCI) results in €1.93 (sub-) and 3.03 million (supercritical). The SIC for the subcritical plant is €1394 kW−1, whereas for the supercritical plant it is €1829 kW−1. The numbers do not take into account the cost of the well and other auxiliary equipment, which would more than double the given cost herein.
The NPV is a way to represent the value of a plant over its lifetime (20 years), and is useful when the price at which electricity can be sold is known. It was used as the objective function in an optimization performed by Walraven et al.128 A cost of €52.7 million was obtained for the subcritical cycle and €62.2 million was obtained for the supercritical cycle. Proper design of a supercritical ORC plant can result in long-term economic benefit over the lifetime of the plant, if the power can be sold for an appropriate price.
The end goal is to be able to use GeSi as a framework for performing fast thermoeconomic optimization, as part of a first-order design and costing estimate. Creating a more integrated set of component design tools that can be called iteratively would be the first step. Further analysis can be performed by using past work. Beyond the methods used to optimize the cycle, a future study might consider alternative technologies.
Future experiments and studies can be conducted on the test power plant MoNiKa, which is currently under construction at KIT. This test plant will be able to provide a unique insight into low-temperature power generation as a result of its mobile nature and interchangeable components with broad operating ranges and will be used for further study and validation of continuing work at KIT. This facility is described in detail in Section 4.1.
3.4.2 In situ measurements of thermophysical properties of geothermal fluids
The research project PETher (funded by BMWi, FKZ 0325761A) investigates the thermophysical properties of geothermal fluids in the hydrothermal key regions in Germany. The geothermal fluids of these regions differ considerably. In the NGB, highly corrosive fluids with salinities of up to 360 g L−1 are encountered. Fluids in the URG have extremely variable chemical compositions and salinities of up to 110 g L−1, whereas the fluids in the South German Molasse Basin have comparatively low salinities in the range of 0 to 10 g L−1.
Usually, only selected physical properties are investigated under laboratory conditions for one power plant and fluid, respectively. Data from in situ measurements are sparse to nonexistent, especially with a salinity of up to 360 g L−1, pressures of 20 bar and higher, and a wide temperature range (room temperature to 170 °C). Therefore, the properties of pure water are often used as reference data and for the design of a power plant and its components.
Moreover, presently available numerical models to describe the thermophysical fluid properties are typically not valid for conditions in geothermal applications. They do not consider the substantial influence of the chemical composition and salinity of the geothermal fluid. Owing to the lack of reliable data, a validation of numerical models for investigating geothermal systems is not possible.
The thermophysical properties evaluated are specific isobaric heat capacity, cp; kinematic viscosity, ν; density, ρ; and thermal conductivity, λ. Other fluid properties that are investigated are chemical composition, gas content, pH, and redox potential. The thermophysical properties (cp, ν, ρ, λ) are experimentally determined as functions of temperature, pressure, and salinity with a specifically designed mobile testing unit (described in Ref. 133). It is constructed for measurements at temperatures up to 170 °C, pressures of up to 25 bar, and salinities up to 360 g L−1 (which is the solubility limit for NaCl). This mobile testing unit with its parameter range is unique.
The results are essential for designing and optimizing geothermal power plants (e.g., heat exchanger) and for the reduction of uncertainties in estimating their profitability. Data are recorded digitally and visualized with the software OPAL.106
To establish a broad data basis for thermophysical properties of geothermal fluids, the following methods are used: 1) in situ measurements under operational conditions at operating power plants, 2) laboratory test series with fluid taken from geothermal wells, and 3) laboratory test series of artificial geothermal fluids (mixtures of purified water and selected salts).
Whereas method 1 is closest to the real conditions, but challenging to execute, method 2 is state-of-the-art, but afflicted with degassing and precipitation during transport. The easiest and cheapest way of producing results is to use method 3, but these results can differ significantly from reality with regard to the solubility of minerals and gases. Although methods 2 and 3 are affected by uncertainties, these methods are very useful because a wide temperature and pressure range can be represented. For method 1, the mobile testing unit is connected to the geothermal power plant cycle, if possible, right before the inlet of the main heat exchanger. Otherwise, it is connected at the manifold between the geothermal well and the power plant cycle.
In situ measurements at five sites in two of the abovementioned hydrothermal key regions have already been performed (method 1). Each in situ campaign is followed by laboratory measurements on the fluid of the respective site (method 2). Laboratory test series with artificial fluids of one of the two key regions have also been completed (method 3). These artificial geothermal fluids consist of fully deionized water and up to six of the selected salts (NaCl, KCl, CaCl2, MgCl2, Na2SO4, CaSO4, and NaHCO3), which are mixed according to chemical analyses, and a hydrogeological characterization of the hydrothermal regions. If carbonates are used, CO2 is also added to obtain and retain the salt dissolved. The particular measurements are taken in 25 °C steps, starting at 25 °C and going up to 150 °C (six temperature levels per mixture), at the pressure level present in the corresponding region.134
Based on these comprehensive laboratory measurements, existing thermodynamic models can be validated and new models can be developed. The accuracy of the models and laboratory measurements can be improved by comparison with in situ measurements.
For the investigated temperature range (room temperature to a maximum of 170 °C), there is a weak positive correlation of cp with increasing temperature. Increasing salinity (0 to ≈110 g L−1) correlates with a decrease in cp of about 500 J kg−1 K−1. For ν, a logarithmic decline with temperature is observed, as well as a positive correlation between ν and salinity. With increasing temperature and decreasing salinity, the value of ρ decreases.
Overall, the effect of pressure seems to be negligible, whereas the influence of temperature follows the expected trends. At low salinity, the laboratory measurements of real geothermal fluids reflect in situ values, as well as the laboratory test series with artificial fluids. With significant salinity, the thermophysical fluid properties differ considerably from pure water values.
It is foreseen to perform in situ measurements at a minimum of seven other locations in Germany. In the laboratory, the systematic measurements of artificial geothermal fluids are ongoing.
All obtained results will be compared to standard analytical methods, as well as to other experimental results. In addition, the data will serve as a basis for new models.
Variable salinities of geothermal fluids in the hydrothermal key regions and the strong dependency of the thermophysical fluid properties on salinity reveal the need for a thorough evaluation for each specific site. This evaluation then allows tailoring of the power plant components to the particular fluid and thereby maximizing the power output.
With the established broad database of thermophysical fluid properties, it will be possible to significantly reduce uncertainties in geothermal modeling.
3.4.3 GeoKam as the proof of concept of the ZWERG framework
Translating EGS as engineered geothermal systems135 outlines the importance of engineering tools and methods for the interaction with deep boreholes. Today, geothermal wells can be accessed by drill strings with MWD (measuring while drilling) or LWD (logging while drilling) tools, as long as the drill rig is on-site. Afterwards, slickline or wireline tools may be used for downhole investigations. These efforts are very expensive and, in most cases, the devices employed are designed for oil and gas applications. This design is often not suited for geothermal applications, with respect to the geometry of the borehole and the ambient temperature and pressure parameters. Quality enhancement in the development and use of geothermal sites will reduce financial risks and will improve the conversation with the public and acceptance of the technology.
Wireline tools, for example, for long-term downhole tracer detection or a casing repair probe (Figure 35), have many common components.136 They need an uphole station with the wireline, wireline handling, and a control cabin, and many similar downhole solutions, for example, for the housing, heat management, and control of the probes. Many of the detailed solutions, such as seals, may vary only in diameter, or more generally in scalable parameters, but neither in the material nor in the fit tolerances. This implies the idea of designing a common platform, such as a kit of reusable items for the construction of geothermal borehole probes. ZWERG (which in English translates to “dwarf”) was designed as a framework for a secure and straightforward design of geothermal probes. Following the idea of systematic design postulated by Pahl and Beitz,137 the target is sorted into modules and primitive functions with well-defined interfaces (Figure 36). In this analysis process, different solutions are worked out and suggested. Most of the modules can be found in the ZWERG toolbox. This tremendously speeds up the synthesis of a new probe and it leads to better results because the modules have been tested previously under borehole conditions, such as temperature, pressure, and corrosion.
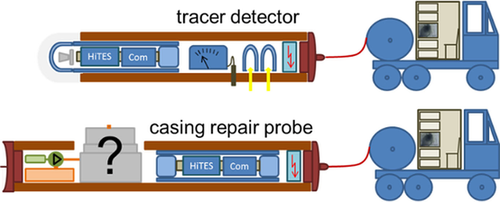
Two examples of novel borehole probes with many common “bricks” (HTES: high-temperature embedded system, Com: communication unit).
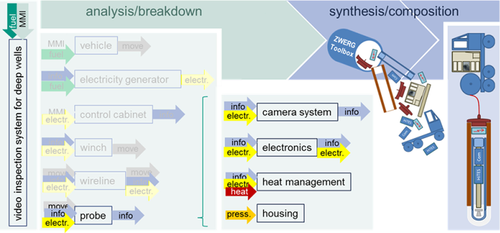
Systematic design analogous to that proposed by Pahl and Beitz:137 analysis and synthetic process with the use of the ZWERG toolbox.
The German Federal Ministry for Economic Affairs and Energy (BMWi) supported the initial usage of the toolbox through financing the GeoKam project (project number 0325580). GeoKam is a probe capable of inspecting hot wells with brine temperatures up to 165 °C in measured depths of up to 4000 m (Figure 37).138 Its live video stream, with more than 10 frames per second, allows a practice-oriented descent speed (≈1 m s−1) without the risk of damaging the probe by hitting unforeseen obstacles. This probe, with its protection shells against ambient pressure and the heat of the reservoir, is close to completion. All mechanical components will undergo tests under realistic conditions (165 °C and 48 MPa) in an autoclave.
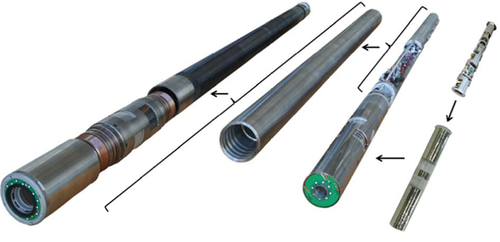
Components of the GeoKam video inspection probe (from left to right: housing, Dewar, interior with camera protection, electronics and heat management, and glass Dewar and camera unit).
3.4.4 Isothermal and isobaric water sampler
In situ samples of geothermal brine are a necessity for the investigation of thermal waters. Samples can be collected very easily at valves close to the wellhead. However, thermal water samples represent a mixture of water inflows into the well at different depths and at different times. Moreover, the chemical composition was affected by its contact with the casing wall, pump, different valves, and scaling and corrosion on top of those devices. Further disturbance might be caused by decreased sample temperature and pressure, which causes a loss of gases or precipitates. U-tube samplers may be interesting for screening a well over a longer period or in shallower wells. In deep boreholes, wireline tools are more flexible.
Several wireline probes for sampling borehole water from different companies exist.139 Very simple devices sample the fluid by opening an inlet valve of an evacuated sample chamber. Flow-through samplers trap a sample by closing inlet and outlet valves. These probes avoid temperature shock because the devices are permanently heated to the reservoir temperature. The disadvantage of this sampling strategy is that it may lead to contamination on surfaces and in dead volumes. To prevent early degassing, most of the so-called single-phase sampling probes use the positive displacement principle, in which a piston slowly opens up room for the probe (Figure 38). Usually, a preset timer starts the sampling by opening a valve. The rear of the piston is flooded by a displacement fluid. If the ambient pressure is high enough, this fluid is pressed into a gas vessel through a throttle valve to reduce the velocity of the piston. When the piston reaches the top of the cylinder, the inlet valve is closed and the valve of a second gas vessel is opened, where the sample is pressurized to a preset value. Moving out of the borehole, the probe usually passes colder water. The sample temperature and volume decrease. Gas pressurization can keep the pressure at a constant value. The transfer of water from the sampler to a transport container is a complex task due to high water pressure and requires special devices.140
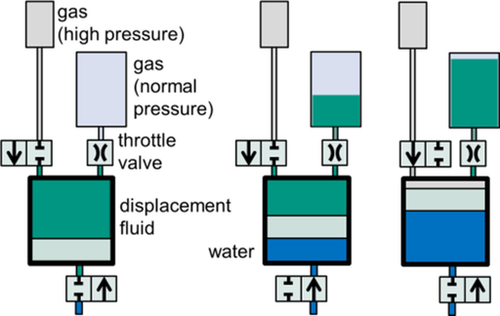
Positive displacement principle of fluid samplers.
KIT will provide a water-sampling probe based on the ZWERG platform (see the previous section). This probe will preserve the original values of pressure (isobaric) and temperature (isothermal) of the sample by heating the sample chamber. It will also use the positive displacement principle, but it will be able take samples at any place when sensors give hints of interesting values. It will be operated from an uphole control unit rather than by using a timer. A hydraulic double-piston cylinder will move the sample piston. This hydraulic system will be strong enough to drain the sample without support from other devices (Figure 39).

Principle of the KIT fluid sampler with a hydraulic double piston. The parameters p1 and p2 are the pressure levels of the fluid sample, and F is the fluid flow.
3.4.5 WellboreKit: A coupled dynamic thermo-hydrochemical wellbore model for two-phase multicomponent geothermal fluids
Fluid pressure and temperature enter into a variety of geothermal production–operation calculations, including well drilling and completion, stimulation, controlling mineral scaling, and analyzing pressure–transient test data. The availability of reliable downhole pressure data during hydraulic tests are of crucial importance for interpreting the behavior of the underground system. A high salt and noncondensable gas content in geothermal wellbores may lead to inaccurate pressure, temperature, and mineral SI calculations. However, due to the complexity of describing this effect, it is normally simplified in the modeling process.
WellboreKit is a model for calculating thermo-hydrochemical (THC) behavior during (de)pressurization of a two-phase multicomponent geothermal fluid in a deep wellbore. Sequential coupling is implemented between transport and (de)compression with a thermal load of a two-phase multicomponent geothermal fluid. The thermodynamic and transport properties for H2O–salt (NaCl, CaCl2, KCl, MgCl2, NaHCO3)–gas (CO2, N2, CH4, H2S) mixtures are calculated by using the fugacity–activity, three-region equation of state solver, GEOSKIT. The solver has been validated with experimental data from the literature and online field measurements by applying pressure, temperature, and ionic strength ranges of 0.5–50 MPa, 32–177 °C, and 0–8.1 mol kg (kgw: kilograms of water), respectively. Figure 40 shows good agreement of GEOSKIT and measurement data for the H2O–CO2–CH4 system, which confirms the reliability of the approach.
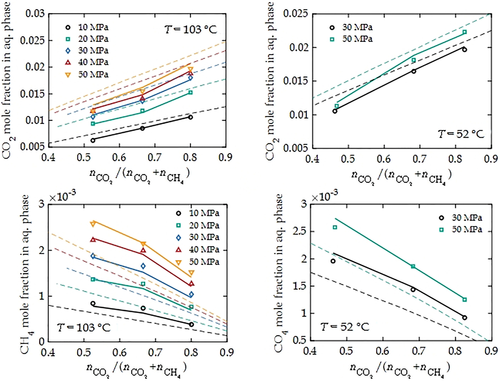
Aqueous molar fractions of CO2 and CH4 varying with CO2 molar fraction in a dry nonaqueous phase: Experimental data from Qin et al.144 (○: 10 MPa; □: 20 MPa; ◊: 30 MPa; ▵: 40 MPa; ▿: 50 MPa) are compared with calculated values from GEOSKIT (solid lines) and PHREEQC 3.2 results (dashed lines). The PHREEQC 3.2 results at 103 °C were adapted from Appelo et al.145
The fluid flow is described by a heterogeneous drift-flux model, which is solved by using the Elmer finite element method. An operator-splitting algorithm is applied to couple PHREEQC for calculating the chemical reaction, as depicted in Figure 41.
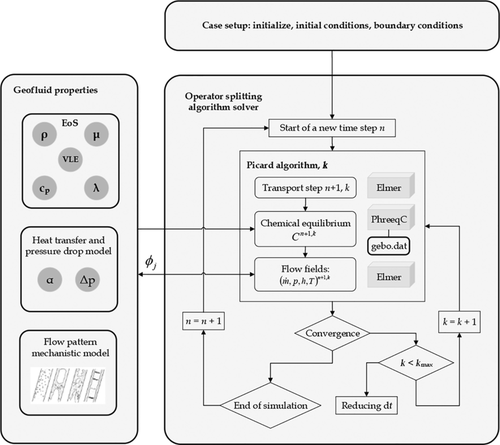
Flow chart for the WellboreKit calculation procedure: ρ=density, μ=chemical potential, VLE=vapor liquid equilibrium, Cp=specific heat capacity, λ, α=empirical parameters, p=pressure, φ=fugacity coefficient, T=temperature.
Once the boundary conditions have been set, for a specified time step, each solver step consists of the following major substeps:
-
Aqueous species transport is calculated in Elmer to obtain species concentrations at each cell along the well path. For definite salt and gas concentrations at each cell, chemical equilibrium is solved in PHREEQC to compute the SI of minerals, which is then used to determine mineral scaling and to calculate the dissolved salt concentration in the aqueous phase.
-
Thermodynamic properties, that is, aqueous (AQ) and nonaqueous (NA) enthalpy, hAQ and hNA, respectively; density, ρAQ and ρNA; viscosity, μAQ and μNA; thermal conductivity, λAQ and λNA; gas fugacity, φj; and quality, x, are determined by using the equation of state described previously as a function of pressure, p(z); enthalpy, h(z); salt, bi (z), and gas molality, bj (z); and gas molar fraction, yj (z).
-
Void fraction with constitutive relations, that is, heat transfer coefficient, α; wall shear,
 ; and hydrostatic pressure gradient,
  , are determined, based on the flow-pattern map and mechanistic flow model from Hasan and Kabir,143 which is used to calculate the effective two-phase thermodynamic properties.
 -
Geofluid heat and mass transfer, pressure drop, and species transport are solved in Elmer.
From the Elmer calculation, new pressure, temperature, species concentration, and gas fugacity fields are retrieved, which are sent to PHREEQC for the equilibrium at the next time step.
By using WellboreKit, it is expected to analyze individual two-phase, multicomponent well dynamics, such as the effects of casing and reservoir issues, predict the actual results measured after a flow test or workover due to downhole scaling.
4 Large-Scale Infrastructures
Research experience from recent years has shown the necessity to install technology-specific research platforms to perform systematic experiments under controlled framework conditions to benchmark numerical models and bridge the gap between laboratory- and field-scale experiments and applications. Two large-scale infrastructures are currently planned and under construction, respectively: the modular low-temperature cycle MoNiKa, which is installed at KIT, and the underground laboratory GeoLaB, which is in the planning and application phase.
Recent research on THMC coupling revealed the urgent necessity of developing strategies for scaling up coupled THMC models and the need for appropriate benchmarking. On-site in situ investigations of geothermal projects are mostly restricted to 1D and 2D data. The 3D experiments are presently mostly conducted in laboratories on a small scale. This especially concerns the establishment of fluid flow models to replace cubic law approaches. Moreover, the necessity for improved borehole stabilization techniques has become evident, which requires in situ experiments under ambient stress and THMC conditions. Research into material corrosion and mineral precipitation needs more experimental data directly obtained in situ.
The future reservoir simulator GeoLaB provides a platform to tackle such challenges related to scale dependence and in situ conditions, as well as 3D–4D approaches to benchmark current numerical models. It is, for example, possible to perform 3D sampling of fracture networks close to the reservoir scale and to investigate THMC processes in situ.
Numerical simulations of power plant processes revealed the potential of performance improvements of geothermal power plants under supercritical conditions. The large-scale infrastructure MoNiKa will now serve as a platform to couple experimental research with numerical models. This is the first step to improve contemporary techniques and processes and to bring new concepts to market maturity.
The design and operation of future large-scale infrastructures MoNiKa and GeoLaB go hand in hand with data from laboratory experiments and recent modeling. Both pillars of KIT research create a valuable synergy of data exchange, optimization, and innovation.
4.1 MoNiKa
Low-temperature heating between 100 and 200 °C can be used for power production through ORCs. To study the optimization possibilities of ORC processes, the test facility MoNiKa is being built at the KIT. It is designed as a small and compact power plant with a thermal power of 1000 kW. The modular structure enables the use and investigation of different components. The geothermal heat source is realized by means of a conventionally heated water cycle. Previous investigations revealed that supercritical cycles achieved a rise of the net power output up to 44 % compared with subcritical cycles with isopentane because they enabled better adaptation of the temperature profiles in the heat exchanger.129 Electricity production by using geothermal water at temperatures between 100 and 200 °C, such as those in central Europe (e.g., Germany, Switzerland, France), require binary power plant cycles.
In this case, geothermal fluid is pumped from rock layers deep within the earth, where heat is then transferred in a heat exchanger to a working fluid. Thermal energy is then converted into electricity through a low-temperature cycle. This thermodynamic cycle with an organic working fluid is referred to as ORC. The Rankine cycle is a conventional and proven technology known for many years.
The new supercritical ORC MoNiKa is one such system that can improve the total efficiency of the power plant process. In previous studies, Vetter et al. have shown that significant performance improvements are possible under supercritical live steam conditions.129, 144 Figure 42 shows the plant layout of supercritical ORC with propane. The test power plant is currently under construction at KIT.
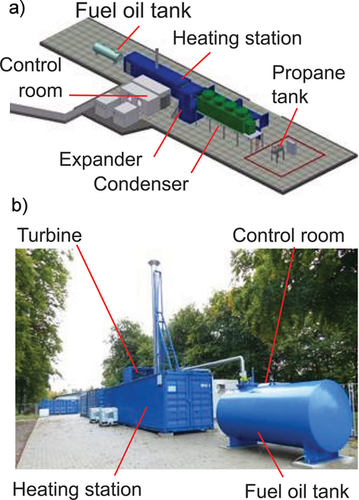
Schematic illustration (a) and photograph (b) of the plant layout of MoNiKa.
This test plant will be able to provide a unique insight into low-temperature power generation, through its mobile nature and interchangeable components with broad operating ranges, and will be used for further study and validation of continuing work at KIT.
To be more flexible in operation, geothermal water is produced in a local heating station, which extends the range of application and suitable components. Furthermore, the instrumentation of MoNiKa allows the energy and mass flow of the cycle to be balanced with higher accuracy than that of existing power plants. Table 3 shows the projected data of the power plant.
Property |
Propane |
|---|---|
ORC flow rate |
2.9 kg s−1 |
ORC pressure |
5.5 MPa |
steam temperature |
117 °C |
net power output |
101.5 kW |
pump power usage |
37.57 kW |
The main objectives for the further investigations are 1) improvement of the net power output by increasing component efficiency and reducing auxiliary power consumption; 2) characterization and optimization of the main components (heat exchanger, pump, turbine, condenser); 3) comparison of different circuits and processes, for example, combined heat and power production; 4) supply of site-independent cycle data for simulation and model development (benchmarking); 5) power plant operation at KIT Campus Nord and at other sites (mobility); and 6) variation of heat source temperature and mass flow.
The goal with MoNiKa is to install a standalone test facility for low- to mid-temperature range waste-heat recovery. This plant allows for testing in the range of existing plant operation with new components to increase confidence in using this new technology.
4.2 Geothermal underground laboratory (GeoLaB)
The geothermal underground research infrastructure project GeoLaB is designed as the first geothermal reservoir simulator for reservoir technology and borehole safety. Real-scale experiments and cutting-edge research in crystalline rock next to thermal hotspots will boost geothermal power as renewable energy source.
In Central Europe, the largest geothermal potential resides in the crystalline basement rock with important hotspots in tectonically stressed areas. To better harvest this energy form under sustainable, predictable, and efficient conditions, new focused and scientifically driven strategies are needed. The processes for environmental sustainability in the subsurface need to be investigated in large-scale facilities.
The proposed new underground research laboratory GeoLaB will address the fundamental challenges of reservoir technology and borehole safety. The specific objectives of GeoLaB are to perform CHFEs in fractured rock for the following reasons: 1) to integrate multidisciplinary research to solve key questions related to flow regime under high flow rates, 2) to increase efficiency in reservoir engineering, 3) for risk mitigation by developing and calibrating smart stimulation technologies without creating seismic hazards, and 4) to develop safe and efficient borehole installations by using innovative monitoring concepts.
Planned experiments will significantly contribute to our understanding of processes associated with increased flow rates in crystalline rock. The application and development of cutting-edge tools for monitoring and analysis will yield fundamental findings that are of major importance for safe and ecologically sustainable usage of geothermal energy and further subsurface resources. As an interdisciplinary and international research platform, GeoLaB will work in cooperation with research funding institutions, universities, industrial partners, and professional organizations to foster synergies and technological and scientific innovations.
GeoLaB is designed as a generic underground research laboratory in the crystalline rock adjacent to the Rhine Graben, which is one of the most prominent geothermal hotspots in Germany. The conduction of CHFEs in fractured crystalline rock requires specific technical criteria to be defined to highlight clear differences from nuclear waste laboratories. These are as follows:
-
Low complexity of geology in terms of lithology changes in favor of a rather homogenous crystalline matrix. Fluid injection into highly permeable zones, such as faults or interconnected permeable natural fractures, will keep fluid pressure low. Thus, large-scale fracking will be prevented. Ambient hydraulic transmissivities in the order of 10−4 m s−1, similar to those of the Soultz reservoir are anticipated.7
-
The hydraulic boundary conditions should represent ambient situations at far field without infiltrating into artificial structures. As such, a “flooding” of other galleries would yield a safety issue, but also would harm the complete experimental results due to artificially imposed boundary conditions. Because extensive drainage may occur in old mining areas, minimum distances must be respected.
-
Injection into favorably oriented fractures for reactivation in the ambient stress field is an intrinsic prerequisite of a geothermal URL, implying differential stress magnitudes above approximately 3–5 MPa, depending on the local stress field. Topography-induced perturbations to the stress field should be minimized with maximum variations of 1 MPa being tolerated.
-
Clay minerals are known to reduce the mechanical/frictional strength of fractures, that is, the pressure required to cause shearing during hydraulic stimulation.145 Hydrothermal alteration products in the matrix and on the faults should cover the illite to smectite range.
GeoLaB is representative of the world's most widespread geothermal reservoir rock, the crystalline basement. The first-order suitability of a site for GeoLaB located in the Black Forest or the Odenwald is proven.17
At the selected site, a 1 km long gallery will be excavated, tapping individual caverns, from which CHFEs will be conducted at depths of about 400 m. The experiments will be continuously monitored from multiple wells that are drilled from the underground laboratory or from the surface. This will create a unique 4D benchmark dataset of THMC parameters. The experimental infrastructure GeoLaB is planned as a unique global facility to specifically address the main challenges of EGSs (Figure 43), which are as follows:
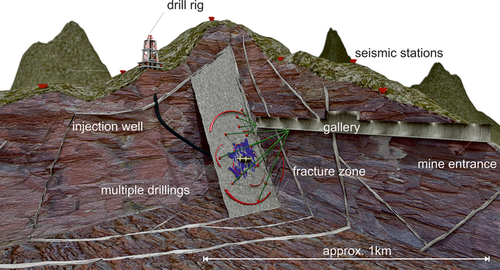
Possible layout of GeoLaB (not to scale) with an access tunnel to a fracture zone and observation wells (green) from the tunnel into the fracture zone. In addition to the monitoring stations (red cones), the main injection well (black) for CHFE targets the fracture zones. Possible CHFE with a high flow rate injection from the surface into a fracture zone (blue volume) and related mechanical deformation are indicated by red ring segments.
-
High-flow experiments to better understand fluid flow in fractured media; this will enhance the predictability of geothermal reservoir and lead to better modeling.
-
Development and testing of smart stimulation technologies; this will lead to higher flow rates with reduced impact for the public.
-
Real-scale experiments for innovative well integrity schemes; this will double security, while reducing costs by a factor of two.
Hence, GeoLaB shall become a cornerstone for the target-oriented development of vast geothermal resources.
With its unique global geothermal laboratory setting, GeoLaB allows for cutting-edge research, associating fundamental to applied research for reservoir technology and borehole safety, bridging laboratory- and field-scale experiments, and connecting renewable energy research to social perceptions. GeoLaB comprises a novel approach that will shape research in earth science for the next generations of students and scientists.
5 Summary and Outlook
The energy transition towards an economically efficient, as well as ecologically and socially sustainable, energy supply is one of the greatest challenges for our society. Geothermal energy is considered to be an important element of the future energy portfolio that is complementary to fluctuating energy sources. Bringing EGS technology to market maturity and a socially accepted application is a key element for a secure geothermal energy supply for power and heat provision with a significant market share.
Researchers from seven institutes of KIT—comprising geosciences, geophysics, materials science, engineering, geochemistry and numerics—form a multidisciplinary team to provide solutions to topical requirements of EGS development. KIT covers a broad bandwidth of both fundamental and applied research approaches, which are brought together in the four interacting clusters reservoir characterization and engineering, thermal water circuit, materials and geoprocesses, and power plant operation.
Research on multiphase flow and THMC processes over various scales is a common focus. A number of achieved milestones are already contributing to a better understanding of processes inside the reservoir and surface installations of geothermal power plants. The development of technical tools is pursued from product conception to patent application. In the last decade, KIT has evolved as one of the leading institutions in Germany for developing new models, techniques, and tools for geothermal research and development.
Exploration and imaging techniques, such as MTs and seismic networks, are applied to various geological settings, including both low- and high-enthalpy regions of geothermal prospect areas, as well as existing geothermal sites. Such techniques are essential in reducing the exploration risks for geothermal projects and for lowering their environmental impact, for example, by minimizing the seismic risk.
The scientific involvement in numerous industrial geothermal projects allows for establishing new tools to identify parameters relevant for the safe and economic use of heat from the subsurface. As such, the significant role of hydrothermal alteration for reservoir mechanics has been demonstrated with a new tool by using borehole logging data. Complementary to on-site databases, real-scale experiments are conducted at KIT, the output of which allow the development of guidelines and strategies for optimized reservoir engineering with respect to well integrity and the dismantling of abandoned projects.
A strong pillar of geothermal research at KIT is the coupled numerical modeling of THMC processes. Numerical models are developed to simulate multiscale flow-through fractures, crystallization processes in and sealing of fractures, and borehole failure for updating and expanding existing models.
A further field of expertise evolved at KIT in the experimental analysis of geochemical processes. Current research focuses on the development of new geothermometer techniques, which tend to be more reliable than previous practices. Corrosion and scaling experiments have already contributed to an optimized material selection for power plant parts and for a more efficient power plant operation.
The simulation and experimental analysis of power plant operation strategies and the design of parts bring mutual benefits. Through a combination with wellbore simulator tools based on equations of state, the whole system of the thermal water circuit in the subsurface and power plant on the surface can be optimized.
Novel borehole measuring tools developed at KIT make a major contribution towards economically efficient data logging; thus facilitating the acquisition of more downhole data urgently needed for better reservoir characterization.
Future research at KIT will strongly develop THMC experiments and numerical modeling. The focus will be on flow in fractured media and related processes. The goal is to develop new numerical models and simulations based on experimental results that are universally applicable to geotechnologies, also beyond geothermal energy harvesting. In this context, a central task will be the development of strategies for scaling up and down towards transferability from the nanoscale to the field scale and vice versa.
Great potential is seen in EGSs for heating purposes and power–heat coupling. Although the share of geothermal electricity production in Germany is around 38 MW today, the share of thermal power is already 2400 MW (for deep geothermal projects146). It is assumed that geothermal heat production can cover up to 30 % of the heat demand in Germany. Hence, heat generation from geothermal resources will be another focus of research at KIT.
With the large-scale infrastructures GeoLaB and MoNiKa, KIT and its partners are breaking new ground to encounter the lack of technology-specific experimental platforms and benchmark data sets for geothermal applications. With their installation, they create new perspectives to develop EGS as a future technology. Already at an early stage of preparation and establishment, these infrastructures have attracted interest from international institutions and companies and proved their potential to bundle synergies and boost geothermal research and development. GeoLaB, as the first generic geothermal reservoir simulator, is expected to influence future geoscientific research directions in Germany and Europe, also beyond geothermally specific research.
The construction of GeoLaB will, moreover, offer the unique possibility to sociologically accompany a major geoscientific project. When gradually replacing conventional energy forms, renewable energies have to be integrated into the power supply system. Hence, successful implementation requires certain societal conditions, such as individual lifestyle or consumption patterns. Geothermal energy, as a backup energy for the future energy mix has suffered from project failures in the recent past. In particular, EGS technology has been disparaged as uncontrollable technology because the geothermal community was unable to communicate significant progress that has been achieved in recent years. On the contrary, incidents, such as sensible earthquakes, produced during stimulation or circulation can confuse and frighten people in neighboring municipalities. Institutions and companies more and more realize that the local population are an important building block for the realization of a project.
The LFZG, the Landesforschungszentrum Geothermie, with its head office at the Institute of Applied Geosciences at KIT, offers further means to form a vivid connection to the public and political stakeholders. Ten research institutions at different locations within Baden–Wuerttemberg contribute their expertise and organize their geothermal research through LFZG as an independent institution of the State of Baden–Wuerttemberg installed by the Ministry of the Environment, Climate Protection, and the Energy Sector and the Ministry of Science, Research, and the Arts. The LFZG aims to promote geothermal research, education, and technology development in an interdisciplinary matter and it strives to offer objective and neutral information.
The comprehensive challenges of EGS research have revealed the necessity for a concerted approach to bring EGS technology towards market maturity. Through a combination of fundamental and applied research and the close collaboration between different disciplines, the research university KIT has evolved as one of the leading universities for geothermal research in Germany. Synergy effects established within the various departments of KIT involved, ranging from applied geosciences to computational materials science; the close cooperation with industrial partners; and strong partnerships with research institutes in Germany and worldwide are considered to be major strengths of KIT geothermal research and are building blocks for the development of international significance of geothermal research and education. Present and future collaboration with renowned national and international organizations, such as BVG (German Geothermal Association), EERA JPGE (European Energy Research Alliance Joint Program on Geothermal Energy), and EGEC (European Geothermal Energy Council) will contribute to an extension of the already established worldwide research network. Joint target-oriented events will be organized by following the example of the already established European Geothermal Workshop, which evolved from the strong collaboration with the EOST (École et Observatoire des Sciences de la Terre) at the University of Strasbourg. Embedding into the national research program of the Helmholtz Association and the interlocking of research between the Helmholtz partners GFZ and UFZ harbors enormous potential for synergies and bundles the competence of leading institutions.
The thermal energy present underground is enormous. Through the efficient and safe exploitation of this resource, geothermal energy can assume an important role in the future energy balance of various countries. In the last few years, geotechnical engineering has expanded its presence in the energy sector. The development of sustainable and combined usage of underground energy results in new challenges associated with recovery and characterization of existing and new energy resources, utilization of heat-exchange processes in civil engineering infrastructure, storage of energy in the subsurface in different forms, and the containment of carbon and nuclear waste in engineered systems. Competing and combined underground utilization requires profound research strategies to understand and predict the behavior of rocks under complex and extreme conditions, involving coupled thermal, hydraulic, mechanical, and geochemical processes, and the development of analytical tools and constitutive models capable of considering the range of phenomena encountered in the subsurface. The development of the EGS technology makes a vital contribution to this process.
Acknowledgements
This work has received partial funding from the Federal Ministry of Economics and Technology (BMWi) under the joint KIT-INE, GRS research project “KOLLORADO-e” (02E11203B) and the European 7th Framework Programme (FP7/2007–2011) under grant agreement no. 295487 (BELBaR Project). We thank the German Federal Ministry for Economic Affairs and Energy (BMWi) for funding the GeoKam project (project number 0325580). In situ measurements of degassing and scaling in geothermal power plants has been funded by the Federal Ministry Economic Affairs and Energy in the project “Scaling und Ausgasung in Geothermieanlagen—Einflussfaktoren, Kinetik, Inhibitoren und technische Maßnahmen” (FKZ: 0325160A). Special thanks to the Geothermie Unterhaching GmbH & Co KG and especially Wolfgang Geisinger for on-site access to the geothermal power plant Unterhaching, Munich. The work “Influencing parameters on the precipitation of BaSO4 from geothermal brines” has been supported by the Federal Ministry for Economic Affairs and Energy based on a declaration by the German Bundestag. Support from EnBW Energie Baden-Württemberg AG is gratefully acknowledged. Part of the research was conducted in the Topic “Geothermal Energy Systems” under the Program “Renewable Energies” within the Program Oriented Funding of the Helmholtz Association of German Research Centers.
Biographical Information
Carola Meller obtained her Diploma in Geology from the University of Tuebingen in 2010. In 2014, she finished her Ph.D. in the Geothermal Research Group at the Karlsruhe Institute of Technology with distinction. Her Ph.D. topic aimed at the identification and geomechanical characterization of hydrothermal alteration zones in geothermal reservoirs. In 2016, she obtained the ARCADIS prize for geo and environmental research. Her current research focus is on the influence of hydrothermal alteration on hydromechanical processes.


