Segmentation Studies on Al-Si-Mg Metallographic Images Using Various Different Deep Learning Algorithms and Loss Functions
Funding: The authors received no specific funding for this work.
The overall schematic diagram showing the comparison among various deep learning models for metallographic images.
ABSTRACT
Segmenting metallographic pictures is being done in material science and related domains in order to detect the features within them. Therefore, it becomes crucial to find grains and secondary phase particles. It is necessary to label every pixel in order to obtain satisfactory segmentation outcomes. However, labeling takes a lot of time and is physically taxing. Therefore, in order to obtain higher performance, we have suggested a semi-supervised deep learning technique in the current study that uses fewer labeled images. Other deep learning algorithms, such as Segnet, Resnet, and FCN, were compared with the Unet approach that was suggested. Additional comparisons have been made using the Dice score (0.85), IOU score (0.74), F1 (0.85), and recall (0.96) measures. Different loss functions were also compared, including binary, SS loss, and Tversky. Furthermore, the dataset was expanded, and these datasets were also subjected to result analysis. The trials show that, both numerically and qualitatively, the suggested approach can produce superior outcomes with fewer labeled photos.
1 Introduction
Metallography is a science that studies the structure of alloy materials and reveals critical microstructure information. These microstructures are frequently observed and measured manually by researchers. Convolutional neural network (CNN) models have the potential to improve accuracy. Computer vision is being used in the materials domain, according to recent reports [1-3]. The use of machine learning to recognize microstructures has been documented in the literature. The distribution, shape, and size of the microstructures have a significant impact on the characteristics of aluminium alloy. As a result, proper segmentation of these microstructures is essential. Complex microstructure segmentation, on the other hand, is challenging and usually requires material scientists to manually divide microstructures into discrete pieces. This procedure is frequently slow, labor-intensive, and inconsistent. The metal micrograph is a digital image captured through a microscope that contains rich microstructure details and serves as a vital tool for metal microstructure investigation. Microstructure analysis is usually done by hand by specialists, but due to the subjectivity of humans, there will be uncertainties. Various intelligent picture analysis approaches have arisen in recent years as a result of advancements in computer technology, enabling new methods for microstructure analysis. As a result, various attempts have been made to classify and characterize microstructures using machine learning techniques and related technology, with the goal of enhancing microstructure analysis accuracy and efficiency compared to previous methods. Due to their excellent ability to learn discriminable features [4], deep learning has dramatically enhanced machine learning and achieved amazing results in picture segmentation [5, 6]. More and more deep learning metallographic segmentation algorithms have been presented in recent years [7, 8].
Machine learning metallographic segmentation methods convert the segmentation challenge into a classification task and learn classifiers from a set of features and labels, removing the issue caused by image processing methods. Support vector machine (SVM) [9], multilayer perceptron [10], neural network [11] and optimum-path forest are some of the most often used classifiers in machine learning approaches.
Due to their excellent ability to learn discriminable features, deep learning has dramatically enhanced machine learning and achieved amazing results in picture segmentation [1, 4]. More and more deep learning metallographic segmentation algorithms have been presented in recent years [5, 7]. Although these metallographic image segmentation methods have shown to be effective, model learning often necessitates a significant number of pixel-level labeled pictures. This pixel-level classification activity frequently necessitates the time and effort of experts. Existing deep learning metallographic segmentation approaches face significant hurdles as a result of this circumstance. Such a problem configuration falls within the category of semi-supervised learning in machine learning.
Semantic segmentation is a common problem in computer vision, and it's being used in a variety of applications such as self-driving cars and virtual reality. For microstructure segmentation, traditional segmentation methods such as thresholding or the watershed algorithm are not as precise. Convolutional neural networks (CNN) are frequently utilized in image processing and analysis, such as picture segmentation and detection. As a result, they've become the cutting-edge method for working with photos. Convolutional, activation, and pooling layers make up the majority of CNN architecture. The layers are placed one on top of the other in a pattern that repeats.
Advanced CNN models take care of the work of finding features and associating them to the desired output variable automatically. Manual interaction is not required to quantify any features, removing a key source of bias. It can be extremely useful in cases involving complex microstructure aspects.
Qui et al. [12] using tailored approaches and machine learning techniques, the microstructures of Al-Si-Mg casting alloy were classified at varied cooling rates. The mechanical characteristics of the samples improved slightly as cooling rates were increased. Because of the identical cooling speeds, the microstructures of the samples were similar. The program was used in conjunction with user-modified machine learning algorithms to get high categorization rates of around 80% to 90%. The effect of the number of photos in training data on classification rates was investigated, and an appropriate number of images for training in the machine learning process was discovered.
The authors [13] suggest a hierarchical parameter transfer learning approach for automatic microstructure segmentation in aluminium alloy micrographs, which is a generalization of the traditional parameter transfer method. Multilayer structure, multinetwork structure, and retraining technology are used in the suggested method. It can take full advantage of the benefits of various networks and transfer network parameters in order of high to low transferability. A number of experiments are presented to demonstrate the efficacy of the proposed strategy. The solution outperforms four common segmentation methods with a segmentation accuracy of 98.88%.
A new metallographic picture instance segmentation framework was developed, which can attribute each pixel to a physical instance of a microstructure. The author [14] employed Mask R-CNN as the basic network in this framework to complete the learning and recognition of an aluminium alloy microstructure's latent feature. Pixel-level labeling is labor-intensive and time-consuming, which presented substantial obstacles for previous metallographic image segmentation studies. The absence of effective techniques that could accomplish high-quality segmentation with a small amount of labeled data was the main research gap. This prompted the creation of a semi-supervised deep learning methodology with an emphasis on Al-Si-Mg alloys. Exploring different deep learning architectures and loss functions to find the best solution that could function well with little labeled data was justified by the need for automated, accurate feature detection in metallographic images as well as the practical limitations of obtaining labeled datasets.
- Implemented UNet in TensorFlow, with a focus on the model architecture without dropout layers.
- Leveraged UNet's strengths in learning from limited data and preserving spatial information through skip connections.
- Employed data augmentation via rotation, flipping, and other techniques to expand the training dataset and mitigate overfitting.
- Experimented with various loss functions, optimizing the learning rate and training for 100 epochs.
- Identified UNet as the top-performing model, with improved prediction quality compared to SegNet and FCN, especially when using the augmented dataset.
1.1 Related Works
Some of the works related to the segmentation of microstructure images using deep learning models and vision-based transformer models are discussed below.
The authors [20] suggest a semi-supervised segmentation (SSS) approach for metallographic pictures of aluminium alloys based on this framework. The U-Net serves as the fundamental segmentation model in this SSS approach. Here, a self-paced semi-supervised segmentation (SP-SSS) method mitigates the interference from mislabeled images. Furthermore, the work puts into practice the remaining four enhanced SSS techniques, which are predicated on various combinations of pseudo-label selection algorithms and loss functions. The work utilizes the aluminium alloy metallographic image dataset (AAMI) to compare the enhanced SSS approach with the supervised segmentation (SS) method in order to assess the suggested semi-supervised learning framework. According to the experiments, the SSS method works better than the SS method and can obtain satisfactory results with a limited amount of labeled images.
Using image processing for quantitative analysis is a crucial step in learning more about the microstructure of materials. In this work [21], Al–La alloy is used to tackle the problem of image segmentation for microscopic pictures by developing a deep learning-based approach. Three major contributions are made in this work. (1) To accomplish picture segmentation, the authors train a deep convolutional neural network based on DeepLab, with notable outcomes. (2) To examine the microscopic pictures with high resolution, a local processing method based on the symmetric overlap-tile strategy has been utilized. It also accomplishes smooth segmentation. (3) To improve the accuracy of outcomes using 3D information, symmetric rectification is carried out. According to experimental results, our approach works better than current segmentation techniques.
This work [22] proposes an enhanced U-Net model that uses a limited training set to automatically segment complex metallographic pictures. Experiments on metallographic images demonstrate the method's considerable benefits, particularly for metallographic images with complicated structures, fuzzy boundaries, and low contrast. The enhanced U-Net outperformed other deep learning techniques in terms of ACC, MIoU, Precision, and F1 indexes; its ACC score was 0.97, MIoU was 0.752, Precision was 0.98, and F1 was 0.96. A suitable result was obtained by calculating the grain size based on the segmentation in accordance with the American Society for Testing Materials (ASTM) standards.
Due to the remarkable performance of transformer models in natural language processing, deep neural network architectures based on vision transformers (ViT) have recently drawn interest in the field of computer vision research. Therefore, the ability of a group of common ViT models to diagnose brain cancers from T1-weighted (T1w) magnetic resonance imaging (MRI) is examined in this work [18]. For the classification challenge, pre-trained and optimized ViT models (B/16, B/32, L/16, and L/32) on ImageNet were used. With an overall test accuracy of 98.2% at 384 × 384 resolution, L/32 was the best individual model. At the same resolution, the four ViT models' combined testing accuracy of 98.7% outperformed the capabilities of each model alone at both resolutions and when assembled at 224 × 224 resolution.
For the purpose of recognizing traffic signs, camera-based computer vision approaches have been presented, and several convolutional neural network designs are employed and verified using numerous publicly available datasets. The objective in this study [23] is to find out if the traffic sign recognition field can match Vision Transformers' success. At the first stage, extract and contribute three open traffic sign classification datasets from the available resources. Then test five Vision Transformers and seven convolutional neural networks using these datasets. For the traffic sign categorization job, it was found that Transformers were less competitive than convolutional neural networks. In particular, the German, Indian, and Chinese traffic sign datasets exhibit performance disparities of up to 12.81%, 2.01%, and 4.37%, respectively. Few other segmentation works by [24, 25] are also noteworthy contributions in this area of interest.
2 Experimental Procedure
The features of interest can be predicted using deep learning techniques from the micrographs in this section. Various deep learning methods have been used for analysis, while image segmentation in this case was handled by image labeler software. This method transforms each image into a tagged image by giving each pixel a label that describes the attributes of the pixels inside it. The first step in the classification process is feature extraction. The process of feature extraction involves finding the interesting regions of the micrograph, such as certain phases, flaws, and so forth. The feature vectors of tagged images, which can be utilized for training and testing purposes, include digital information about the image. The characteristics of interest are the white α-Al grains, ignoring porosity and secondary phases (black) from the micrograph.
2.1 Dataset
The micrographs of the extruded Al-Si-Mg alloys served as the image datasets. The collection consists of 80 photos with a 1280 by 960-pixel resolution. Using the image labeler toolbox in the Matlab software, masked images have been created. The new image was 500 by 500 pixels in size. Additionally, by rotating, flipping, and sliding sampling, the initial training set is increased to 864 photos.
2.2 Microstructural Characterization
The samples were sliced across the cross-section from the powder compacted ingots for the purpose of characterizing the microstructures of these samples. To remove the surface scratches, the specimens were first ground using 400–2000 grit SiC abrasive paper, and then carefully polished with 3–1 μm diamond suspension into a flat mirror surface. In order to prepare for the subsequent treatment, hundreds of microstructure images of each sample will be taken using a 400× magnification optical microscope in the center of the observation surface.
2.3 Proposed Method—U-Net
The proposed method, U-Net [7] is a semantic segmentation deep learning model originally implemented on Caffe, to solve biological segmentation problems. The U-Net has already competed in the ISBI cell tracking challenge 2015 and won it by a large margin. The biological domain is known for scarcity in data annotation due to experts' time and availability. In biological segmentation, the problem of data annotation is rampant, and the U-Net is designed exactly to learn from limited data. Also, due to the unavailability of much data in the area of microstructure imaging, U-Net proves to be a successful candidate. In this work, U-Net is implemented in tensorflow with the model architecture (without dropout layers) as described in Figure 1. The U-Net is a U-shaped architecture that has a contracting path and the expanding path, connected with skip connections between corresponding layers. The U-Net is a convolutional neural network (CNN) based architecture that extracts features from images automatically through backpropagation. But the CNN uses max pooling that reduces the parameter size; however, with it, we lose local miniature information also. So, to localize the feature maps in the upconvolutions in the expanding path, skip connections are deployed from the corresponding feature maps from the contracting path, and those feature maps are concatenated at the expanding path.
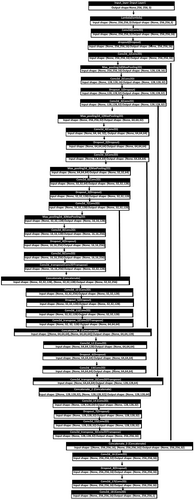
The contracting path consists of an input layer that takes input of size (256 × 256) followed by a lambda layer to scale the pixel values from 0–255 to 0–1, then there are convolution layers with 3 × 3 kernels and relu activation; they are followed by max pooling layers with 2 × 2 kernels, and finally, before max pooling, there are skip connections concatenating the local information from the contracting path to the expanding path. There is a gradual growth of the number of feature maps by a factor of 2 in the contracting path and a reduction of the same by the same factor in the expanding path. The minimum resolution input for the network should be 32 × 32. Padded convolution is used to avoid losing edge information. From the final convolution in the expanding path, the feature maps are fed into a 1 × 1 convolution with a single filter and a sigmoid activation, resulting in an input-sized output of 1 channel with probability scores indicating 1 for the structure and 0 for the background. In the network, dropout layers are employed to reduce the overfitting problem; however, to reduce image size is not shown in the figure. Wherever there is less volume of data, deep learning models tend to overfit the data, causing them to fail to generalize to unseen samples. The data augmentation using rotation of samples and their corresponding ground truth is done to further increase available data and reduce the overfitting problem.
The model used the Adam optimizer, and experiments were conducted with various loss functions; the learning rate was fine-tuned to 0.0005 and ran for 100 epochs. The best weights based on the validation accuracy were saved and later used for inference.
- Attention Mechanisms: Unlike the normal U-Net, the figure displays several attention-based modules (such as CoordAtt and Cross2D) embedded throughout the network. These attention processes probably enhance feature representation by assisting the network in concentrating on pertinent spatial aspects.
- Complex Skip Connections: This modified version of U-Net uses more complex skip connection patterns with additional processing blocks, whereas the regular version uses simple skip connections between the encoder and decoder. This implies improved feature improvement across the information flow.
- Multi-Scale Feature Processing: In contrast to the conventional U-Net, the architecture seems to contain more branches and processing paths, suggesting more thorough multi-scale feature extraction and processing.
- Dense Block Integration: The existence of numerous parallel paths and dense-like connections points to DenseNet topologies as an inspiration, which is not part of UNet design.
While preserving the core encoder-decoder architecture of U-Net, these changes most likely seek to increase the network's feature extraction capabilities and performance on challenging segmentation tasks. One notable example of a contemporary architectural enhancement that might aid in concentrating on pertinent aspects of the input data is the attention mechanism.
2.4 SegNet
The encoder-decoder segmentation model SegNet [5] produces pixelwise classification of images. The encoder architecture is derived from the VGG16 network. The final classification layers of the VGG16 are discarded, and only the feature extraction part is employed in SegNet. The encoder has a total of 13 convolutional layers and can use the transfer learning weights of Imagenet-trained VGG16. The removal of the final classification layer dramatically reduces the parameter size (from 134million to 14.7million) of the whole model, resulting in accelerated training and inference. Each encoder layer has a corresponding decoder layer, and therefore there are 13 layers in the decoder. Finally, the output of the decoder is fed into a multiclass softmax classifier to pixel-wise classify the input into segmentation labels. Each encoder layer does convolution, with batch normalized outputs, an element-wise ReLU, and max-pooling of a 2 × 2 window, and a non-overlapping stride of 2 to reduce the featuremap size. This results in a large input image context; however, boundary information is lost in the process. The boundary delineation is vital for segmentation tasks, and so it needs to be captured for effective segmentation. The Unet model captures boundary information by transferring encoder feature maps to corresponding decoder layers, with an associated cost of memory overhead with skip connections. Whereas, in SegNet, it is done by storing max-pooling indices with much lesser memory cost. The max-pooling indices stored in encoder layers are used in the upsampling process at the corresponding decoder layers. This upsampling results in sparse feature maps that are later convolved to produce dense feature maps. This results in better boundary delineation in segmentation tasks with a low memory footprint.
2.5 ResUNet++
ResUNet++ [26] is an advancement over the ResUNet model. It leverages the advantages of residual learning, Squeeze and Excitation(SE) blocks, Atrous Spatial Pyramidal Pooling(ASPP) and the attention mechanism. The basic structure of the ResUNet++ network backbone resembles the Unet architecture that has a U-shaped encoder-decoder with a skip connection between corresponding layers. Each residual unit in the ResUNet++ consists of a 3 × 3 2D-Convolution layer, a Batch Normalization layer with ReLU activation, followed by a 3 × 3 2D-Convolution layer and a skip connection from the previous layer output. There are SE blocks embedded between the residual units of the encoder part, whereas Attention layers are in front of the decoder residual units. Moreover, there is an Upsampling layer after each Attention layer in the decoder, followed by the concatenation of feature maps from skip connections from the encoder part. Further, there is an ASPP layer that acts as a bridge between the encoder and decoder parts, and another ASPP layer before the final 1 × 1 2D-Convolution with activation that classifies input pixel-wise. The ASPP layers ensure the network architecture remains common to variations in input image size by pooling to the same dimension before Attention and the final 1 × 1 2D-Convolution layers at the beginning and end of the decoder part. The ResUNet++ has proven to be very useful in medical segmentation where the available annotated data is less.
2.6 FCN
Fully convolutional networks (FCN) [6] are complete covnets with no dense layers. They take an image of hxwxd dimensions with height h, width w, and channels d and produce an output of hxwxc dimensions with height h, width w, and classes c. The FCN is an end-to-end deep learning pipeline for segmentation tasks. It does pixel-wise classification of an image to produce segmentation output. The FCN used in our work is FCN-VGG16, which uses the VGG16-net backbone as the downsampling part. It also reuses the Imagenet weights learned by VGG16 along with the upsampling counterpart. There are three variants of FCN by the upsampling mechanism, namely FCN-32, FCN-16, and FCN-8. The VGG-16 part downsamples the image 32× through successive 5 2 × 2 max pooling with non-overlapping strides 2. The FCN-32 variant upsamples the 32× downsampled image 32× times, whereas FCN-16 adds the output of the 2× upsampled prediction with pool4 prediction from the VGG16 and upsamples it further by 16×. However, FCN-8 goes a step ahead by summing the 16x upsampled output with pool3 prediction from the VGG16 and upsamples the additive result by 8×, resulting in the final prediction. With the pixel-wise classification labels of any image dataset, FCN can be trained end-to-end in an effective manner. The segmentation output of FCN is coarser with FCN-32 and finer with FCN-8, indicating that the loss of boundary delineation by max pooling is mitigated by the skip connections and the addition of early layer features with the upsampling layer features. FCN models form the successful early fully covnets applied to image segmentation with end-to-end learning.
3 Results and Discussion
3.1 Performance Analysis
3.1.1 Quantitative Performance Analysis
Our focus is to measure the performance of the various deep learning algorithms on the microstructure images. The evaluation metrics involving Dice score, IOU score, Precision, Recall, F1, Specificity, and Accuracy are shown in Table 1 for different models using binary loss function. Dice score and IOU score have more or less remained constant for UNet, SegNet, and ResUNet++, whereas for the FCN model there seems to be a fall in the value. Since the model is very simple, it was not able to predict the features as well as the other UNet models. Recall values were higher compared with other models, while specificity offered the least values for all models.
| Metrics | |||||||
|---|---|---|---|---|---|---|---|
| Method | Dice | IOU | Precision | Recall | F1 | Specificity | Accuracy |
| UNet | 0.85 | 0.74 | 0.76 | 0.96 | 0.85 | 0.47 | 0.78 |
| SegNet | 0.83 | 0.72 | 0.80 | 0.88 | 0.83 | 0.61 | 0.78 |
| ResUNet++ | 0.835 | 0.72 | 0.76 | 0.95 | 0.83 | 0.419 | 0.762 |
| FCN | 0.72 | 0.57 | 0.86 | 0.64 | 0.72 | 0.81 | 0.69 |
Table 2 shows the dice score values being compared for various models against various loss functions. The maximum value reported was for binary loss for the UNet model. The FCN model offered the least score for all the loss functions. Whereas the loss functions more or less remained constant for the segmentation models comparatively.
| Loss function | |||||
|---|---|---|---|---|---|
| Method | Dice | IOU | Tversky | SS | Binary |
| UNet | 0.80 | 0.77 | 0.78 | 0.80 | 0.85 |
| SegNet | 0.83 | 0.84 | 0.84 | 0.84 | 0.83 |
| ResUNet++ | 0.82 | 0.81 | 0.81 | 0.82 | 0.83 |
| FCN | 0.78 | 0.74 | 0.72 | 0.71 | 0.72 |
3.1.2 Qualitative Analysis
Figure 2 shows the original image and the ground truth for the selected Al-Si-Mg alloy. Figure 3 shows the predicted images for various combinations of segmentation models and their corresponding loss functions. The FCN model prediction has been poor among the selected models, as can be seen from Figure 3. On the other hand, UNet and ResUNet++ were able to predict almost close to the ground truth image, sometimes even finding the missing features. These models show better prediction for metallographic images. SegNet was also equally able to predict the features like UNet and ResUNet++, but with overprediction along the grain boundaries. The UNet model with the binary loss function was able to predict better in comparison with other models. These results agree well with the quantitative analysis.
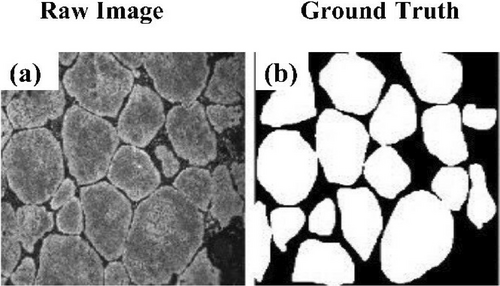
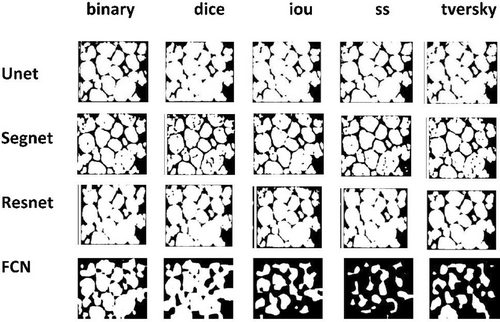
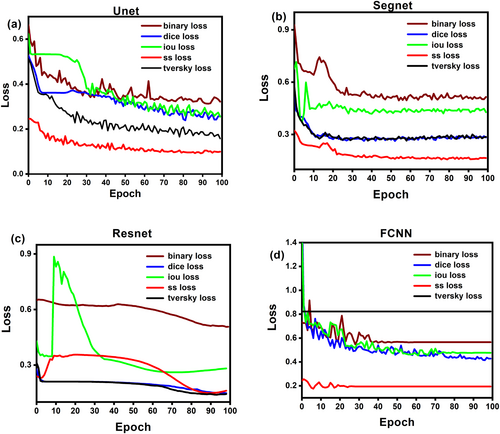
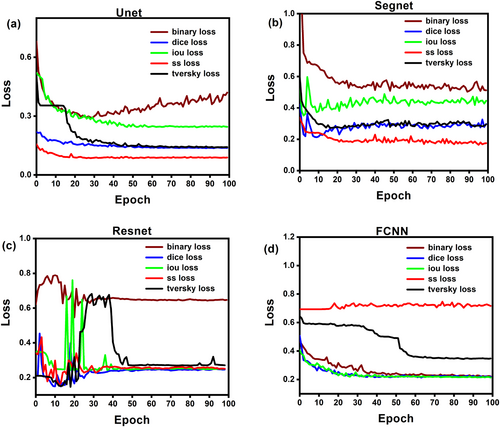
Figure 4 shows the loss curves for UNet, SegNet, ResUNet++, and FCN models, respectively. UNet and SegNet models show exponentially decaying curves compared to ResUNet++ and FCN models, thus indicating that UNet and SegNet models have better predictions. Loss functions associated with the UNet model saturated well below 0.4, whereas for the SegNet models, the curves saturated below 0.6 for all the loss functions. In both models, the SS loss function offered the least values, and the binary loss function offered the highest loss value. ResUNet++ exhibited a more saturated curve except for IOU loss function. The FCN model had saturated curves for the Tversky and ss loss functions, but the other three loss functions showed a decreasing curves.
3.2 Augmentation
3.2.1 Quantitative Performance Analysis
Table 3 shows the performance metrics for all models trained with a binary loss function. It can be seen that there has been a slight decrease in these values compared with the non-augmented ones. Similarly, Table 4 shows the dice score values compared for all models trained using different loss functions, as mentioned in the column headings.
| Metrics | |||||||
|---|---|---|---|---|---|---|---|
| Method | Dice | IOU | Precision | Recall | F1 | Specificity | Accuracy |
| UNet | 0.82 | 0.70 | 0.84 | 0.81 | 0.82 | 0.72 | 0.77 |
| SegNet | 0.81 | 0.69 | 0.81 | 0.82 | 0.81 | 0.65 | 0.76 |
| ResUNet++ | 0.81 | 0.69 | 0.71 | 0.95 | 0.81 | 0.32 | 0.73 |
| FCN | 0.71 | 0.56 | 0.79 | 0.64 | 0.719 | 0.719 | 0.719 |
| Loss function | |||||
|---|---|---|---|---|---|
| Method | Dice | IOU | Tversky | SS | Binary |
| UNet | 0.856 | 0.85 | 0.84 | 0.85 | 0.82 |
| SegNet | 0.81 | 0.82 | 0.81 | 0.816 | 0.81 |
| ResUNet++ | 0.83 | 0.83 | 0.83 | 0.78 | 0.81 |
| FCN | 0.78 | 0.79 | 0.78 | 0.76 | 0.711 |
3.2.2 Qualitative Analysis
Table 4 shows the dice score values compared for all models trained using different loss functions as mentioned in column headings. Here also, the UNet model outperforms other models. The ResUNet++ model has performed decently for dice, IOU, and tversky loss functions. Surprisingly, the FCN model has improved since the number of input images has been increased, leading to better prediction. Similarly, Figure 5 shows the predicted images for different models against the loss functions. It is clearly seen that the proposed unet model was able to predict better for all loss functions, including the grain boundaries as well as the missing features in the ground truth. The augmented dataset showed better results in comparison with the non-augmented dataset, as seen from Figures 3 and 5. Even though the SegNet model was able to predict the grain boundaries, it also overpredicted the features. The ResNet and FCN models were not able to predict the α- phase as expected, leading to poor results. Overall, the prediction has improved when compared with the non-augmented dataset for all the models.
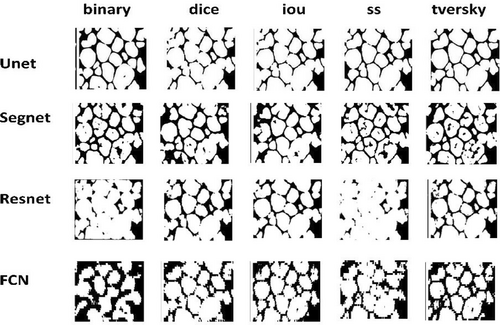
Figure 6 demonstrates the loss curves for the models. UNet model curves for non-augmented in comparison with augmented seem to have learned little with the increase in dataset. However, binary loss function curves alone show a different trend. SegNet curves have a similar pattern to non-augmented curves. Whereas ResUNet++ models have high fluctuation at the beginning of the epochs and begin to saturate towards the other half of the epochs. For the FCN model, except for ss loss function, other functions have seemed to have undergone some kind of learning, which can be found from the graph.
3.3 Comparison With Baseline Models
Table 5 shows the baseline comparison models with the author's work. Our model (Unet model) shows some noteworthy improvements over existing approaches. With an IOU score of 0.74, it achieves one of the highest intersection-over-union values in the comparison table, outperforming the well-known U-Net++ (0.718) and trailing only ResU-Net++ (0.741). This high IOU value, which demonstrates a notable overlap between predicted segmentations and ground truth, validates the spatial accuracy of the model. With the highest recall score (0.96) of all the methods tested, our model's capacity to identify all important areas in images and reduce false negatives is arguably the most impressive. Our model maintains a well-balanced performance profile across many evaluation parameters, indicating substantial adaptability across multiple segmentation settings, even though it does not claim the top spot across all metrics.
| Model | Acc | Dice | IOU | Precision | Recall | F1 | |
|---|---|---|---|---|---|---|---|
| Peng Shi (2022) [22] | FCN | 0.654 | 0.678 | 0.341 | 0.850 | 0.876 | 0.860 |
| SegNet | 0.679 | 0.783 | 0.451 | 0.950 | 0.853 | 0.898 | |
| Deeplab V3 | 0.910 | 0.790 | 0.595 | 0.734 | 0.983 | 0.840 | |
| DenseNet | 0.890 | 0.917 | 0.610 | 0.657 | 0.942 | 0.774 | |
| Mask R-CNN | 0.870 | 0.937 | 0.556 | 0.894 | 0.871 | 0.882 | |
| U-Net | 0.890 | 0.910 | 0.700 | 0.904 | 0.880 | 0.892 | |
| ResU-Net | 0.905 | 0.912 | 0.621 | 0.864 | 0.880 | 0.872 | |
| A-DenseU-Net | 0.843 | 0.916 | 0.684 | 0.920 | 0.855 | 0.886 | |
| ResU-Net++ | 0.919 | 0.927 | 0.741 | 0.890 | 0.803 | 0.844 | |
| U-Net++ | 0.960 | 0.915 | 0.718 | 0.957 | 0.890 | 0.922 | |
| Author model | Unet model | 0.78 | 0.85 | 0.74 | 0.76 | 0.96 | 0.85 |
| Unet model (Aug) | 0.77 | 0.82 | 0.70 | 0.84 | 0.81 | 0.82 | |
| Leiyang (2023) [27] | UNet-RGB | 0.8336 | — | 0.8078 | — | — | — |
| UNet-HSV | 0.8274 | — | 0.7909 | — | — | — | |
| Ours | 0.8391 | — | 0.8276 | — | — | — | |
| DeepLab V3+ | 0.8512 | — | 0.6498 | — | — | — | |
| SegNet | 0.8369 | — | 0.7313 | — | — | — |
Despite its benefits, our model has several limitations. Compared to several competing models, including Deeplab V3, ResU-Net++, and U-Net++, the accuracy score of 0.78 is lower. Additionally, the model's relatively low precision score (0.76) in comparison to alternatives indicates that it produces more false positive predictions than some of its competitors. These indications suggest potential areas for improvement in subsequent rounds.
Our augmented model variation (“Unet model (Aug)”) reveals interesting performance trade-offs, suggesting better generalization possibilities. The improved version achieves higher precision (0.84 against 0.76), but at the cost of lower recall (0.81 vs. 0.96) and slight drops in the majority of evaluation criteria. This performance profile suggests that data augmentation has likely led to the model producing more cautious predictions, which may lessen sensitivity while increasing the model's resistance to changes in the input data. This trade-off may be advantageous for applications requiring greater accuracy or deployments including a range of imaging scenarios.
Our augmented model yields an accuracy of 0.77 and an IOU of 0.70, while our base model's accuracy and IOU are 0.78 and 0.74, respectively. Because of this, our models' accuracy ratings are a little lower than those of Leiyang's work, where models frequently achieve accuracy levels of 0.82. However, our IOU performance paints a different picture. Leiyang claims that our base model (0.74) performs competitively with SegNet (0.7313) in terms of IOU and significantly better than DeepLab V3+ (0.6498). Given our accuracy limitations, our model shows good segmentation precision, even if we are unable to match the UNet variations (0.8078 and 0.7909) or Leiyang's own model's impressive IOU scores (0.8276).
3.4 Statistical Analysis of the Models
Figure 7 presents a comparative analysis of different neural network architectures (UNet, SegNet, ResUNet++, and FCN) and their augmented variants across five different loss metrics (Dice, IOU, Tversky, SS, and Binary). When compared to their base counterparts, the augmented versions of the architectures (with the “Aug” prefix) typically show better or equivalent performance across the majority of metrics. The highest overall performance peaks are displayed by Aug UNet, which reaches roughly 0.85–0.86 across a variety of parameters. In UNet and SegNet topologies, the enhancement by augmentation is most noticeable. As far as architecture-Specific Performance is concerned, SegNet performs consistently across measures (around 0.82–0.84). Although ResUNet++ performs rather steadily, it typically doesn't perform noticeably better than more straightforward systems like UNet. FCN's performance is the most inconsistent, with noticeably lower scores in several categories (around 0.72–0.78). A metric-wise analysis across architectures, dice and IOU measurements frequently exhibit associated trends. Compared to other metrics, the Binary meter shows greater volatility across various architectures. Tversky and Dice scores typically match, indicating strong segmentation performance.
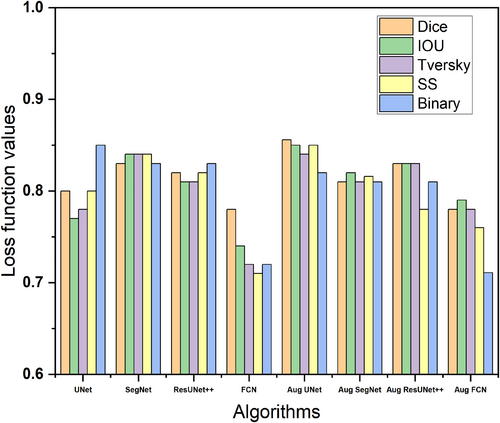
- Data augmentation's efficacy varies by architecture, with more conventional designs like UNet yielding more advantages than more intricate ones like ResUNet++. This may suggest that there is greater potential for data augmentation techniques to improve simpler architectures.
- Applications needing stable performance across many evaluation criteria may find SegNet to be a more dependable option due to its constant performance across measurements.
- The comparatively poorer performance of FCN, especially in its base version, suggests that deeper structures and skip connections—found in other networks—are essential for improving segmentation outcomes.
- While the fluctuation in Binary metrics indicates that this measure may be more sensitive to architectural differences, the correlation between Dice and IOU metrics confirms the robustness of the evaluation technique.
Figure 8 presents a comparative evaluation of four deep learning architectures (UNet, SegNet, ResUNet++, and FCN) and their augmented variants across seven performance metrics: Dice, IOU, Precision, Recall, F1, Specificity, and Accuracy.

With consistently high recall scores (∼0.95) and reliable dice coefficients (∼0.85), UNet exhibits outstanding baseline performance. ResUNet++ has comparable performance patterns to UNet, while its consistency across measurements is marginally lower. SegNet consistently performs at a reasonable level on the majority of measures (0.75–0.85). In general, FCN performs worse than alternative designs, especially when it comes to IOU and Dice measures.
Across all architectures, recall consistently performs better than other metrics (range: 0.85 to 0.95). Because of their mathematical link, IOU scores are typically lower than dice coefficients. There is significant variation in specificity among architectures (0.4–0.85). F1 scores typically match dice coefficients, confirming the accuracy of the findings. Augmented versions show mixed results, with Aug SegNet and Aug UNet exhibiting better performance balance across measures. Aug FCN displays reduced recall but increased precision. The performance of Aug ResUNet++ is comparable to that of its base version.
The superior performance of UNet, particularly in Recall and Dice metrics, suggests its effectiveness in capturing detailed features while maintaining good overall segmentation performance. This could be attributed to its skip connections that preserve fine-grained spatial information. The varied effects of augmentation across architectures indicate that data augmentation does not uniformly benefit all architectures. Some models (like FCN) might require more specialized augmentation strategies. The trade-off between Precision and Recall becomes more pronounced in augmented versions.
3.5 Advantages and Disadvantages of the Proposed Method
On the basis of performance metrics and loss function comparisons, below are the advantages and disadvantages of the modified UNet model:
-
Superior Performance Metrics:
- Highest Dice score (0.85) and IOU (0.74) among all models, which means better prediction of primary phase in the Al micrographic images matches with the ground truth (masked labels).
- Excellent recall performance (0.96), suggesting a strong ability to identify true positives, which means the region of interest is identified more correctly.
- Best F1 score (0.85), indicating a good balance between precision and recall in predicting the false positives and false negatives.
-
Loss Function Performance:
- Strong binary loss performance (0.85), suggesting good segmentation boundary prediction
- Balanced performance across SS and Tversky losses, indicating the robustness of the model
-
Architectural Complexity:
- The modified architecture with attention mechanisms and complex skip connections likely increases computational overhead.
- More parameters to train compared to standard U-Net
- Potentially longer training time due to additional processing blocks
-
Performance Limitations:
- Lower specificity (0.47) compared to other models, particularly FCN (0.81)
- Lower precision (0.76) compared to SegNet (0.80)
- Relatively lower performance on some loss metrics compared to SegNet
The modified U-Net model performs better overall on most criteria than FCN and SegNet models, but at the expense of some specificity. The performance improvements in important metrics like Dice score and recall seem to justify the trade-off between enhanced feature extraction capabilities and computational complexity. Although metallurgists should take into account the computational requirements and lower specificity when selecting this model for particular applications, the architecture's balanced performance across different loss functions suggests that it's a robust model that could be suitable for a variety of image segmentation tasks.
4 Conclusion
The following are the conclusions from the work.
- Unet and ResUnet++ models show better prediction similar to ground truth, and then comes Segnet model's prediction with lesser visual appeal, whereas FCN does worst among all, over predicting the features. Unet model with binary loss function was the best model with better prediction.
- Unet and Segnet models show exponentially decaying loss curves. On the other hand, ResUnet++ and FCN models showed a saturated curve.
- In case of the augmented dataset, there is almost no change in the dice score, IOU score, recall, F1, and specificity when compared to the non-augmented dataset.
- However, with augmentation, the Unet model was able to predict much better than when trained with the non-augmented dataset. Similarly, the ResUnet++ model has also fared better, except for the SS loss function. Surprisingly, the FCN model prediction has also improved due to the regularizing effect of augmentation.
- We conclude that with less data Unet predicts well for the image segmentation of Al-Si-Mg metallographic images, and improves with augmentation, and it is sufficiently stable across different loss functions. Further study can point to customization of Unet for the metallographic image segmentation task by applying it to other similar datasets and analyzing failure cases.
- More advanced algorithms like Hyper-relational Multi-modal Trajectory Prediction [28] method used in Intelligent Connected Vehicles (ICVs) can be tried. In this, a hyper-relational driving graph is provided in which agents and map elements are connected by hyperedges. Hypergraph dual-attention networks capture intricate connections, while a structure-aware embedding initialization guarantees unbiased representations. HyperMTP improves interpretability while outperforming baselines by an average of 4.8%, according to experiments conducted on real-world datasets. Besides this, the TrichronoNet model [29] based on multimodal fusion can also be explored for better results.
Author Contributions
Abeyram M. Nithin: conceptualization, writing – original draft, formal analysis. Murukessan Perumal: methodology, writing – original draft, visualization. M. J. Davidson: software, investigation, formal analysis. M. Srinivas: conceptualization, data curation, visualization. C. S. P. Rao: project administration, validation, investigation. Katika Harikrishna: visualization, project administration, data curation. Jayant Jagtap: formal analysis, funding acquisition, writing – original draft. Abhijit Bhowmik: project administration, writing – review and editing, validation. A. Johnson Santhosh: funding acquisition, writing – review and editing, supervision.
Acknowledgments
The authors have nothing to report.
Ethics Statement
All authors acknowledged compliance with ethical standards for preparation and publishing.
Consent
This manuscript's authors planned, designed, conducted, and interpreted the study. All authors endorse this research's publishing.
Conflicts of Interest
The authors declare no conflicts of interest.
Open Research
Data Availability Statement
The data that support the findings of this study are available from the corresponding author upon reasonable request.


