Laser Powder Bed Fusion of CuSn10: A Review
Funding: This work was supported by Fachhochschule Dortmund—University of Applied Sciences and Arts.
ABSTRACT
This review examines the current state of CuSn10 alloy manufacturing using Laser Powder Bed Fusion. Through a systematic literature search, 32 articles on LPBF-processed CuSn10 are identified and evaluated. This provides an overview of processing parameters, microstructures, mechanical properties, corrosion behavior, the effect of heat treatments, and multimaterial connections. The results show that various parameter configurations in LPBF production can achieve high densities even at lower laser powers. The resulting alloy exhibits a fine anisotropic microstructure and inherent residual stresses, which can be mitigated through thermal post-processing. The mechanical and technological properties of LPBF-fabricated material exceed those of conventionally produced material and can be adjusted through subsequent heat treatments. Significant variations in elongation are observed, which could be attributed to inconsistencies in the geometry of the tensile specimens. The review emphasizes the need for standardized test geometries and consistent reporting of specimen orientation during manufacturing to improve reproducibility and comparability. Future research should focus on systematically investigating the relationships between processing parameters and material properties, as well as exploring anisotropy and behavior under cyclic loading. Finally, future developments are assessed based on current trends.
1 Introduction
Bronze has played a crucial role in human history, giving its name to the Bronze Age, which began around 3000 bc in Europe. The alloying of copper with tin significantly improved material strength, leading to advancements in agriculture, warfare, and craftsmanship [1]. The use of bronze continued in the following ages and advances in metallurgy led to the bronze materials used today [2]. According to the broadest definition, bronze is a copper-based alloy with no more than 40 wt.% alloying elements, unless the primary alloying element is zinc, in which case the alloy is classified as brass. Traditionally, the term “bronze” is specifically used for Cu–Sn alloys, which typically contain no more than 20 wt.% tin. Higher tin content can cause significant embrittlement, rendering the material unsuitable for most technical applications [3].
The copper-tin system is characterized by a complex dual-phase structure with numerous intermediate and intermetallic phases. Particularly noteworthy is the wide solidification range, which promotes the tendency for crystal segregation, a tendency further exacerbated by the sluggish diffusion of tin within the alloy [4, 5]. For use in technical applications, alloys with a tin content of up to 20 wt.% are generally preferred [6]. This is partly because tin as an alloying element is relatively expensive, creating an incentive to switch to other alloying elements at higher tin contents [6]. Additionally, the alloy's tensile strength peaks at a tin content of around 10 wt.%, while elongation begins to decrease from a tin content of 5 wt.% and the alloy becomes significantly more prone to embrittlement from a tin content of 20 wt.% [6-8].
- The component layer is created by the laser beam.
- The build plate is lowered by one layer's thickness.
- The coater applies and smooths the powder.
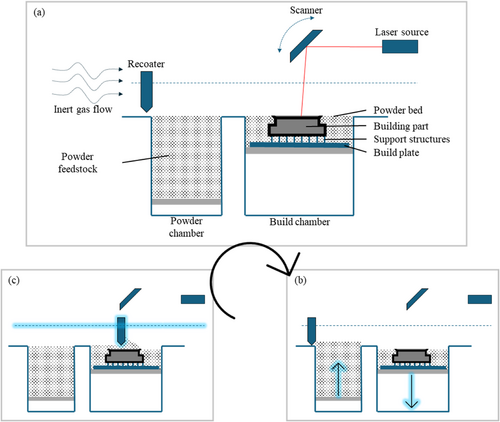
This cycle repeats until all layers are generated, and the component is manufactured and can be removed [9, 10].
In colloquial terms, brand names of various manufacturers are also used, such as “SLM” (Selective Laser Melting) by SLM Solutions, “LaserCusing” by Concept Laser, or “LMF” (Laser Metal Fusion) by Trumpf [13]. The core processes of these mentioned methods are essentially the same. The finished components achieve relative densities of ≥ 99.5% and have comparable or even superior mechanical and technological properties to cast parts, which can be attributed to a fine microstructure developed during the manufacturing process. This fine microstructure is produced by a high cooling rate of over 100,000 K s−1 [14, 15], which can also lead to the formation of different phases than those typically produced by other manufacturing methods [9, 16].
Process-related operations often result in high residual stresses that necessitate thermal post-treatment. Moreover, during the manufacturing process, a preferred direction in crystal growth occurs, leading to anisotropy in the material. Additionally, the use of support structures in the process typically requires mechanical post-treatment. Furthermore, adherent or only partially melted particles lead to rough surface textures, necessitating additional post-treatment for function-critical surfaces [15, 17].
The manufacturing parameters, schematically depicted in Figure 2, are crucial for optimizing the LPBF process and significantly influence the quality and characteristics of the fabricated metallic components. Laser power plays a central role as it determines the energy required to melt the metal powder. Precise tuning of the laser power is essential to ensure a uniform melt pool while preventing material damage. Laser focus affects the size and shape of the laser beam on the powder bed. A tightly focused laser beam enables precise melting conditions, indispensable for detailed features, whereas a broader focus distributes the energy over a larger area, beneficial for larger components. The scanning speed, the rate at which the laser scans across the powder bed, determines the production rate. Higher speeds increase production efficiency but carry the risk of incomplete melting of the powder, potentially compromising the structural integrity of the component. Layer thickness refers to the height of the powder layer applied before each pass of the laser. Thinner layers capture finer details in the component design but require more passes to build, thereby extending the production time. Hatch distance, measured as the space between adjacent laser tracks, impacts the density and strength of the component. Reducing the hatch distance increases the component's density, which is advantageous for mechanical strength but can slow down the manufacturing process [19, 20].
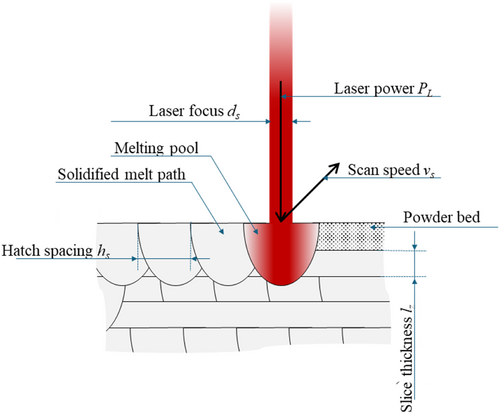
However, these parameters are simplifications for which there is no direct physical correlation. For example, complex correlations are linearized for the energy density and parameters with different effect strengths are equated. In the case of the build-up rate, the production time of a component changes greatly with the positioning in the installation space, as a high production height means many production layers, which is not taken into account in the usual equation. Accordingly, the parameters are used for the estimative comparison of different parameters.
The application of CuSn in LPBF manufacturing addresses challenges such as high material costs and issues with large solidification intervals [11]. The extensive design freedom and the capability to produce fine structures minimize material usage through innovative design approaches, facilitating more cost-effective solutions for existing challenges. Additionally, the small melt pools in combination with high cooling rates counteract segregation tendencies and result in an extremely fine microstructure. This microstructure enhances the mechanical and technological properties of the material [20]. Previous studies have shown that CuSn10 is easier to process additively than pure copper or CuSn alloys with a lower tin content [22]. The tin lowers the solidus and liquidus temperatures and increases the melting interval, which means that the melt lasts longer [4]. Due to the simultaneous decrease in surface tension, the melt can wet better, which improves the production process [22]. Studies of tin contents between 0.3 [23] and 15 wt.% [24] can be found in the literature, although these are exceptions and the majority of published studies deal with CuSn10. This can be explained by the fact that the increased tin content of 10 wt.% by weight significantly improves absorption, while the maximum strength reaches a maximum point [22]. In recent years, numerous studies have been published dealing with various aspects in this field. These studies have been compiled in the present work to categorize the entire research field and facilitate future research.
2 Methods
For the advancement of LPBF manufacturing of CuSn10, it is crucial to have a comprehensive understanding of the existing research in this field. A structured literature analysis was conducted to gather, summarize, and evaluate information regarding LPBF of CuSn10 alloys. This analysis is essential to identify current research gaps, technological challenges, and potential avenues for future studies.
In conducting the literature review, all articles up to and including 2023 were considered, focusing on the processing of CuSn10 using LPBF. The term CuSn10 was expanded to include all copper-based alloys with a tin content between 9 and 11 wt.% and a maximum content of other elements of 1 wt.%.
Various search terms were tested during the literature search, with “CuSn10” proving to be the most effective. This can be attributed to the fact that the term is an internationally widespread designation for the material, capable of detecting variations such as “Cu-10Sn” or “Cu90Sn10.” Additionally, the material is predominantly used in additive manufacturing, rendering the inclusion of terms specific to the manufacturing process unnecessary, thus simplifying the search. This is particularly advantageous since the LPBF process is often referred to in literature by trade names such as “Selective Laser Melting.”
The course of the literature search is schematically depicted in Figure 3. Searches were conducted on platforms such as “Google Scholar,”1 “ResearchGate,”2 “Web of Science,”3 and “Semantic Scholar,”4 and hits were evaluated based on their titles and abstracts. After removing duplicates, 25 articles were identified. To complement this, a network analysis was performed using the “Litmaps”5 search portal, where additional articles were identified based on citations and references in the individual articles, as well as keywords mentioned within them. This process led to the identification of two additional articles, resulting in a total of 27 articles considered in this review.

As part of the data preparation, the observation period was extended to 07/2024, whereby five additional articles could be included in the overview.
The articles were subsequently divided into two groups. The first group includes articles in which CuSn10 was processed using the LPBF method. These articles will be referred to as “CuSn10” articles throughout this review. The second group consists of articles where CuSn10 was processed in a multi-material configuration using the LPBF method. These articles will be referred to as “CuSn10-Multi-material” articles. Of the 32 identified articles, 17 are “CuSn10” articles, and 15 are “CuSn10-Multi-material” articles, with 12 of the latter specifically discussing 316L/CuSn10 combinations. Of the remaining “CuSn10-Multi-material” articles, one features a multi-material combination of NiTi/CuSn10, one involves CuSn10 with three other alloys, and in one, CuSn10 powder was alloyed with aluminum. An overview of the research field is provided in Figure 4. The two categories are color-coded for distinction: Green represents “CuSn10” articles, while orange indicates “CuSn10-Multi-material” articles. The size of the markers signifies their relevance within this overview, defined as the number of citations within other articles in the overview. The X-axis categorizes the articles by publication date, whereas the Y-axis represents the number of citations on a logarithmic scale. Lines between markers indicate citations among the articles. Due to space constraints, not all authors' names could be included in the diagram.

3 Results and Discussion
In Tables 1 and 2, “CuSn10” and “CuSn10-Multi-material” articles were systematically cataloged, respectively. These tables present a range of key findings, including study parameters, relative density, build rate, and tensile test results. Some values presented in the tables were not given in the articles but derived from calculations conducted for this review with values presented in the articles. The respective values are marked in red, whereas those extrapolated from graphical representations in the articles are indicated with an asterisk for clarity. All data points relate to the “as-built” state of the materials examined. In cases where the articles included studies of varying parameters, the results corresponding to the highest material density were selected.
| References | [25] | [26] | [27] | [28] | [29] | [30] | [31] | [32] | [33] | [34] | [35] | [36] | [37] | [38] | [39] | [40] | [41] |
|---|---|---|---|---|---|---|---|---|---|---|---|---|---|---|---|---|---|
| Topic | |||||||||||||||||
| Year | 2015 | 2018 | 2019 | 2019 | 2020 | 2021 | 2021 | 2021 | 2021 | 2022 | 2022 | 2022 | 2022 | 2022 | 2024 | 2024 | 2024 |
| Parameter test | — | X | X | X | — | X | — | — | X | X | — | X | X | — | — | X | — |
| Tensile test | X | X | — | — | X | X | — | X | X | — | X | X | — | X | X | — | — |
| XRD | X | — | — | — | X | X | — | — | X | — | — | X | X | X | X | — | — |
| EBSD | — | — | — | X | X | X | — | X | — | — | — | — | — | — | X | — | — |
| Corrosion | — | — | — | — | X | — | — | — | — | — | — | — | — | X | X | — | X |
| Heat treatment | — | — | — | — | X | X | — | X | X | — | — | — | — | — | — | — | X |
| Residual stress | — | — | — | — | — | X | — | — | — | — | X | — | — | — | — | — | — |
| Laser power, W | 271 | 95 | 95 | 250 | 95 | 174 | 290 | 250 | 180 | 220 | 95 | 350 | 330 | 110 | 120 | 350 | 100 |
| Scan speed, mm s−1 | 210 | 360 | 330 | 1100 | 1200 | 350 | 1000 | 1100 | 200 | 500 | 324 | 750 | 650 | 1200 | 600 | 750 | 300 |
| Slice thickness, mm | 0.09 | 0.02 | 0.02 | 0.03 | 0.015 | 0.03 | 0.02 | 0.03 | 0.03 | 0.03 | 0.02 | 0.03 | 0.04 | 0.02 | — | 0.03 | 0.015 |
| Hatch spacing, mm | 0.09 | 0.06 | 0.06 | 0.09 | 0.05 | 0.12 | — | 0.09 | 0.09 | 0.11 | 0.065 | 0.12 | 0.07 | 0.06 | 0.05 | 0.12 | 0.06 |
| Volume energy density, J mm−3 | 159 | 220 | 240 | 85 | 106 | 138 | — | 84 | 333 | 133 | 226 | 130 | 181 | 76 | — | 130 | 370 |
| Density, % | 99.7 | 101.83 | 98.40 | 99.7 | 101.33 | 99.8 | — | — | 98.45 | 99.86 | 100.23 | 99.8 | 99.73 | 100.34 | — | 99.99 | — |
| Build-up rate, mm3 s−1 | 1.701 | 0.432 | 0.396 | 2.97 | 0.9 | 1.26 | — | 2.97 | 0.54 | 1.65 | 0.4212 | 2.7 | 1.82 | 1. | — | 2.7 | 0.27 |
| Tensile strength, MPa | 420 | 490 | — | — | — | 530* | — | 749 | 440* | — | 487 | 490 | — | 578 | 723/558b | — | — |
| Elongation, % | 17 | 19 | — | — | — | 26* | — | 29 | 13* | — | 5 | 19 | — | 32 | 33/12b | — | — |
- a X indicates that the respective procedure was reported on in the respective article. Values that were derived from calculations conducted for this review with values presented in the articles are marked in red. Values extrapolated from graphical representations in the articles are indicated with an asterisk.
- b First value is at θ = 0° and the second at θ = 90.
| Reference | [42] | [43] | [44] | [45] | [44] | [46] | [47] | [48] | [49] | [50] | [51] | [52] | [53] | [54] | [55] |
|---|---|---|---|---|---|---|---|---|---|---|---|---|---|---|---|
| Topic | 316L/CuSn10 | NiTi/CuSn10 | b | Al/CuSn10 in situ | 316L/CuSn10 in situ | ||||||||||
| Year | 2019 | 2020 | 2020 | 2021 | 2021 | 2022 | 2022 | 2022 | 2023 | 2023 | 2024 | 2022 | 2021 | 2023 | 2024 |
| Parameter test | — | — | — | — | — | — | — | — | — | — | — | — | — | — | — |
| Tensile test | X | — | X | — | — | X | X | — | — | — | — | X | — | — | — |
| XRD | X | — | — | — | — | — | — | — | — | — | — | X | — | — | X |
| EBSD | — | X | — | X | — | — | — | — | X | X | — | — | — | — | — |
| Corrosion | — | — | — | — | — | — | X | — | — | — | X | — | — | — | — |
| Heat treatment | — | — | — | — | — | — | X | — | — | — | — | — | — | — | — |
| Residual stress | — | — | — | — | — | — | — | — | — | — | — | — | — | — | — |
| Laser power, W | 300 | 300 | 400 | — | — | 200 | 100 | 230 | 400 | 300 | 300 | 160 | 145 | — | 300 |
| Scan speed, mm s−1 | 700 | 700 | 500 | — | — | 230 | 324 | 200 | 500 | 700 | 700 | 300 | 1000 | — | 700 |
| Slice thickness, mm | 0.03 | 0.03 | 0.05 | — | — | 0.03 | 0.015 | 0.03 | 0.05 | 0.03 | 0.03 | 0.03 | 0.03 | — | 0.03 |
| Hatch spacing, mm | 0.085 | 0.085 | 0.12 | — | — | 0.08 | 0.065 | 0.08 | 0.1 | 0.085 | 0.075 | 0.08 | 0.085 | — | 0.085 |
| Volume energy density, J mm−3 | 168 | 168 | 133 | — | — | 362 | 317 | 479 | 160 | 168 | 190 | 222 | 57 | — | 168 |
| Density, % | 98.66 | 98.66 | 99.1 | — | — | — | 99.7 | — | — | — | — | — | — | — | — |
| Build-up rate, mm3 s−1 | 1.785 | 1.785 | 3 | — | — | 0.552 | 0.316 | 0.48 | 2.5 | 1.785 | 1.575 | 0.72 | 2.55 | — | 1.785 |
| Tensile strength, MPa | 578.7 | — | 431.8 | — | — | 561.6 | 487 | — | — | — | — | 425* | — | — | — |
| Elongation, % | 23.9 | — | 17.8 | — | — | 32.93 | — | — | — | — | — | — | — | — | — |
- a X indicates that the respective procedure was reported in the respective article. Values that were derived from calculations conducted for this review with values presented in the articles are marked in red. Values extrapolated from graphical representations in the articles are indicated with an asterisk.
- b 316L/CuSn10/18Ni300/CoCr.
The calculation of the relative density was necessary for this review in cases where only the absolute density was provided in the articles. Using the reference value of 8.74 g cm−3 for CuSn10 [56], the relative density was computed. It was observed that the calculated values sometimes exceeded 100%, which is implausible since this would imply a negative number of pores in the material. This excess could be attributed to variations in chemical composition and/or the employed measurement technique. Absolute densities were typically determined using Archimedes' weighing method. As reported in Calignano et al. [34], this method, while quick, is not reliable for samples with densities exceeding 99%. In such instances, a shift to optical methods is recommended. In Mehta et al. [36], samples were measured using both Archimedes' weighing and optical methods, leading to significant differences in results. In this study, however, this was attributed to adhering particles on which fine air bubbles can form.
The calculated build rate is the product of scanning speed, hatch spacing, and layer thickness, allowing for comparison between different parameter sets. However, this does not take into account that the build speed is also influenced by additional factors, such as the orientation in the build space. This is because a new powder layer must be applied between each layer. During this time, it is generally not possible to perform laser exposure, resulting in varying production times for a component depending on its orientation.
To characterize the additive manufacturing of CuSn10, data from the articles were compiled, focusing only on the density values ≤ 100%. The distribution of the achieved density, build-up rate, tensile strength, and elongation are shown as boxplots in Figure 5.

The relative density is at 99.4 (±0.6)%, although this mean value is influenced by a few values that are significantly lower than most of the others. This is evident from the fact that the median is at 99.7%. The build-up rate is evenly distributed between 0.3 and 3.0 mm3 s−1, with a mean value of (1.6 ± 1) mm3 s−1. The tensile strength and elongation for the as-built condition range from 420 to 749 MPa and from 5% to 33%, respectively. The mean values are (529 ± 100) MPa for tensile strength and (22 ± 8)% for elongation.
3.1 Feedstock
Metal powders serve as the primary feedstock for LPBF manufacturing and significantly influence both process and part quality. The morphology and size distribution of the powder are critical factors, as they govern powder flowability and, consequently, processability. A uniform chemical composition is also essential to ensure consistent material properties. Due to the high surface-to-volume ratio of fine particles, LPBF processing may lead to undesirable interactions with the environment, such as moisture absorption, which can reduce flowability, or oxidation of the powder particles [8, 57].
In the 32 reviewed articles, the powder materials for manufacturing CuSn10 alloys were prepared in various ways. In 21 cases, the powder was produced through gas atomization, resulting in powders with particles of nearly spherical morphology. Such a powder is shown in Figure 6 including the cross-section.
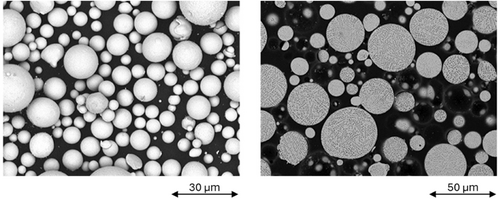
In two cases, powder production was achieved through water atomization, which generated powders that were less uniform than the gas-atomized ones, but the particles are still predominantly spherical. The remaining articles lacked specific information regarding the method of powder production. As the available data in the articles varies, a uniform particle size cannot be determined. Therefore, based on availability, Figure 7 presents the mean value (if possible, including standard deviation), the median (Dv(50)) (if possible, including Dv(10) and Dv(90)), or the range of the particle sizes for the articles in which any such information was given.
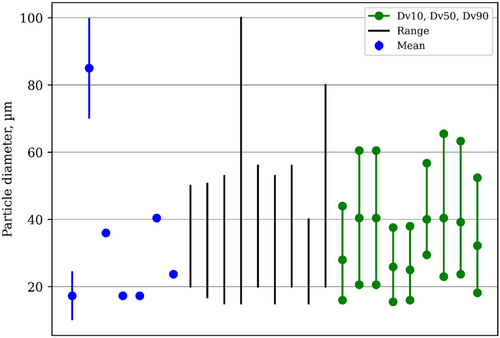
For further analysis, the range values are excluded due to ambiguities regarding whether they represent the minimum and maximum values of the measured powder or the boundaries of the sieving and screening process. Concentrating solely on mean values and medians reveals one outlier at (85 ± 15) μm, which originates from the earliest publication identified in the review [25], primarily exploring the general feasibility of the process. Owing to its deviation from subsequent findings, this value is disregarded in providing a general overview. Under the simplified assumption that the mean value is approximately equivalent to the median, an average particle size of about 35 μm is inferred for LPBF fabrication utilizing CuSn10. This estimation falls within the typical size range for the LPBF technique [10].
In the reviewed articles, the composition of the base material, specifically for CuSn10, was only partially provided. In 18 articles, the tin content was reported, averaging (10.3 ± 0.4) wt.%. The absorption quotient increases with increasing Sn content, while the thermal and electrical conductivity decreases [22]. A higher absorption facilitates the manufacturing process due to the better energy absorption, while the reduction in thermal conductivity in this case also has a positive effect on manufacturing, as the thermal gradients are lower.
Notably, the phosphorus content, mentioned in five articles, ranged between 0.24 and 0.79 wt.%, thus exceeding the usually defined limit of 0.2 wt.% of phosphorus in CuSn10 [56, 58]. Elevated phosphorus levels were observed in the datasheets from suppliers “MSE Supplies” (USA) [59] and “Stanford Advanced Materials” (USA) [60], with reported phosphorus content of 0.6–1 and 0.4–1 wt.%, respectively. “SLM Solutions” (Germany) [61] only disclosed the tin content, while “m4p” (Germany) [62], distributing the material under the name “Brz10,” allows for 0.5 wt.% of other elements in addition to the tin content. Consequently, it cannot be assumed that the phosphorus content in LPBF-manufactured CuSn10 is below the permissible mass fraction. In Gu et al. [30], conducted within the framework of the LPBF process, the influence of phosphorus in the Cu–10Sn–0.4P was investigated. A phosphorus concentration of 0.4% proved to be crucial in enhancing the ductility of the alloy without negatively affecting its strength and hardness. This improvement is primarily attributed to the oxygen scavenging properties of phosphorus. In this context, phosphorus acts as an efficient oxygen scavenger, reacting with the oxygen present in the material to form phosphorus oxides. These phosphorus oxides are less detrimental to the mechanical properties of the alloy compared to the copper oxides that would otherwise form. This reaction helps to prevent the formation of large, brittle oxide films, which could otherwise serve as potential sources of cracking under mechanical stress.
In Zhou et al. [37], it is recommended to vacuum dry the powder material at 80°C for 4 h prior to processing, in order to avoid any moisture in the powder. In Yang et al. [39], the powder was also dried at 80°C for 3 h before production. Moisture can impair the flowability of the powder and lead to impurities during the laser melting process that impair the compactness and performance of the printed parts [8].
To summarize, a spherical gas-atomized powder with a diameter of approximately 35 μm is usually used. The average tin content is (10.3 ± 0.4) wt.%. In some cases, a phosphorus content above the limit value was indicated, which is consistent with the manufacturers' specifications analyzed.
3.2 Manufacturing Parameters
The selection of manufacturing parameters is crucial to the success of the LPBF process. Precise fine-tuning of these parameters allows for optimization of specific parameter sets to meet varying requirements, such as rapid production or high relative density, which in turn affects the mechanical and technological properties of the produced part [9, 63]. Conversely, improperly adjusted parameters can lead to significant manufacturing issues. For example, insufficient energy input may result in incomplete powder melting, while excessive energy input can cause undesirable vaporization in the melt pool. Poorly coordinated parameter combinations may also lead to process instabilities, such as the breakup of the melt track into droplets [64].
Adjusting the individual manufacturing parameters for the LPBF process is crucial for the entire process. To compare different parameter sets, key values are typically used, which describe the energy supplied per unit area or volume [26, 28, 30, 34, 37, 38, 42, 55]. However, these numerical expressions of energy density do not provide a complete analysis of the energy in the process, as the relationships are oversimplified and do not take into account the complexity of energy distribution and absorption [34]. This highlights the need to better describe the relationship between individual parameters in a parameter set.
Density is often used as an optimization parameter in parameter determination, typically measured using the Archimedes principle [26, 27, 29, 35, 38], or through optical evaluation of cross-sectional analysis [25, 28, 30, 33, 34, 36, 37, 42, 43, 46, 48]. Furthermore, x-ray CT systems can be used to provide a comprehensive picture of the number and size of pores in the material [29, 40], although this is only marginally practicable for parameterization due to resource constraints. While determining the density of material samples using the Archimedean method is quick and cost-effective, there seem to be frequent problems with this method, as the determined density exceeds the reference density in some cases [56]. It has been reported that this problem occurs when the density of the samples exceeds 99% [34]. At low scanning speeds, distortion of measurements using the Archimedean method is reported, attributed to increased powder adhesion [31]. Various parameter combinations can lead to achieving high densities. Accordingly, knowing the intensity of their impact on the manufacturing process is beneficial for optimization. Through a range analysis in Calignano et al. [34], the significance order of individual parameters on density and surface quality was detected as follows: laser power > scanning speed > hatch distance. Layer thickness was not considered here, though layer thickness has a significant impact on manufacturing time, as a component is divided into fewer individual layers to be manufactured at a higher layer thickness. The possible layer thickness results from how deep the individual melt tracks reach and how they are shaped [31], which in turn depends on the interplay between laser power and scanning speed [36]. In the parameter analysis of Mehta et al. [36], laser powers from 200 to 350 W and scanning speeds from 100 to 1000 mm s−1 were examined, resulting in melt pools ranging from 107 to 634 μm in depth and from 133 to 577 μm in width.
For an overview of the typical process window in the additive processing of CuSn10, Table 3 lists the minimum and maximum values as well as the median for laser power, scanning speed, layer thickness, hatch distance, and the key value of volumetric energy density from the reviewed articles.
| Laser power, W | Scan speed, mm s−1 | Slice thickness, mm | Hatch spacing, mm | Volume energy density, J mm−3 | |
|---|---|---|---|---|---|
| Minimum | 95 | 200 | 0.015 | 0.05 | 57 |
| Maximum | 400 | 1200 | 0.09 | 0.12 | 479 |
| Median | 240 | 625 | 0.03 | 0.09 | 168 |
Since the parameters extracted from the studied articles were optimized within their parameter window regarding their density, it is not possible at this point to make a statement about which individual parameters influence the density.
To investigate which individual parameters contribute to a parameter set with high relative density, the available data in Figure 8 were plotted. Data sets are used in which the four evaluated values—laser power, scanning speed, layer thickness, and density—are present, on the condition that the relative density does not exceed 100%, which applies to 13 data sets [25, 27, 28, 30, 33, 34, 36, 37, 40, 42-44, 47]. The analysis examines the influence of laser power (top left), scan speed (top right), layer thickness (bottom left), and the comparative parameter volumetric energy density (bottom right) on the relative density. The x-axes are oriented such that the applied energy increases from left to right. To facilitate evaluation, linear trend functions, including the coefficient of determination, have been added.
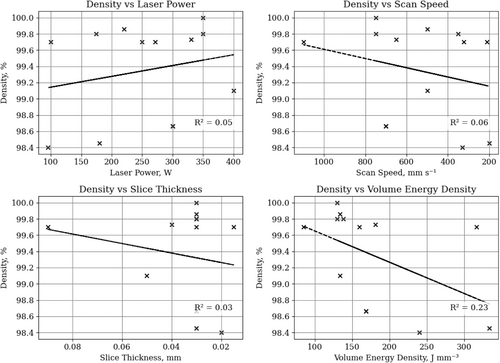
In general, the analysis is complicated by the fact that only 13 out of 32 datasets can be used for the overview, as either the necessary information is missing or the density unrealistically exceeds 100%. The usable data do not allow for conclusions regarding which individual parameters influence high relative density, as neither correlations nor trends can be identified in the graphs. It is striking that high relative component densities could be produced with a wide variety of parameter permutations.
Correlations between the individual parameters were investigated in individual studies. It was observed that a combination of higher laser powers and lower scanning speeds leads to high densities, which was also detected in individual publications [30]. The reason for this could be twofold: First, the high thermal conductivity of the material ensures that thermal energy is dissipated quickly [11], and second, the low laser absorption of copper materials at a wavelength of 1640 nm [17] results in high reflection, necessitating a high input of energy.
The high energy input, in combination with the high thermal conductivity, leads to high thermal gradients in the manufacturing process, resulting in increased residual stresses in the LPBF production of CuSn10 [30, 35]. To reduce these stresses during the process, build chamber heating at about 80°C is sometimes used [28, 32, 34, 37, 39], which reduces the thermal gradients by increasing the minimum temperature. Despite the challenges with the internal stresses described in the articles, no cracks were reported in any of them.
To summarize, a variety of combinations of manufacturing parameters can lead to high densities in the LPBF production of CuSn10. It can be seen that the common key figures are inadequate for comparing parameter sets with each other, as these key figures do not correlate with the density. In particular, good results can be achieved with lower scanning speeds, which is due to the fast heat dissipation due to the high thermal conductivity and the low laser absorption, which requires a higher energy input. Despite the challenges posed by the high temperature gradients and the resulting high residual stresses, no cracks were reported in the studies. The evaluation of the individual articles has shown that parameters with a wide range of individual parameters can generate a high relative component density without visible cracking occurring. For economical production, however, it makes sense to optimize the parameterization with regard to the build-up rate, with the laser power proving to be a limiting factor in many articles.
3.3 Microstructure
The microstructure critically influences the mechanical and technological properties of Cu–Sn systems through phase distribution and grain size. Depending on the solidification process and subsequent treatments, various phases with distinct properties, such as the ductile α-phase and the brittle δ-phase, may form [41]. Grain size also plays a significant role, as it determines the number of grain boundaries, which, among other effects, imped dislocation movement [65]. Additionally, a preferred orientation within the grain structure can lead to anisotropic macroscopic properties, resulting in differing characteristics across various directions in the material [66]. CuSn10 is traditionally shaped by casting, where the resulting microstructure varies in heterogeneity depending on the selected casting process. Typically, the microstructure consists of dendritic α-solid solution crystals and an (α + δ) eutectoid [56]. This structural diversity is due to the varying cooling rates in each process, combined with the broad solidification range of the alloy and the diffusion inertia of tin. Consequently, significant concentration differences can occur within the solid solution crystals, with the crystals last precipitated from the residual melt being considerably richer in tin than those precipitated first. Additionally, the high crystallographic similarity of the emerging Cu–Sn phases complicates the crystallographic classification of the solidified material [6].
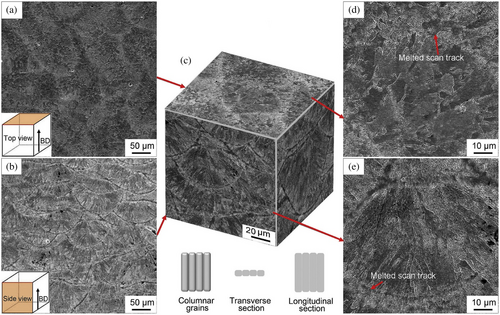
The additively processed alloy exhibits a fine microstructure, typical for the process [28-30, 32, 38-40, 47, 51]. Grain growth predominantly occurs in the direction of the build axis or exhibits an angular offset of up to 20°, indicating anisotropy [32, 35, 36, 39, 48]. Due to rapid solidification and repeated remelting, mainly columnar grains are formed [28, 38, 39], with average grain sizes of about 2 μm measured in the layer plane [52] or between 1.5 and 5.5 μm with an average of 4.8 μm [39].
Figure 9 shows the microstructure of LPBF-fabricated CuSn10. Here, c shows a three-dimensional image in which the melting tracks typical of the process are clearly visible: (a and d) show the top view, while (b and e) show the side view.
The high cooling rates in the manufacturing process [35, 67] and the material's diffusion inertia [56, 68] prevent the establishment of the equilibrium state depicted in the phase diagram.
In the studies examined, several XRD measurements were carried out to determine the phase composition, (see for example Figure 10), but the results are inconsistent. In the following, only tests on material manufactured by LPBF are included. On one hand, a copper-rich α-Cu phase (fcc) and a tin-richer intermetallic δ-Cu41Sn11 phase (fcc) were identified [30, 32, 36, 38, 42, 53]. In Chen et al. [42], the lattice constant for the α-phase was measured as a = 0.03655 nm and for the δ-phase as a = 0.17965 nm. In Mehta et al. [36], two α-structures with different tin content were detected, having lattice constants of α 1 a = 0.3653 nm and α 2 a = 0.3684 nm, respectively. The measured δ-phase has a lattice constant of a = 1.794 nm. In Mehta et al. [36] and Zeng et al. [29], the proportion of the δ-phase was estimated to be 6.6 and 25.9 wt.%, respectively, using Rietveld analysis. In two other studies, in addition to the α and δ phases, the metastable β′-Cu13.7Sn (bcc) phase was also detected [33, 37]. In addition, Cu5.6Sn was detected in Wang et al. [33] and Yang et al. [39]. During solidification in the manufacturing process, the α-phase forms first due to its higher melting point, acting as the core of dendrites. From the center of these to the edge, the Sn content gradually increases, allowing the formation of (α + δ) phases [24, 29]. Accordingly, the δ-phase is usually found between the dendrites of the α-Cu phase [33]. In Zhou et al. [37], it is reported that during the solidification of the melt pool in the manufacturing process, there is competing nucleation between the β′-Cu13.7Sn and α-Cu phases, resulting in the formation of very few or no δ-Cu41Sn11 phases. The initial powder, due to the rapid cooling during atomization, exhibits the same phases [30, 36, 38].
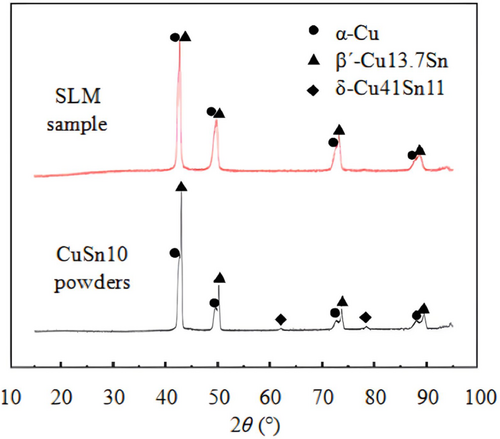

The formation of this metastable phase could be related to the manufacturing parameters and the cooling conditions of the melt in the manufacturing process. Its presence could influence the mechanical properties, particularly hardness and strength of the alloy [33, 37], presenting an interesting approach for further investigations.
In summary, the material in the as-built condition exhibited a fine anisotropic microstructure. In all studies, the α-Cu phase (fcc) and the intermetallic δ-Cu41Sn11 (fcc) phase were detected. This means that the existing phase after LPBF production is comparable to conventionally cast material, although the structure is significantly finer due to the high cooling rate [25]. Additionally, Cu13.7Sn and Cu5.6Sn were identified in some investigations. Whether this phase was not always present or merely not detected in certain cases is not clear from the available data base. Similarly, there is insufficient data available to detect interactions between the microstructure and the manufacturing parameters.
3.4 Physical-Technological Properties
The physical-technological properties of a material encompass both mechanical and thermal characteristics. They are crucial in determining whether a material is suitable for a specific application and how the corresponding component must be designed after material selection to optimally meet the required demands [69]. The physical-technological properties of a material are primarily influenced by its chemical composition as well as its crystal structure and microstructure (e.g., grain structure and phase composition), as these determine atomic bonding and arrangement, directly impacting properties such as strength, deformability, and thermal conductivity [70]. Accordingly, the microstructure characteristic of the LPBF process leads to a distinction in the material profile of additively manufactured CuSn10 compared to conventionally produced material [30, 32, 34, 36]. An anisotropy expected due to the process-specific microstructure was predominantly not addressed in the studies reviewed, and the determined properties were not associated with the orientation in the build space. Only [39] specifically investigated the effects of orientation during production. Consequently, it is not possible to make substantiated statements about mechanical anisotropy in relation to the orientation in the build space. For a better contextual understanding, the review data were compared with data from two powder suppliers for the LPBF process, as well as with extrusion cast CuSn10 in Table 4. Since the data from the suppliers are based on experiments conducted under identical conditions, a normal distribution can be assumed, hence mean values and, where available, standard deviations are provided. However, the values collected from the research include results from various experiments with different parameters, machines, and starting materials. Therefore, to improve comparability, the median is presented in addition to the mean value with standard deviation. Supplier 1 offers material properties for layer thicknesses of 30 and 50 μm, with the former being used here as it is much more common (Table 3). Changes resulting from thermal post-treatments are discussed in Section 3.6.
| Value | Review | Supplier 1 | Supplier 2 | Continuous casting | ||
|---|---|---|---|---|---|---|
| Median | Mean ± standard deviation | n | [61] | [62] | [56] | |
| Hardness, HV | 160 | 160 ± 12 | 12 | 160 ± 6 | 170 | 150a |
| Tensile strength, MPa | 490 | 529 ± 96 | 15 | 516 ± 15 | 430 | 280 |
| Yield strength, MPa | 386 | 374 ± 66 | 9 | 385 ± 14 | — | 170 |
| Elongation, % | 19 | 22 ± 8 | 13 | 22 ± 5 | 7 | 10 |
| Young's modulus, GPa | 115 | 121 ± 25 | 5 | 109 ± 9 | — | 102 |
| Flexural strength, MPa | 687 | 687 ± 43 | 2 | — | — | — |
| Flexural strain, mm mm−1 | 0.75 | 0.75 ± 0.06 | 2 | — | — | — |
- a Converted.
3.4.1 Static Mechanical Properties
Static mechanical properties describe the behavior of a material under constant or slowly increasing load. These values are typically measured in situations where the load is continuous and without sudden changes [15]. For fundamental characterization and quality assurance, static properties are routinely used and are therefore commonly included in material datasheets—in contrast to dynamic mechanical properties, which are less frequently documented as standard [61, 62].
Table 4 provides an overview of the static material properties. Notably, there is a varying degree of fluctuation among different property values. Hardness values exhibit a fluctuation of approximately 8%, tensile and yield strength around 18%, elongation approximately 36%, and the Young's modulus around 21%. Due to the limited data, the variation in flexural strength and flexural strain cannot be accurately assessed.
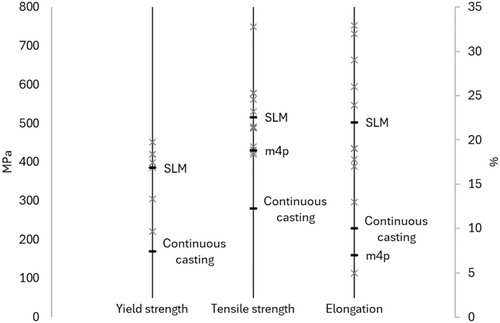
In hardness measurements, the median and mean values are identical, indicating a homogeneous distribution of the measurements. Moreover, all reference values fall within the standard deviation, suggesting that the manufacturing method does not significantly impact hardness. For clearer visualization, the tensile test values are presented in Figure 11. In this figure, gray crosses represent the values from individual studies, and black markings indicate the respective average values. It is observed that both yield strength and tensile strength values are consistently higher than those of continuous casting and predominantly align with supplier values. The observed increase in strength values compared to other manufacturing processes is attributed to the fine microstructure [30, 32, 34, 36]. Elongation, except in one case, also exceeds the continuous casting values, yet the elongation data vary greatly and do not show a clear trend; significant differences are also evident in the manufacturers' reference values. The variability in elongation cannot be explained from the available data. There is no correlation in the review data with manufacturing parameters, their indices, scanning strategy, or the used inert gas. A potential relationship with the sample's shape and geometry could not be assessed due to a lack of necessary details, as data on sample shapes were often incomplete or not provided at all. Furthermore, it is unclear whether tensile samples were manufactured in their final form or if the material was additively manufactured and then machined to create the sample. It is only evident that various geometries and dimensions of tensile samples were used. The influence of tensile sample geometry and dimensions on mechanical properties, especially their significant impact on elongation, is described in the literature [71]. Additionally, the specific features of the LPBF process could affect the properties, as the surface-to-volume ratio changes depending on the type and dimensions of the sample. This can significantly improve heat dissipation into the powder bed or change heat dissipation through the material, potentially leading to heat accumulation. Both factors change the thermal conditions during the manufacturing process, potentially affecting the component and thus its resultant properties.
Only five measurements of four papers are available for the modulus of elasticity, which limits the informative value of these results. In addition, there is the general difficulty in determining the modulus of elasticity. From these papers, an average Young's modulus of (121 ± 25) GPa (median 115 GPa) is derived, which corresponds in terms of magnitude to the data provided by Supplier 1 at (109 ± 9) GPa [61], as well as the reference value for traditionally manufactured CuSn10 of 102 GPa [56]. Consequently, no significant impact of the manufacturing process on the Young's modulus can be identified.
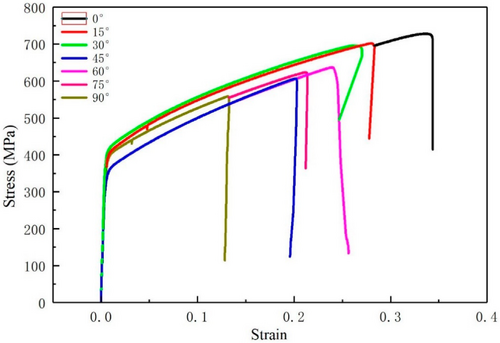
In Yang et al. [39], three tensile specimens were fabricated for each orientation from horizontal (0° to the build plate) in 15° increments up to vertical (90° to the build plate) and subjected to a tensile test. The corresponding stress–strain diagrams are plotted in Figure 12. The highest values for yield strength, tensile strength, and elongation were observed in the vertical specimens, while the lowest values were found in the horizontal specimens. This behavior can be attributed to the microstructure. In the horizontally fabricated tensile specimen (0° to the build plate), more grain boundaries oppose dislocation movement, which improves the mechanical properties of the specimens.
In summary, the static properties of LPBF-fabricated CuSn10 surpass those of conventionally fabricated counterparts. A notable observation is the significant variation in elongation during tensile testing. A study investigated the effects of build orientation, revealing pronounced mechanical anisotropy. The tensile test values in the build direction were significantly lower compared to those orthogonal to it [39].
3.4.2 Dynamic Mechanical Properties
The dynamic properties typically include, on the one hand, the material's response to sudden loads such as impacts, which is represented by the impact test, and on the other hand, cyclic loads, as encountered in gear systems, which can be evaluated through fatigue testing [15]. The investigation of these properties is particularly relevant to ensure the durability and reliability of components in technical applications. Cyclic loading, for instance, can lead to component failure even under stresses that are low compared to static strength. For example, the tensile strength Rm of CuSn10 sand casting is at least 250 MPa, while the same material fails after 108 load cycles at a stress level of 100 MPa, which is even below the minimum value for R p0.2 (130 MPa) [56]. Thus, it is crucial to understand the dynamic properties to appropriately design constructions.
Only in one study, the resistance to impact loading was evaluated using a Charpy impact test. In Wang et al. [33], an impact energy of 10 J cm−2 was recorded for a V-type Charpy specimen. However, the variability and orientation in this context remain unclear. This is significantly lower than the values for conventionally cast CuSn10, which is specified with an impact toughness of 50 J cm−2. Data on the resistance of LPBF-manufactured CuSn10 to cyclic loading is completely lacking.
To ensure the safe use of additively manufactured CuSn10, information on dynamic loading is required. This is especially important because it is unclear how the fine pores in the LPBF-produced material behave under cyclic loading.
3.4.3 Thermal Properties
Copper and its alloys are frequently used due to their excellent thermal and electrical conductivity [6, 56], which are proportionally related [72]. Consequently, it is crucial to understand whether, and to what extent, the thermal properties of LPBF-manufactured CuSn10 differ from those of conventionally manufactured CuSn10.
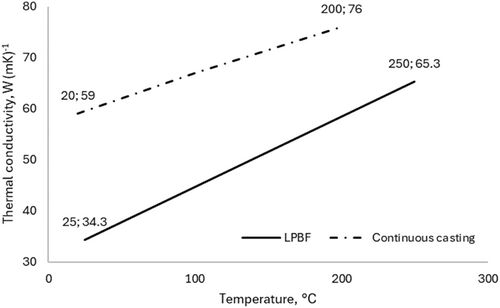
The thermal conductivity was measured in Zeng et al. [29] between 25°C and 250°C. It was found that the conductivity in the build direction was slightly lower than that in the orthogonal direction, leading the authors to combine both directions. These values, along with a reference value [56], are illustrated in Figure 13. Multiple values are available for both, but since they express a linear behavior, only the initial and final points are indicated. The thermal conductivity of the additively manufactured material is significantly lower than that of the reference material. However, due to the lack of additional data, it is unclear whether this represents a general trend or is an isolated case.
In Liu et al. [48], the dimensional change upon heating both in and orthogonal to the build direction was observed, and no significant difference was detected. This suggests that the coefficient of thermal expansion exhibits little or no anisotropy.
Summarized, hardness and the modulus of elasticity are consistent, indicating a uniform distribution and no significant influence of the manufacturing method. The tensile strength and yield strength are generally higher than values from continuous casting, which can be attributed to the fine microstructure, and closely align with manufacturers' specifications. Elongation varies significantly and shows no clear trend, with differences also evident in the reference values from manufacturers. This variability in elongation could not be explained with the available data, and no correlation with manufacturing parameters was established. A possible explanation might lie in different sample shapes and how the test geometry was attained. Regarding dynamic properties, only limited data is available. Also, the impact of anisotropy on mechanical and technological properties remains unclear. Overall, LPBF-manufactured CuSn10 shows comparable and sometimes improved mechanical properties compared to traditional manufacturing, with some variations in elongation. Due to some open questions, further investigations would be desirable.
3.5 Surface Quality
The quality of the surface is significantly influenced by the manufacturing parameters used. Depending on the formation of individual melt tracks and their overlap with adjacent melt tracks, more or less smooth transitions between the tracks occur. Additionally, the condition of the melt is crucial. For instance, if it is irregular and partially disintegrates into individual droplets, this is reflected in the surface appearance. The quality of the surface is a critical factor in determining whether post-processing, such as grinding, is necessary to meet the required quality standards for functional surfaces [15]. Furthermore, surface roughness can serve as initiation points for crack formation, which may be problematic in safety-critical applications [73].
In the study examined in Chen et al. [40], the scanning speed was varied from 540 to 800 mm/s under otherwise identical parameters, and the resulting surface roughness was measured optically, leaving interactions with other parameters undetected. The measurements showed low values at a scanning speed of 450 mm s−1 (S a ≈ 6 μm, S z ≈ 50 μm), which gradually increased up to 850 mm s−1 and then sharply rose up to 1000 mm s−1 (S a ≈ 22 μm, S z ≈ 205 μm). In addition, Calignano et al. [34] measured the surface quality without post-treatment, measuring an R a of (7.21 ± 2.03) μm and an R z of (35.6 ± 10.1) μm. The surface roughness could be reduced by approximately a factor of four through bead blasting at 6 bar. This reduction is attributed to the removal of partially melted particles that adhere to the surface due to the heat in the powder bed [34]. An attempt to remove these adherent particles using ultrasonic cleaning was not completely successful [36]. Supplier 1 [61] reports a surface roughness of R a (9 ± 1) μm and R z (54 ± 6) μm.
3.6 Heat Treatment
A heat treatment of LPBF-manufactured components is an optional post-processing step but offers opportunities for targeted reduction of residual stresses and improvement of component precision, particularly when applied before the part is removed from the build plate. Additionally, the phase composition and grain size, as well as resulting properties such as strength and corrosion resistance, can be adjusted. Studies have demonstrated that mechanical properties can be significantly tailored through these adjustments [29, 30, 32, 33, 47]. The impact of thermal post-treatments on corrosion resistance is examined in the following Section 3.7.
The heat treatments conducted in the reviewed articles are listed in Table 5, including references to the respective study.
| Temperature/time, cooling | References | Temperature/time, cooling | References |
|---|---|---|---|
| 200°C for 2 h, FC | [30] | 600°C for 4 h, FC | [33] |
| 300°C for 1 h, FC | [33] | 650°C for 2 h, AC | [41] |
| 300°C for 2 h, FC | [30] | 700°C for 2 h, FC | [30] |
| 320°C for 2 h, AC | [32, 41] | 800°C for 1 h, CR 10°C min−1 | [29] |
| 400°C for 20 min, AC | [47] | 800°C for 1 h, WC + 400°C for 4 h, AC | [33] |
| 400°C for 2 h, FC | [30] | 800°C for 2 h, FC | [30] |
| 400°C for 4 h, FC | [33] | 800°C for 2 h, AC + 400°C for 4 h, AC | [32, 41] |
| 500°C for 2 h, FC | [30] | 800°C for 4 h, FC | [33] |
| 600°C for 1 h, CR 10°C min−1 | [29] | 860°C for 1 h, AC | [32] |
| 600°C for 2 h, FC | [30] |
- Abbreviations: AC, air cooling; CR, cooling rate; FC, furnace cooling; WC, water cooling.
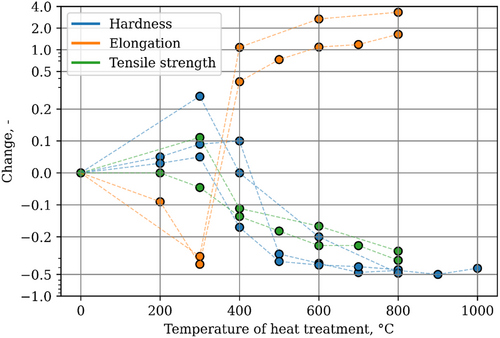
The basic influence of heat treatment is depicted in Figure 14. This figure illustrates the changes in tensile strength, elongation, and hardness in relation to the temperature of heat treatment. Factors such as holding time, cooling method, and the second stage in multi-stage heat treatments are not considered. The connecting lines are only for orientation purposes, as there is no information available for the areas between these points.
The observed extremities in the plotted mechanical properties at approximately 300°C can be attributed to a phase transformation. The metastable β′-Cu13.7Sn phase decomposes, leading to further formation of the δ-Cu41Sn11 phase [33]. Consequently, in this temperature range, the proportion of the brittle intermetallic phase is at its highest, resulting in the highest tensile strength and hardness, as well as the lowest elongation. At around 400°C, the decomposition of δ-Cu41Sn11 begins [33], which is completed by a full transformation into α-Cu at approximately 600°C [29, 30, 33]. As the brittle intermetallic phase decreases in favor of the more ductile α-Cu phase, elongation significantly improves, while tensile strength and hardness decrease notably. The same effect observed in elongation is also measurable in impact strength [33].
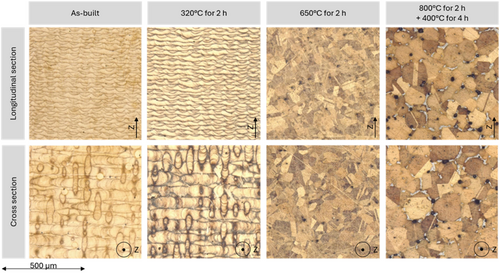
The effects of thermal post-processing are also evident in microstructural images. Figure 15 shows LPBF-manufactured CuSn10 in and orthogonal to the mounting direction in different treatment states. Below 320°C, no changes are observable [30, 32, 33, 41]. Only at 400°C some cases show visible changes in grain structure. These were observed in Wang et al. [33], but not in Kremer et al. [47], which could be attributed to the significantly shorter holding time in the latter. At 600°C [29, 30, 32, 33], respectively at 650°C [41], there is a clear restructuring of the microstructure, and the typical appearance of the process is no longer recognizable, with the grains transforming from elongated to more granular structures. The appearance of the samples at ≥ 800°C resembles that at 600°C, but with significantly enhanced grain growth [29, 32, 33, 41], with additional precipitation occurring at the grain boundaries in Kremer et al. [41].
The visible anisotropy in the microstructure was investigated in Zeng et al. [29] and Kremer et al. [41] and was not recognizable at 600°C. Temperatures below this were not examined. The visible onset of grain growth starting at 400°C is notable, which is also reflected in a sharper peak of α-Cu in the x-ray diffraction patterns [30]. Grain coarsening leads to improved elasticity but adversely affects tensile strength and hardness, which can be attributed to reduced obstruction of dislocations due to fewer grain boundaries [30, 33, 74].
In Gu et al. [30], x-ray diffraction analysis demonstrated that a heat treatment at 200°C for 2 h is sufficient to significantly reduce residual stresses.
In summary, the change in mechanical-technological properties can be attributed to three effects: phase transformations, grain changes, and grain size. Considering the described mechanisms, a desirable approach through thermal post-processing would be to establish a complete α-Cu phase, create uniform grains, while limiting grain growth as much as possible.
3.7 Corrosion Behavior
CuSn10 is known for its good corrosion resistance, particularly in saline environments, making it suitable for marine applications and pumps in water management [56, 75, 76]. Since this property is a common reason for using CuSn10, it is essential to examine whether LPBF-manufactured CuSn10 exhibits the same corrosion resistance as traditionally manufactured material. However, assessing the corrosion resistance of LPBF-fabricated CuSn10 is challenging, as no specific standards for corrosion testing of additively manufactured materials have been established, limiting the comparability of various studies; therefore, general corrosion testing standards are often applied [29, 41]. Additionally, it is important to consider the potential effects of thermal treatments on corrosion resistance.
The corrosion investigations from the review data are divided into electrochemical and gravimetric test methods. The data from the gravimetric tests are presented in Table 6. In Zeng et al. [29], three samples each were immersed in a 3.5 wt.% NaCl solution for 24 h and then reweighed. This process was repeated 11 times in total, and the individual data points were approximated using a linear function to determine the corrosion rate in terms of mass per unit area per unit time. In Kremer et al. [41], an immersion test was conducted for 21 days according to ASTM G31-21 [77] in a 3.5 wt.% NaCl solution at 35°C. The surfaces of the samples were prepared using P120 grit wet sandpaper. In the same study, a salt spray test was performed according to ASTM B117-11 [78] at 35°C with a 5% NaCl solution for 336 h. The samples were also prepared with P120 grit wet sandpaper beforehand.
| References | Condition | Salt spray test, mm year−1 | Immersion test, mm year−1 |
|---|---|---|---|
| [41] |
As-built 320°C for 2 h 650°C for 2 h 800°C for 2 h + 400°C for 4 h |
0.231 (±0.048) 0.257 (±0.018) 0.271 (±0.023) 0.183 (±0.031) |
0.393 (±0.037) 0.373 (±0.019) 0.388 (±0.017) 0.333 (±0.035) |
| [29] |
As-built 600°C for 1 h 800°C for 1 h |
0.256a 0.196b 0.195c |
- a Converted, original 0.612 mg cm−2 per day, with ρ = 8.74 g cm−3.
- b Converted, original 0.469 mg cm−2 per day, with ρ = 8.74 g cm−3.
- c Converted, original 0.469 mg cm−2 per day, with ρ = 8.74 g cm−3.
The data from the electrochemical investigations are presented in Table 7. All measurements were conducted using a standard three-electrode system with a saturated calomel electrode as the reference electrode. In all cases, a 3.5 wt.% NaCl solution was used as the electrolyte. There are significant differences in the sampling rates, measurement ranges, and measurement times of the open-circuit potential, which could affect the comparability of the measurements. Additionally, the corresponding corrosion rates were not determined in all publications.
| References | Condition | OCP, mV | Ecorr, mV | Icorr, μA/cm2 | Corrosion rate (mm/year) |
|---|---|---|---|---|---|
| [29] |
As built 600°C for 1 h 800°C for 1 h |
Ca. −170 Ca. −155 Ca. −155 |
−629 −468 −451 |
7.586 3.388 3.236 |
— — — |
| [38] | As built | — | −261 | 3.860 | 0.111a |
| [47] |
As built 400°C for 20 min |
−239 ± 8 −246 ± 1 |
−316 ± 37 −299 ± 1 |
19.49 ± 5.14 14.91 ± 1.14 |
— — |
| [51] | As built | — | −288 | 4.63 | — |
| [41] |
As-built 320°C for 2 h 650°C for 2 h 800°C for 2 h + 400°C for 4 h |
−243 ± 5 −244 ± 4 −246 ± 4 −246 ± 1 |
−239 ± 7 −245 ± 8 −240 ± 4 −251 ± 9 |
4.332 ± 1.490 5.637 ± 1.018 5.320 ± 1.902 4.392 ± 0.575 |
0.112 ± 0.039 0.136 ± 0.015 0.120 ± 0.040 0.113 ± 0.015 |
- a Converted, original 4.388 miles per year, with 1 mi l = 0.001 in.
In two studies, the corrosion resistance was improved through thermal post-treatments [29, 47]. However, this improvement could not be replicated in Kremer et al. [41] in either the electrochemical tests, immersion tests, or salt spray tests. Possible reasons for this discrepancy could be influences from the starting material or the manufacturing process itself.
Considering all available corrosion rates, regardless of the measurement method, salt concentrations, and exposure conditions, it is evident that all corrosion rates fall into the same corrosion protection category. According to DECHEMA, the tested material would be classified in category “+” (material loss of 0.1–1 mm year−1) [79]. Even when finer classifications, such as those for copper materials (level 2; material loss of 0.1–0.5 mm year−1) according to the German Copper Institute [76], are applied, all corrosion rates fall within the same category. This suggests that the thermal treatments and the differences in tested environmental conditions lead to variations that are technically insignificant. Furthermore, no study has detected an influence of the manufacturing orientation on the corrosion behavior.
3.8 Multimaterial Connection
Multimaterial connections are used to combine the properties of different materials, thereby creating optimized, functional components for specific applications [42, 44-53, 55, 79]. Typically, the component to be manufactured is initially built to a certain height with one material and then continued with another material. This can either be achieved by interrupting the manufacturing process to switch materials [47] or by continuously adjusting the material feed during the ongoing process [55].
A complete material change leads to a process interruption, which can negatively impact manufacturing, for example, by causing undesirable changes in thermal gradients. To mitigate this effect, powder-free exposures after the material change can be used to raise the surface temperature of the previously fabricated material before resuming the manufacturing process with the new powder [42, 43, 45]. However, if only the supplied powder is changed, there is the issue that the deployed but unsintered powder cannot be reused, significantly increasing material waste.
In situ manufacturing is often also considered a multimaterial joining technique, in which different powders are mixed, and the actual alloy of the component is formed only during the manufacturing process. This method enables a more flexible use of alloys and allows for targeted chemical adjustments within a component to adapt its composition to specific stresses. While the in situ approach offers potential advantages, it also carries the risk of powder segregation, which can lead to undesirable material fluctuations within the component [54]. Both manufacturing techniques can also be combined to create broader, less abrupt transitions between two materials in multimaterial components [55]. Of the 15 reviewed research articles on multimaterial connections [42-55, 80], only one article [54] applied the in situ method to alloy two materials during manufacturing, and one other article used the in situ method to adjust the transition zone between two materials [55].
3.8.1 Connection Between CuSn10 and 316L
In the majority of cases (13 out of 15), the combination of CuSn10 with 316L was utilized [42-51, 53, 55, 79], attributed to the beneficial mix of CuSn10's conductivity and 316L's mechanical durability. In Liu et al. [46], the fabrication and testing of a coaxial nozzle for Directed Energy Deposition is presented, where the application of multimaterials extended the nozzle's operational lifespan. Notably, in all reviewed studies, bronze was deposited onto steel, with the exception of Chen et al. [45] and Liu et al. [48], where both configurations were examined. This preference may be explained by the significantly higher energy input required for CuSn10 compared to 316L, partly due to differences in laser absorption characteristics [11]. Consequently, when bronze is deposited on 316L, sufficient transmitted energy is available to melt the underlying 316L, which can lead to challenges when the configuration is reversed.
Figure 16 aids in understanding the formation of the transition zone between 316L and CuSn10. In this setup, a layer of CuSn10 powder was applied onto a 316L substrate, followed by the creation of individual melt tracks, which were then prepared in cross-section. It is clearly visible how both CuSn10 and 316L contribute to the formation of the melt pool, resulting in Fe- and Cu-rich phases in the solidified region. This mixing is attributed to Marangoni convection [10, 17], while the isolated Fe-rich and Cu-rich areas can be explained by the limited miscibility in the Cu–Fe system [46, 80].
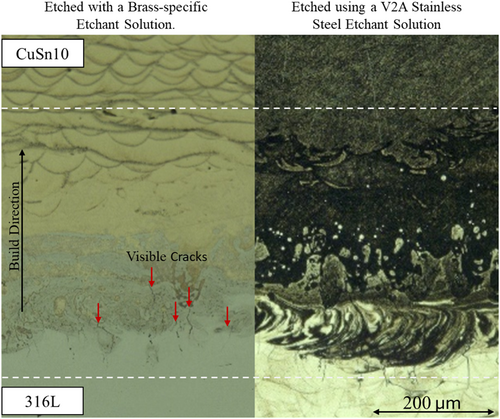
As the melt tracks are formed from both the overlying powder material and the previously melted underlying material, part of the substrate is incorporated into each subsequent layer, creating transition zones between the two materials, as shown in Figure 17. The sample displays a metallographically prepared cross-section of the transition zone, which was initially etched with a bronze etchant composed of H2O2, NH3, and H2O, followed by treatment with a V2A etching solution containing HCl, HNO3, and H2O. Images from both preparation stages were combined into a composite, clearly illustrating material diffusion. In the left section, treated with the bronze etchant, the CuSn10 melt tracks are highlighted, while the 316L region shows no reaction. On the right side, the V2A etchant significantly corroded the Cu components, making the 316L regions, which are more resistant to the etchant, clearly visible. Similar transition zones have also been identified in other studies, with all works investigating the transition zone detecting cracks, as also observed in Figure 17 [42-46, 48, 49, 51, 53].
Several studies have examined the load-bearing capacity of the multimaterial joint between 316L and CuSn10. For example, in Chen [44], a strong mechanical interfacial bonding strength was achieved. The ultimate tensile strength of the multimaterial samples exceeded that of the CuSn10 samples, and the multimaterial samples were able to withstand a significant degree of torsional stress in bending and shear directions. Similarly, strong bonds were observed in other studies [43, 49, 55]. In Chen et al. [43], it was shown that defects near the interface were the primary factors limiting the maximum bonding strength.
In Chen et al. [51], it is reported that corrosion resistance was compromised due to the inhomogeneous distribution in the transition zone, leading to galvanic corrosion. In contrast, Liu et al. [46] found no increased corrosion risk for multimaterial joints.
3.8.2 Connection Between CuSn10 and Other Materials
In Wang et al. [53], a multimaterial composed of 316L/CuSn10/18Ni300/CoCr (with 316L at the top) was produced. In the interface region between CuSn10 and the maraging steel 18Ni300, no cracks were observed; only some porosity was noted.
The bonding between CuSn10 and the shape memory alloy NiTi was investigated in Song et al. [52], with CuSn10 fabricated onto NiTi. Various parameterizations were examined, and in some cases, cracks appeared in the transition zone. In general, tensile samples from the multi-material composites exhibited lower strength than the individual base materials (tensile strength approximately 300 MPa), suggesting a relatively weak bond at the interface.
In Foadian and Kremer [54], the feasibility of in situ alloying of CuSn10 with 10 wt.% was investigated using two morphologically similar powders. During powder processing, segregation occurred between the two powders, resulting in highly inhomogeneous samples characterized by pore and crack formation.
In summary, the reviewed studies primarily focused on combining CuSn10 with 316L to leverage the thermal and electrical conductivity of CuSn10 alongside the strength of 316L. An interface forms between these materials, featuring regions dominated by Fe and Cu. Cracks tend to appear within this transition zone. Despite the partially inhomogeneous interface with cracks, all studies demonstrated a robust transition area. However, no information is available regarding the behavior of this interface under cyclic loading.
4 Summary
This review highlights key aspects of the Laser Powder Bed Fusion (LPBF) manufacturing of CuSn10 alloys. A total of 32 articles were reviewed, covering both single-material and multi-material configurations, providing significant insights into processing parameters, microstructures, mechanical properties, and corrosion behavior.
It was found that LPBF production typically uses spherical powder with a diameter of about 30 μm and a tin content of 10.3 (±0.4) wt.%. There is uncertainty regarding the phosphorus content, which in some studies and from certain suppliers significantly exceeds the threshold value, suggesting that phosphorus may be added partly to enhance processability and mechanical properties. In this context, a clear indication of the phosphorus content would be desirable.
Regarding parameterization, it is shown that various assumed parameter configurations, even at low laser powers, can lead to high densities. However, from an economic standpoint, parameter configurations with high build rates are preferred. The material produced via LPBF exhibits a fine anisotropic microstructure and internal stresses, which can be mitigated through heat treatments. Due to the high cooling rate, the material is not in phase equilibrium but consists of the α-Cu phase (fcc) and other, more brittle phases that accordingly affect the mechanical and technological properties. At this point, it would be desirable to have more knowledge about the influence of parameterization on the microstructure. Thermal post-treatments can alter the microstructure and thereby adjust the properties. Low-temperature treatments enhance strength at the expense of ductility, while high temperatures have the opposite effect. Generally, the mechanical properties significantly exceed those of cast CuSn10. In particular, the yield and tensile strengths are considerably higher. Notably, there is considerable variation in fracture elongation, which is challenging to assess due to missing information on the geometry of the tensile specimens. Consequently, standardization of tensile specimen geometries or at least consistent reporting of geometry and orientation during manufacturing would be desirable. One study investigated the effects of build orientation, revealing pronounced mechanical anisotropy. The tensile test values in the build direction were significantly lower than those orthogonal to it. Further investigations on this topic would be beneficial. Data on dynamic and particularly cyclic loading are lacking. Likewise, details on thermal data are sparse.
The corrosion behavior can only be evaluated in saline media, with all measured corrosion rates, regardless of test procedure or thermal post-treatment, ranging between 0.1 and 0.5 mm year−1. In conclusion, the standardization of test structures and improved documentation management, as suggested in VDI 3405 for materials manufactured via LPBF [15], could simplify further investigations. Optimization of process parameters and further development of heat treatments are crucial to enhance the performance and reliability of these materials. Future research should focus on the detailed examination of the effects of heat treatment and systematic variation of process parameters to develop a deeper understanding of the relationships between processing conditions and material properties. Moreover, there is a research gap in the area of dynamic loading, complicating the use of LPBF-manufactured CuSn10 in many applications where alternating loads are expected.
5 Outlook
In the future, technological advancements in LPBF technology may bring about changes. The possibility of processing highly reflective materials such as pure copper has improved with the advancement of LPBF technology. Additionally, the newly developed use of green lasers instead of the usual red lasers, as mentioned in all discussed articles, offers significant advantages. Green laser sources are advantageous for processing copper and its alloys due to their substantially higher absorption rate compared to red lasers [81]. LPBF systems with green standard laser sources are already available on the market [82].
Besides the higher strength, a significant advantage of CuSn10 over pure copper and low-alloyed Cu-Sn alloys in LPBF production is its better laser beam absorption. However, this comes with a significant reduction in electrical and thermal conductivity. Technological advancements are likely to lead to CuSn10 being generally easier and more efficient to process. Moreover, technological progress could make other CuSn alloys and pure copper more attractive, as the problems with manufacturing due to the low absorption with red lasers might be reduced or even eliminated. This would probably lead to CuSn10 being displaced in LPBF production for applications where conductivity is a priority. Improved processability of pure copper could significantly enhance the use of 316L/CuSn10 multi-materials. Since these composites use the copper alloy for its conductivity and the steel for its strength, a shift to 316L/Cu multi-materials would be advantageous. Research on 316L/CuSn10 multi-materials would provide an excellent foundation for this transition.
Simultaneously, the easier processing of CuSn10 due to improved absorption, which also comes with an increased build rate and corresponding higher cost efficiency, could open up new application fields for LPBF-manufactured CuSn10.
Author Contributions
Robert Kremer: conceptualization, methodology, formal analysis, investigation, writing – original draft, visualization, project administration, data curation. Somayeh Khani: methodology, writing – review and editing. Tamara Appel: methodology, writing – review and editing, supervision. Johannes Buhl: methodology, writing – review and editing. Heinz Palkowski: methodology, writing – review and editing, supervision.
Acknowledgments
The authors would like to acknowledge the financial support for the publication fees provided by the Library of the FH Dortmund (Fachhochschule Dortmund—University of Applied Sciences and Arts). In addition, many thanks to Dr. Astrid Hönekopp and Dr. Johannes Etzkorn for their support with proofreading. Open Access funding enabled and organized by Projekt DEAL.
Conflicts of Interest
The authors declare no conflicts of interest.
Endnotes
Open Research
Data Availability Statement
Data sharing not applicable to this article as no datasets were generated or analysed during the current study.


