Design of Novel Secondary Controller for AGC in Multi-Area Multi-Sources Power System Incorporated Renewable Energy Using a Gray Wolf Optimizer Algorithm
ABSTRACT
Three unequal-area multi-source interconnected hydrothermal systems with wind power plants integrated into each area are the subject of this paper's analysis of automatic generation control (AGC). A fully optimum two-level neuro-fuzzy proportional plus integral plus derivative with filter (TLNF-PIDF) is introduced as secondary controller. An appropriate generating rate constraint (GRC) has been considered for the hydro and thermal power plants. The study compares several performance indices and optimization algorithms, provides the most favorable performance. Subsequently, the Gray Wolf Optimizer (GWO), a recently developed optimization algorithm, is employed to optimize the parameters of the controllers. The effectiveness and adaptability of the proposed technique are demonstrated through its application to a three-area hydrothermal-wind power plant. The hydropower plant is integrated as a mechanical and electric governor; the thermal portion is considered a reheat turbine. The dynamic performance of electric and mechanical governor is evaluated and compared for further applications. The system performance is assessed and compared by considering wind energy sources with the TLNF-PIDF, NF-PIDF, and PIDF controllers. The analysis clearly shows that the TLNF-PIDF controller performs better than both NF-PIDF and PIDF. Finally, a robustness analysis is carrying out to proof the controller's resilience under varying loading conditions.
1 Introduction
Advanced power systems are economically and technically interconnected and operate in parallel. Quick load swings, parameter uncertainty, and other factors can all lead to a decline in the performance of a large-scale, complex, nonlinear power system. Matching the total power generated to the power consumption in connected and parallel systems is preferable. A quick load disturbance causes fluctuations in the tie-line power and system frequency. To offset these factors, a powerful, well-designed controller is needed. These are done using automatic generation control (AGC). AGC is, therefore, essential to maintaining frequency variations below allowable limits. AGC's primary duties are to control power transfer between locations and maintain the system frequency variation within acceptable boundaries. It is essential to control the power fluctuations along the tie lines. Maintaining the frequencies and power exchange within predetermined bounds is the main objective of reducing the area control error (ACE) [1].
Numerous researchers have created several control mechanisms to address the AGC issue. Elgerd and Fosha [2] illustrate the effectiveness of AGC in a multi-area using only thermal units. The discrete mode AGC utilized in a multi-area single-source system, which includes a reheat thermal system, is examined by Kothari et al. [3]. Bhise et al. [4] studied AGC in multi-area systems that included hydro and thermal units. The feasibility of the load frequency regulation system has been examined using the generation rate constraints (GRC) employed by Swain et al. [5]. Taplamacioglu and Gozde [6] examined the impact of the GDB versus GRC in a multi-area thermal system. Nanda et al. [7] explained nonlinear AGC in three regions with thermal units considering generation rate limitations. AGC in a two-area power system has been studied by Tripathy et al. [8] considering boiler dynamics. Guha et al. [9] used GRC to suggest the AGC of a two-area system with three sources in each area. Novel studies on the AGC of the hydrothermal system integrating classical secondary controllers, considering electric and mechanical governors, have been conducted by Balamurugan [10]. A multi-area hydrothermal system with an electrical governor on AGC has been studied by Saikia et al. [11]. Das et al. [12] investigated the system performance using a proportional–integral (PI) or PID controller with a wind-diesel-based improved coyote optimization algorithm (ECOA) while taking into account the LFC of the single region. The current PI/PID controller paradigm, which is based on ECOA, reduces the frequency deviation of the power system. Abazari and others [13] AGC modeling of multi-area systems with wind and thermal power plants The proportional integral–proportional-integral (PI–PI) and proportional derivative with filter-PI (PDN-PI) cascade controllers are examined. A comparison is made between the performance of traditional PI and PIDN controllers. However, when wind power plants (WPPs) are used alongside conventional power plants, there is a problem with system stability. Depending on how much wind energy reaches the wind turbines, the mismatch between generation and load demand may worsen. WPPs may cause disruptions because of the dynamic nature of wind energy, even though traditional power plants manage AGC.
WPPs are not used to control and stabilize disturbances within the control area. However, they may soon be allowed to participate in power system AGC plans. The dynamic modeling and construction of robust load frequency control regulators in a wind-diesel-based AGC without storage has been examined by Ngamroo [14]. The suggested modeling of an AGC-based controller alters the frequency deviation of the power system. However, in high-loading scenarios, the system responsiveness must still be optimized. The efficiency of AGC in thermal, wind power, and hydropower plants was shown by Hakimuddin et al. [15]. Combining WPPs with traditional power plants causes system instability, even if variations in wind energy available to wind turbines can either raise or decrease the imbalance between generation and load demands. WPPs are popular nontraditional energy sources that provide customers with electrical energy. However, the electric governor and the impact of wind energy sources under three unequal areas of multi-source systems have received less attention from the researchers. As a mechanical and electric governor, the hydropower plant is separately incorporated. Low-power speed detection and droop compensation of the electronic components are two advantages of switching from a mechanical governor to an electrical governor, according to Jagatheesan and Anand [16]. In the slow period and low-frequency region, electronic components enhance system performance and provide more flexibility. A flywheel and the speed governor of the power unit were utilized in the previous article to modify the power system's frequency. This approach needed to be revised for the power systems to operate correctly Liu et al. [17].
A critical factor in enhancing AGC performance is the controller design. Several standard conventional controllers, such as integral, proportional plus integral (PI), integral plus derivative (ID), proportional plus integral plus derivative (PID), integral double derivative (IDD), and their integrations, were used as the primary and earlier controllers in numerous researchers' attempts to study the AGC of power systems. The auxiliary controller has been implemented in the combined AGC and AVR inner loops, just like conventional PI, PID, PI-PID, and PID-PID. However, classical controllers may perform better in a nonlinear higher-order system Ali et al. [18]. It is time-consuming, deviates from ideal solutions, and requires extra work to prevent premature convergence. Dash et al. [19] detailed the interconnected AGC of a four-area reheat thermal system. They suggested a PI-PD cascade controller for AGC for the first time. Abazari et al. [20] have demonstrated how to use a fuzzy PID and a classical PID controller to control the load frequency of wind-incorporating power systems. They have proposed designing a PID and fuzzy PID-based LFC controller that lowers the frequency deviation of the power system. Additionally, it minimizes the peak amplitude of the characteristic frequency changes, lowers the power of the swapped tie line, and produces a system with a shorter settling time than standard PID controllers. However, it requires additional simulation and fine-tuning before it can be used, and there are problems finding suitable membership values for fuzzy systems. Meseret et al. [21] explained how to concentrate on the AGC of interconnected systems frameworks by utilizing one of the artificial intelligence methods. To lower the frequency deviation of the power system, they have proposed modeling a PID and artificial neural network (ANN) PID-based LFC controller. Therefore, when considering GRC, the ANN-based intelligent control approach is faster, more precise, and yields better results. However, neural networks can only be used if training data is available; the learning process might take a long time, and much data is required for training. Therefore, the AGC research can be expanded by investigating the benefits of combining neural networks and fuzzy logic controllers with traditional controllers. There has never been prior research on the best way to incorporate a two-level neuro-fuzzy controller with a proportional–integral-derivative with a filter coefficient (TL-NFPIDF) controller. Furthermore, seven membership functions (MFs) with 7*7 = 49 rules were considered in the earlier research on AGC for the fuzzy controller design. It needs more resolution when it comes to improving the heavy-loading power system. In order to create 11*11 = 121 Rules that are resilient to the intricate dynamic framework, the authors changed the 11 MF. When creating an efficient controller, the gain parameters must be carefully chosen for the area control to control the system efficiently. There has never been prior research on the best way to incorporate a two-level neuro-fuzzy controller with a proportional–integral-derivative with a filter coefficient (TLNF-PIDF) controller.
The genetic algorithm (GA), the firefly optimization technique (FOT), the particle swarm optimization (POS), the Bacteria foraging algorithm, the flower pollination algorithm, the whale optimization algorithm, and many other machine learning algorithms are used to tune controller gains Chaine et al. [22]. Another section of the electrical system has used a computing technique called the Gray Wolf Optimizer algorithm (GWO).
Some authors have investigated sensitivity analysis to confirm the robustness of the suggested controller parameters against system uncertainties when acquired at nominal conditions. The sensitivity analysis against loading variations from their nominal state has also been examined by authors Abazari et al. [23], Dash et al. [24], and Vigya et al. [25]. Nevertheless, the resilience analysis has yet to examine GWO-optimized TLNF-PIDF controller gains in the prior AGC study.
1.1 Research Gap and Motivation
Introducing a new control strategy to address AGC issues is considered excellent research. AGC is a critical aspect of power system operation, and developing innovative control strategies can improve system stability, reliability, and efficiency. Novel AGC techniques contribute to power system control and management advancements, benefiting both utility providers and end users. Conventional controllers are typically optimized for specific environments and may require more efficient operation, especially in interconnected power systems where conditions constantly change because of fluctuating load demands.
- Investigating the dynamic operation of a practical power system with various energy sources in each region is essential. Electrical energy is generated in a control area from multiple sources to supply power for industries, urban areas, and isolated rural regions. Understanding the dynamic behavior of such complex power systems is crucial for ensuring a reliable and efficient energy supply.
- AGC is a critical aspect of power system operation, and developing innovative control strategies can improve system stability, reliability, and efficiency. Novel AGC techniques contribute to power system control and management advancements, benefiting both utility providers and end users.
- Considering the demonstrated effectiveness of the GWO in diverse fields and its successful application in solving various problems, this study aims to investigate the potential of using GWO for the first time to optimize a novel TLNF-PIDF controller for AGC in hydrothermal with wind systems.
- To reduce the ACE, the concept of a multi-area AGC system with integral squared error (ISE) is applied for this study.
- The supremacy of the latter approach can be illustrated by comparing the GWO-optimized TLNF-PIDF controller with other published techniques for handling power and frequency variations in a power system under dynamic conditions.
1.2 Problem Challenge
The ever-growing demands, nonlinearity, and intricacies associated with the power system, together with the strict requirement of the system to perform consistently well and many other changes that are taking place over time in power systems such as the evolution from a regulated to a deregulated environment, ineffective interaction because of variability between different technologies, and hybrid schemes to mention a few make AGC study necessary to explore and accommodate the changes for the innovation of new ideas, techniques, methods, and strategies for dealing with emerging AGC problems. Conventional controllers are typically optimized for specific environments and may require more efficient operation, especially in interconnected power systems where conditions constantly change because of fluctuating load demands.
1.3 Contribution and Paper Organization
- Development of multi-area, multi-source hydrothermal systems integrated with WPPs, considering both mechanical and electrical governors on hydropower systems separately.
- The application of proportional-integration-derivative with filter coefficient (PIDF), NF-PIDF, and the proposed TLNF-PIDF controller is considered the secondary controller with the system developed in (i).
- To apply the GWO algorithm for simultaneously optimizing controller gains in (ii).
- Compare dynamic system responses for various secondary controllers and determine the best controller.
- To investigate the impacts of the WPP on dynamic performance.
- To investigate the effects of GRC on dynamic performance.
- To verify the proposed TLNF-PIDF controller's resilience under various loading scenarios.
The rest of the article is organized as follows:
Section 2 discusses the system design power system in detail, Section 3 discusses the design and modeling of conventional and nonconventional controllers, Section 4 discusses the proposed GWO, and Section 5 discusses the executed results to compare the system performance of the present TLNF-PIDF controller with various MFs. The article is concluded in Section 6, which is followed by references and an Appendix A.
2 Systems Investigated
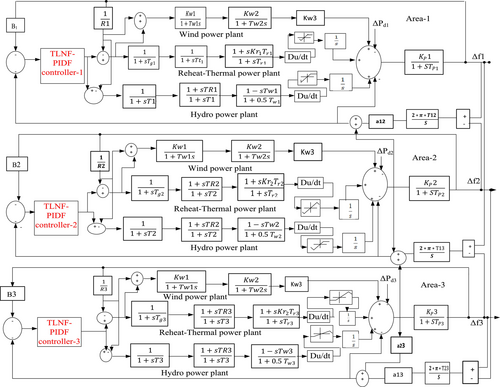
The hydrothermal system, which includes WPPs in all three places, is being examined. The area capacity ratios for areas one, two, and three are 1:3:6. According to Dekaraja and Saikia [24], a GRC of 3% per/min re-heats thermal and hydro systems at 270% per/min for increasing generation and 360% for decreasing generation. The nominal hydrothermal mechanical governor parameter values are obtained from [26], whereas the optimum electric governor parameter values are obtained from Nanda et al. [27] and are presented in the Appendix A. The governor speed regulation parameters, Ri = 4%, are examined. This system dynamics performance is tested for various conventional and intelligent controllers, one at a time. The system dynamics performance responses for all areas were evaluated using a 1% step load disturbance (∆pd). Figure 1 depicts the system's transfer function three-area multi-source model using the TLNF-PIDF controller.
3 Proposed Secondary Controller Design
3.1 Fuzzy Logic Controller (FLC)
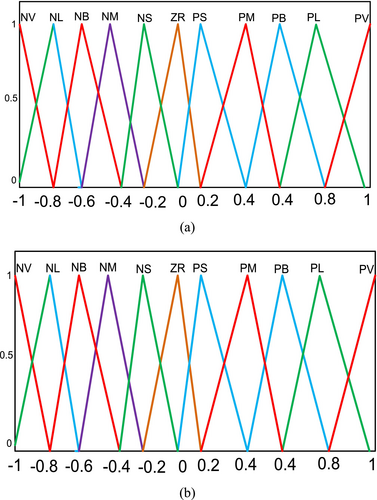
Human reasoning involves a fuzzy controller. However, sufficient caution must be used when developing, modifying, and implementing these systems. Fuzzy logic controllers (FLCs) include defuzzification and fuzzy inference systems based on fuzzy rules. Using a range of MFs, such as triangular, Gaussian, trapezoidal, and so forth, fuzzification transforms binary values into fuzzy values Vigya et al. [28]. The rule base, an if-then rule, clarifies the entire control structure. The rule foundation and MFs need to be adjusted to produce a well-structured fuzzy controller. Since these rules are transformed into fuzzy forms, applying the fuzzy inference system is not feasible. The Mamdani fuzzy interface system (FIS) was utilized to boost the firing power of the rule base, and a widely recognized “center of gravity” defuzzification technique was employed in this investigation. The FLC generates Ko3 as output after receiving two scaling factors, Ki1 and Ki2, as inputs and one output. For outstanding memory usage and processing speed, input–output MFs must be equally described. The literature review states that triangle MFs are the favored option because they are simple to implement using a FIS, use less memory, and are easy to create for real-time applications Tasnin and Saikia, [29]. Eleven MFs are therefore considered for both the inputs and the outputs. All of the MFs have a range of −1 to 1. It transmits the input logic of the proposed FLC, ACEACE, and derivatives of ACE to determine the value for each MF output. The output is generated from each rule basis using Mamdani fuzzy interface system logic. The IF-THEN rule base explains the total control system Ramoji and Saikia, [30]. Eleven MFs are considered for input and output in this situation. Eleven MFs are implemented for input and output in this FLC. PV (positive very high), PL (positive large), PB (positive big), PM (positive medium), PS (positive small), ZR (zero), NS (negative small), NM (negative medium), NB (negative big), NL (negative large), and NV are examples of inputs-output MFs that are equally represented. The values of all MFs range from −1 to 1. For outstanding computation performance and memory utilization, the fuzzy logic control output (Y) Verma et al. [31] is coupled to the PIDF controller Wang et al. [32].
3.2 Artificial Neural Network
The neural network is a biological system that can carry out intricate tasks without the need for explicit quantitative operations. In particular, biological entities can progressively learn over time. The capacity of biological neurons to learn and generalize in response to outside stimuli is reflected in this learning ability. Because of these features, nervous systems are attractive as computational models for handling complex data. For instance, machine learning may be possible given biological organisms' capacity for example-based learning Mishra and Saxena, [33]. Neurons are the foundation of neural networks. The operation of a neural network depends on the information-processing cell known as a neuron. The neural network model is shown in Figure 2 Alhelou et al. [34].
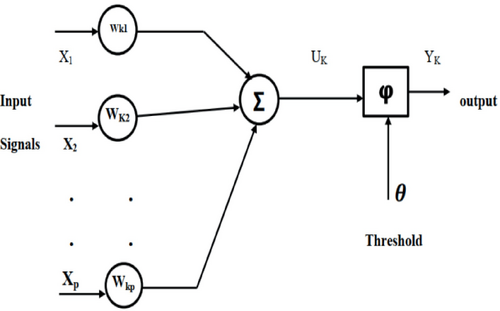
- A collection of synapses or connecting links, each with its weight. At the input of the synapse j connected to neuron k, the synaptic weight wkj is multiplied by a signal xj.
- An added that adds the input signals, weighted by the synapses.
- An activation mechanism that restricts the output of a neuron. The threshold is used to reduce the activation function's net input.
3.3 Hybrid Neuro-Fuzzy Controller
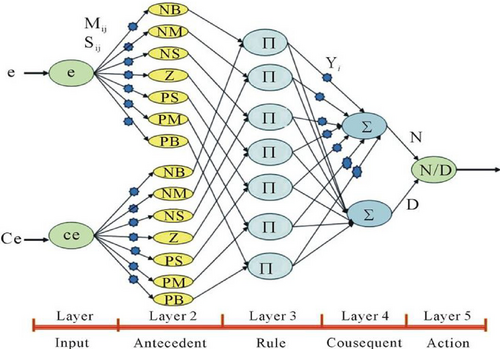
The advantages of the neuro-fuzzy technique, which combines fuzzy systems and neural networks, are described. It creates a model using fuzzy theory to intelligently convey knowledge and neural network learning capabilities to enhance its parameters. The neuro-fuzzy controller's construction is depicted in Figure 3. The most effective artificial intelligence technique uses fuzzy logic control systems and neural networks. The fuzzy logic interface system is represented by the inputs-output data pairs in the systems model Mishra and Saxena [35]. Numerous control applications, such as signal processing, modeling, and decision-making, can benefit from neuro-FISs. Figure 4 shows the inputs' Membership functions of the hybrid neuro-fuzzy controller.
3.4 PIDF Controller
3.5 Design Procedure of Proposed TLNF-PIDF Controller
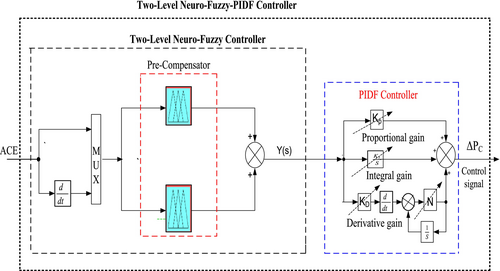
The neuro-fuzzy technique is a hybrid that is well-defined as an artificial intelligence system capable of dealing with complicated and nonlinear engineering processes where traditional control theory is inefficient. Power system stability, despite strong system nonlinearity and performance uncertainty, would benefit specifically from neuro-fuzzy principles to improve its general properties [40]. As previously stated, traditional controllers are often designed to operate the system at its nominal operating point. This is because their combined performance with intelligent controllers is critical in high-load settings and situations such as the disconnection of massively interconnected power networks to preserve system stability. The proposed two-level neuro-fuzzy (TLNF) controller, which combines PIDF (TLNF-PIDF) controllers with flexible operating strategies, serves as a wide-area coordinator. The globally acquired ACE and the change of area control error (∆ACE) are the two main input signal types that feed the proposed TLNF-PIDF controller, shown in Figure 6. Conversely, for extant control devices, it generates a single output signal based on the coordination technique [41]. There are four primary components to the proposed (TLNF-PIDF) controller's design process. The fuzzification stage, fuzzy rule bases, inference system, and defuzzification phase are the primary adjoined components of the TLNF-PIDF controller. The present controller primarily comprises an integrated PIDF block followed by two neuro-fuzzy controllers with identical components connected in parallel. Figure 5 depicts the present TLNF-PIDF controller's structural layout.
4 Gray Wolf Optimizer Algorithm
- Pursuit, tracking, and getting close to the target.
- Challenging, trapping, and intimidating the victim until it gives up.
- Make an assault on the target.
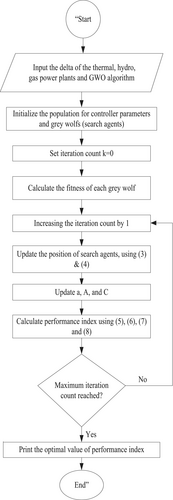
Gray wolves, most individuals want to live in groups of five to 12 individuals. Four varieties of gray wolves, alpha (a), beta (b), delta (d), and omega (γ), are used to simulate the leadership structure. At its foundation, GWO seeks to discover the best solution to a given optimization issue by replicating gray wolves' social behavior and hunting strategies. The mathematical equations applied in the GWO approach primarily concern updating the wolves' positions for each iteration. Here is a simplified summary of the equations used in the algorithm.
4.1 Updating Alpha, Beta, and Delta Wolves
- Dα, Db, are the distance of the current wolf (Xi) from the alpha, beta, and delta wolves respectively.
- α, β, are the positions of the alpha, beta, and delta wolves.
- C1, C2, and C3 are random coefficients in the range (0, 1)
4.2 Updating Pack Members' Positions
- Xnew is the new position of the current wolf.
- A is a coefficient vector in the range (0, 2).
- Daverage is the average distance of the current wolf from alpha, beta, and delta wolves.
4.3 Boundary Checking
After updating the positions of the wolves, boundary checking is performed to ensure that the wolves' positions do not violate any constraints defined by the optimization problem.
4.4 Objective Function Evaluation
Lastly, based on where each wolf is located in the search space, its objective function is assessed. The problem that the GWO algorithm seeks to optimize is represented by this function. These steps are repeated by the algorithm until a termination criterion (such as the maximum number of iterations reached or the satisfaction of the convergence criteria) is fulfilled.
4.5 Cost Function
The frequency change in Area-1, frequency change in Area-1, frequency change in Area-1, and power of the tie-line linking Areas 1 and 2, Areas 2 and 3, and Areas 3 and 1 are represented by the symbols ∆f1, ∆f2, ∆f3, ∆ptie12, ∆ptie23, and ∆ptie31, respectively. With the controller gains obtained for the lowest value of Equation (4) by GWO, the description of the system is achieved. Equations (5-7) calculates the values of the extra JS for comparison.
The six IPFC gain parameters (ka1, kb1, ka2, kb2, ka3, kb3) and the four KP/KI/KD/N gains of the proposed PIDF controller must be adjusted. With the restrictions listed in Equation (8) considered, the controllers' settings are optimized using GWO at the lowest possible cost of Equation (4).
4.6 Performances Evaluation of the Present Optimization
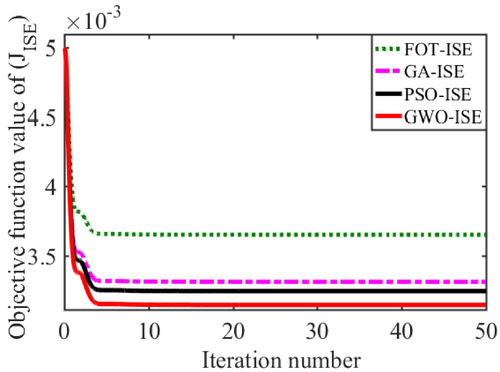
A GWO technique has been presented in the literature by researchers. Because the GWO algorithm can reach faster convergence in fewer iterations, it may outperform existing heuristic and analytical approaches in addressing combinatorial challenges and continuing variable issues [45]. The convergence, robustness, and precision of GWO's effectiveness for optimization are contrasted with those of other metaheuristic algorithms. Figure 7 shows that the outcomes of the suggested GWO are contrasted with those of three popular metaheuristic algorithms: GA, FOT, and PSO [46].
5 Simulation Results and Discussions
5.1 Analysis of the System Dynamics With Different Secondary Controllers
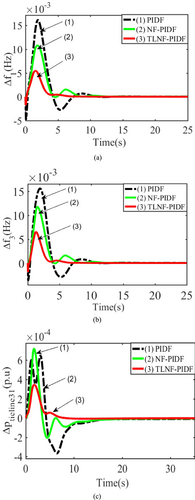
This section presents the time-domain study of a multi-area, hydrothermal gas system with several controllers tuned using the GWO technique for an AGC application. The system is developed with MATLAB/Simulink, and the Appendix A lists the modeling parameters. For 1% SLP and higher load demand, the dynamic behavior of the interconnected hybrid system is investigated. The secondary controllers, PIDF, NF-PIDF, and TLNF-PIDF, are involved with the system one at a time. Table 1 shows the values of the ideal controller parameters following the application of GWO to optimize the controller settings for each case. Every aspect of this power system is impacted by 1% SLP, which creates ideal circumstances for controlling the dynamic performance of the controllers. The comparisons of dynamic responses for the above controllers are illustrated in Figure 8a–c. The values of indices like settling time (Ts), maximum undershoots (UO), and maximum overshoots (OS) are shown in Table 2. Only three of the six dynamic responses are given in this section. The dynamic performances of the new TLNF-PIDF controller are found to outperform others across all time-domain responses, including OS, UO, and Ts, and to exhibit significantly smaller oscillations in a detailed investigation of the dynamic responses in Figure 8a–c. Therefore, the suggested TLNF-PIDF controller will be the main topic of the following parts.
| Controllers | Controller gains | Area-1 | Area-2 | Area-3 |
|---|---|---|---|---|
| TSNF-PIDF | Kpi* | 0.1859 | 0.0401 | 0.0227 |
| KIi* | 0.3056 | 0.0712 | 0.2088 | |
| KDi* | 0.3273 | 0.1439 | 0.1343 | |
| Ni* | 77.8501 | 58.571 | 49.679 | |
| SSNF-PIDF | Kpi* | 0.1859 | 0.0401 | 0.0227 |
| KIi* | 0.3056 | 0.0712 | 0.2088 | |
| KDi* | 0.3273 | 0.1439 | 0.1343 | |
| Ni* | 77.8501 | 58.571 | 49.679 | |
| PIDF | Kpi* | 0.6851 | 0.7951 | 0.7589 |
| KIi* | 0.3531 | 0.7080 | 0.5630 | |
| KDi* | 0.01839 | 0.0498 | 0.0469 | |
| Ni* | 51.7850 | 88.7540 | 58.4389 |
| Control action | Controllers | US | OS | Ts (s) |
|---|---|---|---|---|
| Δf1 (Hz) | TLNF-PIDF | −3.02 × 10⁻³ | 1.00 × 10⁻³ | 8.5 |
| NF-PIDF | −4.51 × 10⁻³ | 1.491 × 10⁻³ | 14.5 | |
| PIDF | −1.17 × 10⁻³ | 6.8 1 × 10⁻³ | 17 | |
| Δf3 (Hz) | TLNF-PIDF | −3.05 × 10⁻³ | 0.87 × 10⁻³ | 9 |
| NF-PIDF | −4.13 × 10⁻³ | 1.276 × 10⁻³ | 13.5 | |
| PIDF | −1.17 × 10⁻² | 5.053 × 10⁻³ | 17.5 | |
| Δptie31 (p.u.) | TLNF-PIDF | −1.48 × 10⁻⁴ | 6.10 × 10⁻⁴ | 17 |
| NF-PIDF | −2.31 × 10⁻⁴ | 3.674 × 10⁻⁴ | 24 | |
| PIDF | −8.82 × 10⁻⁴ | 3.484 × 10⁻⁴ | 26 |
5.2 Comparison of Mechanical and Electric Governor Along Proposed Controller
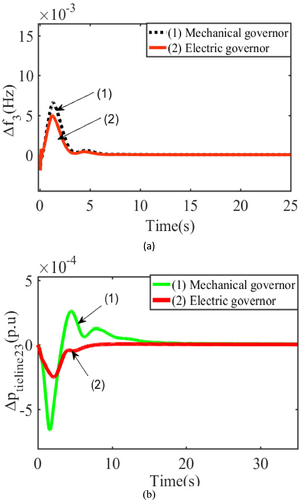
The dynamic response in Figure 9a,b clearly shows that the proposed TLNF-PIDF controller with an electric governor with WPP provides better dynamic response regarding peak deviation, oscillation, and settling time. In regard to peak deviation, oscillation, and settling time, it is shown that an electric governor provides a superior response to a mechanical governor. Electric governors have an advantage over mechanical governors by using electronic components to carry out low-power tasks like speed sensing and droop adjustment. Electronic components provide increased flexibility and better performance. As a result, selecting an appropriate electric governor parameter is essential. Otherwise, incorrect parameter selection results in system response instability.
5.3 Impacts of Wind Power Plant on Dynamic Performance
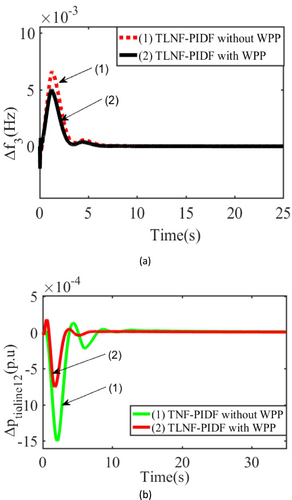
Through the parallel operation, incorporating WPP units into hydrothermal units effectively shares the burden with the hydrothermal system and significantly improves the tie line power exchange connecting one area to another. The dynamic response in Figure 10a,b clearly shows that the proposed TNNF-PIDF controller with an electric governor along with the WPP provides better dynamic response regarding peak deviation, oscillation, and settling time. This demonstrates the significant impact of a WPP incorporated in a multi-area multi-source for electric governors on the AGC study. Table 3 shows the values of the proposed controller parameters following the application of GWO to optimize the controller considering the WPP.
| Controllers | Gains/scaling factors | Area-1 | Area-2 | Area-3 |
|---|---|---|---|---|
|
TLNF-PIDF without wind |
Kpi* | 0.2479 | 0.096 | 0.2183 |
| KIi* | 0.1285 | 0.2980 | 0.1810 | |
| KDi* | 0.0595 | 0.1442 | 0.2454 | |
| Ni* | 60.878 | 77.716 | 56.33 | |
|
TLNF-PIDF with wind |
Kpi* | 0.2933 | 0.222 | 0.5966 |
| KIi* | 0.2735 | 0.552 | 0.354 | |
| KDi* | 0.571 | 0.55 | 0.445 | |
| Ni* | 52.11 | 72.57 | 37.034 |
5.4 Effects of GRC on Dynamic Performance
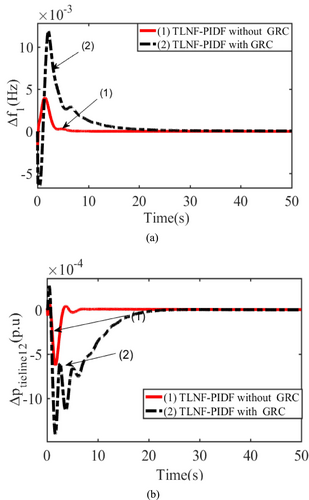
The power-generating units could not rapidly vary their outputs because of the limitations of mechanical and thermal movements. A three-area hydrothermal gas power system is further implemented to demonstrate the nonlinearity of appropriate generating rate limitations. Because the GRC restricts changes to maximum power generation, it prevents unexpected variations in load demand, which can drastically lower the AGC dynamic performance. A comparative analysis of the effect of GRC on the system's performance is depicted, taking into account the hydrothermal-wind coupled power system and the suggested TLNF-PIDF controller. It is evident from the simulation findings in Figure 11a,b that nonlinearity in multi-source units negatively impacts system performance. Table 4 shows the optimized values of the proposed controller parameters after applying with/without GRC.
| Controllers | Controller gains | Area-1 | Area-2 | Area-3 |
|---|---|---|---|---|
|
TLNF-PIDF with GRC |
Kpi* | 0.01139 | 0.0125 | 0.02942 |
| KIi* | 0.0123 | 0.03443 | 0.1693 | |
| KDi* | 0.01993 | 0.01674 | 0.01213 | |
| Ni* | 95.73 | 62.05 | 60.0262 | |
|
TLNF-PIDF without GRC |
Kpi* | 0.1859 | 0.0401 | 0.0227 |
| KIi* | 0.3056 | 0.0712 | 0.2088 | |
| KDi* | 0.3273 | 0.1439 | 0.1343 | |
| Ni* | 77.8501 | 58.571 | 49.679 |
5.5 Sensitivity Analysis With Proposed Controller
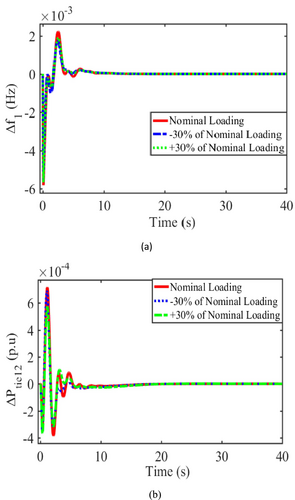
A designed, effective controller should withstand significant variations in operating conditions without experiencing appreciable performance degradation. To put it another way, even if system parameters change, the controller should continue to operate as intended. A sensitivity analysis is performed to validate the robustness of the optimized parameters of the TLNF-PIDF controller obtained at nominal circumstances for notable changes in system parameters. The dynamic response of the all-areas system at nominal and ±30% variation is shown in Figure 12a,b. The parameters change when the system loading changes are evaluated and given in Table A1. A critical analysis of Figure 12a,b reveals that the dynamic reactions stay the same when significant parameter changes occur. As a result, the present method works consistently in various operational settings. Thus, it is reasonable to conclude that load variation has a minimal effect on system dynamic performance. The authors conclude that since the load requirement varies over time, there is no need to reset the controller repeatedly.
6 Conclusion
A novel optimized TLNF-PIDF-based AGC improves the dynamic responses of a hybrid hydrothermal power system in WPPs. The input–output scaling factors and gains of the proposed hybrid TLNF-PIDF controller are effectively optimized by the GWO. The GWO-based TLNF-PIDF controller proposed here is pitted against the traditional GWO-NF-PIDF and PIDF controllers. According to the simulation results, the proposed GWO-TLNF-PIDF controller outperforms classical controllers. An electric governor outperforms a mechanical governor in terms of peak deviation, settling time, and system oscillation. WPP units integrated with hydrothermal units effectively share the load with the hydrothermal system and significantly improve tie-line performance by operating in parallel. WPP units integrated with hydrothermal units effectively share the load with the hydrothermal system and substantially improve tie-line power exchange from one area to another by operating in parallel. The system dynamic response of the AGC method demonstrates that considering both with and without taking GRC into account, the electric governor provides a better response than the mechanical governor. The simulation results show that by comparing the PIDF controller response with and without addressing the impacts of nonlinearity, the optimized TLNF-PIDF controller ensures the least damping oscillation and good settling. A sensitivity analysis was used to evaluate the effectiveness of the present controller by changing the system settings by ±30% loading. It shows that the TLNF-PIDF controllers with the optimal KP, KI, KD, K1, K2, and K3 values acquired under the nominal loading condition are highly resilient and do not require resetting for significant changes in the system loading circumstances. The optimized TLNF-PIDF-based AGC controller integrating wind energy sources reduces oscillation amplitude by 67.59% on average, significantly less than the solely a single-level conventional controllers.
6.1 Future Research Work
- Explore different AGC control algorithms and make appropriate load and weather estimations for small- and large-scale renewable energy-based power systems.
- To research intelligent technology techniques for programming the AGC algorithms to activate the optimal reserves to guarantee the power system's seamless functioning when renewable energy sources are widely integrated.
Author Contributions
Getaneh Mesfin Meseret: conceptualization, methodology, investigation, writing – original draft, writing – review and editing, data curation, formal analysis, visualization, supervision, project administration, software. Rajesh Kumhar: software, data curation, resources, writing – original draft. Tarkesh Kumar Mahato: validation, funding acquisition, resources. Poonam Lakra: funding acquisition, resources, writing – original draft. Babli Kumari: resources, funding acquisition, writing – original draft. Nishant Kumar: resources, funding acquisition, writing – original draft.
Conflicts of Interest
The authors declare no conflicts of interest.
Appendix A
Data From the System Under Nominal Conditions
“Pr1 = 2000 MW, Pr2 = 6000 MW, Pr3 = 12,000 MW, assume initial loading = 50%, f = 60 Hz, B1 = B2 = R3 = 0.4250 p.u.MW/Hz, Ri = 2.40 Hz/per unit MW, Tg = 0.080 s, Ptie,max = 200 MW, Tr = 10 s, Kr = 0.5, Hi = 5 s, Tt = 0.3 s, Di = 8.33*10−3 p.u.MW/Hz, a12 = −1/3, a23 = −1/2, a13 = −1/6, T12 = T23 = T13 = 0.0866 p.u.MW/rad, TR = 5 s, Kp1 = Kp2 = Kp3 = 120 Hz/p.u.MW, Tp1 = Tp2 = Tp3 = 20 s. Wind power: 50*2 MW, Kw1 = 1.4, Kw2 = 1.25, Kw3 = 0.080, Tw1 = 0.6 s, Tw2 = 0.040 s. Hydro plant: Electrical governor parameters, kdh = 0.270, kph = 1.0, kih = 2.40, Tw = 1.0 s.”
| System loading | Kps in Hz/p.u.MW | Tps in sec. | D in p.u.MW/Hz | B in p.u.MW/Hz | Tw in sec. |
|---|---|---|---|---|---|
| 50% | 120.0 | 20.00 | 8.33*10−3 | 0.425 | 1.00 |
| 80% | 75.0 | 12.5 | 0.0133 | 0.43 | 2.56 |
| 20% | 300 | 50 | 0.0033 | 0.42 | 0.16 |
Open Research
Data Availability Statement
Data sharing is not applicable to this article as no new data were created or analyzed in this study.


