Evaluation of Climate Hazards Group InfraRed Precipitation Station (CHIRPS) satellite-based rainfall estimates over Finchaa and Neshe Watersheds, Ethiopia
Abstract
Recent advancements in the field of remote sensing have led to the development of high resolution satellite-based rainfall products to improve the quality of observed rainfall data through proper evaluation and validation process of the products. This study therefore, intended to evaluate the performance of CHIRPS (Climate Hazards Group InfraRed Precipitation Station) satellite-based rainfall products in Finchaa and Neshe watersheds of Blue Nile Basin. Daily ground- and satellite-based rainfall data are collected from Ethiopian National Meteorological Agency and CHIRPS dataset of CHG (Climate Hazards Group) respectively, for the time slice of 25 years (1991–2015). The performance of CHIRPS product is evaluated using quantitative statistical performance indicators and graphical comparison methods. CHIRPS satellite product tends to slightly overestimate the mean rainfall depth at the study area. A positive strong linear correlation (R = 0.93 and R2 = 0.86) and a smaller amount of noise, bias and error (NSE = 0.84, PBIAS = 0.98%, and RMSE = 46.99 mm) have been found between CHIRPS satellite-based and the ground-based rainfall products when compared. The overall results in this study also indicated the good performance of CHIRPS satellite-based rainfall estimates in maintaining patterns of observed measurements at monthly, seasonal and annual time steps across the watersheds.
1 INTRODUCTION
Rainfall is the primary source of water on the earth and it is the important phase of water transfer between lithosphere, hydrosphere, and atmosphere—hydrologic cycle. Rainfall data have invaluable purposes in the studies of agriculture, ecosystem, and various engineering activities. Therefore, availability of accurate and robust ground-based—observed—rainfall data in a given planning unit or region has a milestone benefits. However, in many parts of the world accurate and consistent observed rainfall data are limited mainly due to poor and/or uneven and sparse distribution of rain gauge stations network across a given geographical area. Nowadays, a technological advancement in remote sensing technologies such as satellite-based rainfall estimates have become good alternatives and better options to bridge the gap.
Satellite-based products are very vital to address limited data challenge and improve its quality where ground based hydro-meteorological data are highly scarce, particularly in developing countries. Many researchers have outlined the importance of satellite-based rainfall data in various purposes such as: drought and environmental monitoring, early warnings, and flood forecasting as they need robust rainfall estimate both in time and space.1-5 The satellite-based rainfall products also provide continuous spatial measurements of the rainfall than rain gauges6 and it is available over most oceanic and unpopulated land areas.7 Recent developments in global satellite estimates products capable of high spatial (finer than 0.25° × 0.25°) and temporal (less than 3 h) resolutions widely used by many researchers in different countries or regions8-17 to evaluate the accuracy the products at different time scales, climate conditions and topographic features and use it for purposes such as for hydrological modeling. Results from numerous studies are promising to improve the quality of observed rainfall with a considerable bias and error correction due to (1) the indirect relationship nature of observation and estimates; (2) the inadequate sampling; and (3) algorithmic imperfections.7, 18
Several attempts have been made to evaluate the accuracy of satellite-based rainfall estimates in different parts of Ethiopia. Hirpa and others17 tried to evaluate three high-resolution (3 h and 0.25° × 0.25°) satellite-based precipitation products (Tropical Rainfall Measuring Mission [TRMM] Multisatellite Precipitation Analysis [TMPA] 3B42RT, the NOAA/Climate Prediction Center morphing technique [CMORPH], and Precipitation Estimation from Remotely Sensed Information using Artificial Neural Networks [PERSIANN]) as function of elevation and comparing with rainfall measurements over very complex terrain of Ethiopia (Awash basin). They obtained similar bias, spatial structure, elevation-dependent trend, and distribution function for 3B42TR and CMORPH products unlike the PERSIANN product. PERSIANN rainfall product value was higher than the observed rainfall in high-elevation areas. Using four widely used high-resolution satellite products, Bitew et al19 performed evaluation for hydrological modeling of stream flow simulation in Koga sub-basin of Blue Nile Basin. Their results show significant biases in the satellite rainfall estimates.
Another study also conducted to assess the accuracy of the CMORPH, TMPA-RT v7, and TMPA-RP v7 satellite rainfall estimates, with a spatial resolution of 0.25° × 0.25° and a temporal resolution of 3 h, in Blue Nile Basin at two sites that represent contrasting topographic features.20 The result revealed that, all products considered in the study tend to overestimate and underestimate the mean rainfall rate at low-land plain and highland mountain sites, respectively. Romilly and Gebremichael21 evaluated three satellite products across six major river basin of Ethiopia and obtained the better overall performance of the microwave-based products (TMPA 3B42TR and CMORPH) than the infrared-based product (PERSIANN). In the Lake Tana watershed, MPEG (Multi-sensor Precipitation Estimate-Geostationary) and CFSR (Climate Forecast System Reanalysis) satellite products provided the most accurate rainfall estimates.22 TRMM 3B42 rain product shows relatively a better performance at daily, monthly, and seasonal time scales over Eastern parts of Ethiopia.23
One of the most recent and high resolution is rainfall product maintained and distributed by the Climate Hazards Group (CHG). The CHG provides at rainfall estimates from 1981 to the near present with 0.05° spatial resolution and global coverage. The Climate Hazards Group Infrared Precipitation (CHIRP) and the CHIRP blended with ground-based station data (CHIRPS) are the two products of CHG. CHIRP product is available almost immediately whereas CHIRPS product is available after some delay.2, 18 CHIRPS product is widely used because it is blended with observation rainfall; it is relatively new and with high spatiotemporal resolution; it is based on multiple data sources and it is free accessed.3, 18, 24
A considerable amount of literature has been published on evaluation and validation of CHG products particularly, CHIRPS Satellite-based rainfall product around the globe. For instance, Paredes et al3 compared CHIRPS gridded product and rain gauge data over Venezuela. They obtained a better performance skills of the product. Zambrono-Bigiarini et al25 compares seven Satellite-derived rainfall estimates (SREs) products including CHIRPS in representing observed rainfall across the complex topographical and climate gradients of Chile. CHIRPS was selected as one of the good skillful product as it showed a promising potential to be used in meteorological studies and water resource assessments. Shrestha et al18 also evaluated the accuracy of the two CHG products and obtained that the station blended satellite product (CHIRPS) performed slightly better than satellite only product (CHIRP) in one of the major tributary river of the Ganges (the Koshi River) within Nepal. Other comparison and validation studies conducted in Mozambique,26 Brazil,27 China,28 Italy,29 and Cambodia30 also revealed a better performance of CHIRPS product dataset in reference with the observed rainfall data. Le and Pricope31 used CHIRPS satellite rainfall estimates to improve the accuracy of runoff and stream flow simulation for hydrological modeling. Similarly, Tuo et al32 compared CHIRPS rainfall product with other three products to investigate their impacts on SWAT hydrological model simulations.
Gebrechorkos et al33 evaluated the accuracy of the Africa Rainfall Climatology version 2.0 (ARC2), CHIRP, CHIRPS, Observational-Reanalysis Hybrid (ORH), and regional climate models (RCMs) datasets against station data obtained from Ethiopia, Kenya, and Tanzania. The evaluation was undertaken by comparing point to pixel, point to area grid cell average, and stations' average to area grid cell average at daily, dekadal, and monthly timescales covering the period of 1983–2005. The evaluation revealed that CHIRPS, CHIRP, and ARC2 are the best performing rainfall products on daily, dekadal, and monthly temporal scales. Moreover, remotely sensed TMPA V7 3B42, PERSIANN-CDR, CHIRPS, and ARC2 rainfall datasets were also assessed over four homogeneous zones in Kenya with gauge-based data during 1998–2016. Results show that variations of the products are based on complex geomorphology of different climatic zones. For instance, PERSIANN-CDR performs better along low altitudes and humid climate whereas ACR2 has better skill over highlands regions of Kenya.34 The performance of CHIRP satellite rainfall was evaluated and its bias was corrected before it was used as input into a hydrological model for streamflow simulation at Meki and Katar catchments. The simulation result suggested that the potential of bias-corrected CHIRP rainfall estimate could be used for water balance studies.35 Mussie et al36 compared the hydrological performance of four satellite-based precipitation products (CFSR, CHIRPS, PERSIANN-CDR, and TRMM) in two watersheds of the Lake Ziway basin and showed that the CHIRPS rainfall product provides valuable input dataset for hydrologic models in the data scarce area.
Furthermore, in Ethiopia, a number of research outputs have been reported on the validation of CHIRPS satellite-based rainfall product. Dinku et al37 compared the two CHG products (CHIRP and CHIRPS) with ground-based rainfall data and simultaneously with the African Rainfall Climatology version 2 (ARC2) and the Tropical Applications of Meteorology using Satellite data (TAMSAT) products at daily, decadal (10 day), and monthly time scales. CHG products were better than both ARC2 (significantly) and TAMSAT (slightly) at decadal and monthly time scales across East African countries including Ethiopia, Tanzania, and Kenya. Ayehu et al24—also compared CHIRPS and other three SREs products (TAMSAT2, TAMSAT3, and ARC2) with ground-based data—found a better performance of CHIRPS and validated it as to be used for pattern and variability analysis across Blue Nile River Basin. Another evaluation work conducted in Upper Blue Nile Basin found a better skill of CHIRPS and even it was selected as the best performer to assess the variability of meteorological drought in the basin,38 and for stream flow simulation in data scarce areas.39 Gebremicael et al40 also strengthen that the good consistency of CHIRPS product and its comparison with ground observation in Tekeze-Atbara Basin at different space (point, sub-basin, basin) and time (daily, monthly, seasonal) scales. However, most studies in validating CHIRPS product have only been carried out in a limited number of areas, particularly in Upper Blue Nile Basin and covering wide areas.
CHIRPS dataset provides the finest spatial resolution (0.05° × 0.05°) and the long-terms series (1981 to near present) than TRMM 3B42 (1998—present, 0.25° × 0.25°); CMORPH (1998—present, 0.07° × 0.07°); PERSIANN (1983—present, 0.25° × 0.25°); GsMaP (2000—present, 0.10° × 0.10°); ARC2 (1983—present, 0.1° × 0.1°); CMAP (1998—present, 0.25° × 0.25°); RFE2 (2001—present, 0.1° × 0.1°); and GPM IMERGE (2014—present, 0.10° × 0.10° resolution) rainfall estimate.28, 41 High spatial resolution allows to use the product in small watersheds like the case of the current study and reduces uncertainties and errors. Despite its good performance across the upper Blue Nile24, 39 and in other regions and basins,33, 40 likewise the other satellite precipitation products, CHIRPS rainfall estimate depends not only on the embedded algorithm but it also largely depends on the location, topography, season, and hydro-climatic characteristics of the study area.40, 41 Finchaa and Neshe watersheds are characterized by tepid to cool and sub-humid mid-highlands and moist mid-highlands, and the lowlands in the north eastern parts of the basin being hot to warm moist lowlands. The elevation of the watersheds ranges approximately between 880 and 3200 m a.s.l. The western and southern part of the sub-basin are higher in altitude (greater than 2200 m a.s.l up to 3200 m a.s.l) on the other hand, the lowlands have lower altitude less than 1400 m a.s.l in the northern parts of the watersheds.42 Accordingly, analyzing the accuracy and applicability of CHIRPS satellite-based rainfall product in Finchaa and Neshe watersheds is mandatory prior to its application for different purposes.
In general speaking, satellite-based rainfall estimates provide a crucial and continuous spatial data source, specifically in developing countries like Ethiopia in which the distribution network of rain gauge stations are erratic, sparse and uneven across a geographical areas and uneconomical to do so. Ethiopia has 12 hydropower stations covering 88% of the current energy source of the country. Two of them (Finchaa and Amerti-Neshe) are located in the study watersheds and covering 12.75% of the present national hydropower supply.43 Majority of hydropower stations of Ethiopia, recently, including Finchaa and Neshe power stations facing a shortage water to generate power as of their potentials. Intermittent power supply system, hence, is commonly practiced in the country as a measure. This is probably not only due to the growth of population and socio-economic situation of the country, it may also because of climate change and variability that causes the decline of the water head required to generate power. Rainfall is the main and only hydrological input to the reservoirs. In light of this, it is very crucial to accurately estimate rainfall in the area. Motivated by the need for accurate rainfall data in the study area and the importance of CHIRPS satellite rainfall dataset for various application, this study was aimed to evaluate the performance of CHIRPS satellite-based rainfall product in Finchaa and Neshe watersheds of Blue Nile Basin.
The remainder of this paper is organized as follows: Section 2 provides a brief description of data and methods which describes of the study watersheds; presents the ground-based and satellite-based datasets and the statistical performance evaluation methods. Section 3 presents the detailed results and discussion based on the analysis CHIRPS rainfall products. Finally, Section 4 summarizes main findings and presents suggestion for future studies.
2 MATERIALS AND METHODS
2.1 Description of the study watersheds
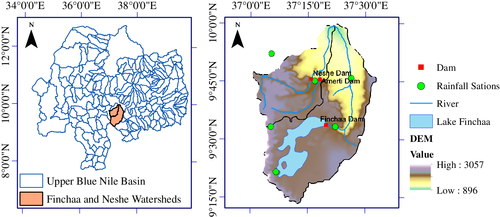
The study covers Finchaa and Neshe watersheds, with a total area of 4154 km2. Both watersheds are located in the southern part of Blue Nile River Basin (called Abbay River Basin). They are located between 9.25° to 10.0° N and 37.25° to 37.75° E in the Horro Guduru Wollega zone administration boundary. Three artificial lakes/reservoirs, namely Finchaa, Amerti and Neshe dam that primarily constructed for the purpose of power generation are existed in the study watersheds. Amerti and Neshe dam are located in Neshe watershed, however, Amerti dam is constructed for the purpose of transferring water to Finchaa dam to supplement it through underground pipe connections. Regarding the relief of the watersheds, Finchaa and Neshe sub-basins are highly dominated by rugged topography. The altitude of the study area ranges between 2444 m and 1350 m above sea level. Arable land, pasture land, forest land, swampy land, degraded land, and construction land are the major land uses in the watersheds. The major crops grown in the watershed are teff, wheat, barley, sorghum, maize, millet, oats, lentils, bean, peas, sesame, vegetables, and fruits.42, 44, 45 Sources of water for different purposes are mainly from springs and wells for rural community. The geographical location of both study watersheds, meteorological stations, and reservoirs are illustrated in Figure 1.
Average annual rainfall is uncertain, but estimated as more than 140 cm, the bulk falling in the main rainy season (kiremt season)—June through September. Based on the station average data, the contribution of main rainy season to the total annual rainfall varies between 68 and 78% on average about 73%, whereas the short rainy season contributed 14%–20% on average about 17% of the total annual rainfall per year at basin level. Together with the contribution of short rainy season, main rainy season contributes 88%–93% on average about 90% of total annual rainfall across the Finchaa and Neshe watersheds. Due to the dominancy of JJAS season (kiremt season) rainfall in the annual rainfall the long year graphical pattern of annual and main rainy season looks the same. In average, July, August, June, September, and May contributes 23, 21, 15, 14, and 10% to the total annual rainfall. July and August (June and September) rainfall was accounted for about 59% (41%) of the main rainy season in the watersheds.
2.2 Ground-based rainfall data
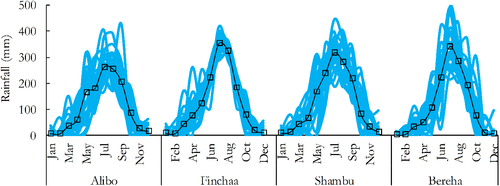
Observed (ground-based) daily rainfall data of six independent stations (namely, Alibo, Bereha, Finchaa, Hareto, Neshe, and Shambu) found inside the selected watersheds was collected from the Ethiopian National Meteorological Agency and Finchaa Sugar Estate meteorological station (Bereha Station) for 25 years (from January, 1991 to December 2015). The range of years selected were based on the availability of recorded rainfall data at all selected stations. The data quality and homogeneity (consistency) analysis was performed for all targeted stations. Station average and Normal ratio (Simple Proportion) methods were used to fill the missing rainfall data based on McCuen46 criteria. The monthly observed rainfall of the study area is presented in Figure 2 for each station considered in current study. Figure 2 illustrates the comparison of the mean monthly rainfall depths and ranges of observed monthly values for Alibo, Finchaa, Shambu, and Bereha stations during the study period (1991–2015).
Double mass curve method was used to check the consistency and homogeneity of rainfall data and for adjustment of the inconsistent rainfall data. Initially, six stations were selected for the study. However, due to the larger number of missed data and inconsistency with their neighbor stations, the rainfall data of Hareto and Neshe stations were excluded from the analysis. Therefore, the number of stations considered in this study are reduced into four stations having good data quality and homogeneity (Table 1).
| No | Station | Longitude (°) | Latitude (°) | Altitude (m) | Missed data (%) | Start year |
|---|---|---|---|---|---|---|
| 1 | Alibo | 9.89 | 37.07 | 2513 | 12.52 | 1984-now |
| 2 | Finchaa | 9.57 | 37.37 | 2248 | 9.71 | 1989-now |
| 3 | Shambu | 9.57 | 37.12 | 2460 | 8.07 | 1984-now |
| 4 | Bereha | 9.78 | 37.38 | 1410 | 8.03 | 1979-now |
| 5 | Hareto | 9.35 | 37.12 | 2260 | 25.35 | 1986-now |
| 6 | Neshe | 9.76 | 37.28 | 2060 | 22.30 | 1986-now |
2.3 Satellite-based rainfall data
Climate Hazards Group InfraRed Precipitation with Station data (CHIRPS) is a more than 30 years (starting in 1981 to near-present) quasi-global rainfall dataset, which is developed by the United State Geological Survey (USGS) and the Climate Hazards Group at the University of California, Santa Barbara. CHIRPS incorporates 0.05° resolution satellite imagery with in-situ station data to create gridded rainfall time series for trend analysis and seasonal drought monitoring. The data sources that are used to produce the CHIRPS rainfall product are the monthly accumulated climatological precipitation (CHPClim); geostationary satellite observations in the infrared (IR) channel from the NOAA data sources, product of the Climate Prediction Centre (CPC) and the B1 IR of the National Climatic Data Centre (NCDC); precipitation estimated by the TRMM 3B42 product from NASA; the rainfall field of the NOAA atmospheric model, Climate Forecast System version 2 (CFSv2); and observations of precipitation in situ, obtained from national and regional meteorological services. The CHIRPS incorporates satellite information in three ways: (i) by using satellite means to produce high resolution precipitation climatologies (CHPclim), (ii) by using CCD fields to estimate monthly and pentadal precipitation anomalies, and (iii) by using satellite precipitation fields to estimate local distance decay functions.2, 6, 27, 48
The development algorithm of CHIRPS dataset involves several procedures. First, building high resolution (0.05° ≈ 5 km) global gridded monthly mean precipitation—CHPclim datasets—to leverage the inconsistent and sparse long-term historical gauge observations. CHPclim is created from monthly historical long-term mean values of stations obtained from the Agromet Group of the Food and Agriculture Organization of the United Nations (FAO) and the Global Historical Climate Network (GHCNv2). Second, incorporating daily, pentadal and monthly 1981 to present 0.05°-based infrared Cold Cloud Duration (CCD) precipitation estimates. The CHIRP estimation procedure uses a fixed CCD threshold of 235°K and calibrates the CCD regressions using 2000–2013 0.25° resolution TMPA 3B42 pentadal precipitation. Pentad—the primary computing time step for the CHIRP—either disaggregated to daily or aggregated to dekadal and monthly time steps based on coupled forecast system (CFS) fields rescaled to 0.05° resolution. Third, merging observed station data provided by National Meteorological Agencies with data from public data stream and several private archives. It produces a preliminary information product with a latency of about 2 days and a final product with an average latency of about three weeks. Finally, blending CHIRPS station data incorporating the spatial correlation using modified Inverse Distance Weighting interpolation technique. CHIRPS time series data are used to define local decorrelation distance where the estimated point-to-point correlation is zero. For any given pixel, the CHIRPS blending procedure is based on a weighted average of the ratios between the five closest stations and CHIRP.48
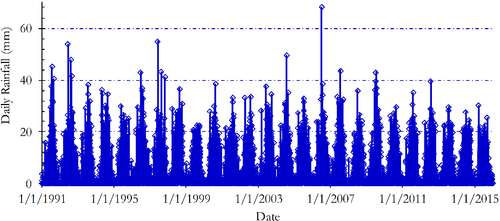
The latest product is the Version 2.0 (CHIRPS v.2) dataset that was completed and released in February 2015. In Ethiopia 76 rainfall stations data are blended with CHIRPS satellite estimates product.48 For this study the daily time scale precipitation depth data of CHIRPS product was downloaded from http://chg.geog.ucsb.edu/data/chirps/ for the time period of 1991–2015. Comparison of Satellite-based and ground-based rainfall products was undertaken according to the approach used by Shrestha et al18 for the similar reason. The arithmetic average of pixels surrounding the rain gauge stations was used to represent CHIRPS. For each station mean twenty five (25) CHIRPS original pixels with 0.05° × 0.05° resolution in 0.25° × 0.25° grid were used to cover a wider area of the watersheds (Figure 3). Accordingly, for Shambu, Alibo, Finchaa, and Bereha station the CHIRPS pixels in the grid between 9.5° to 9.75° N and 37.0° to 37.25° E, 9.75° to 10.0° N and 37.0° to 37.25° E, 9.5° to 9.5° N and 37.25° to 37.5° E and 9.75° to 10.0° N and 37.25° to 37.5° E respectively were arithmetically averaged. Figure 3 illustrated the daily rainfall (spatially averaged) of CHIRPS dataset across the study watersheds. It shows that 90, 95, 99, and 99.9% of daily rainfall events between 1991 and 2015 did not exceed 13.25, 18.1, 27.5, and 43 mm respectively. In the current study, the CHIRPS satellite data were accumulated to daily totals from 06Z to 06Z to make comparison with ground-based rainfall data. Then after, the daily CHIRPS rainfall product and observed rainfall were arranged at monthly, seasonal, and annual time scales in order to compare them graphically and statistically and draw conclusion.
2.4 Statistical analysis
Five quantitative statistical parameters were used to evaluate the performance of CHIRPS satellite rainfall product in reference to observation rainfall.22, 27, 49, 50 These are; Pearson correlation coefficient (R), coefficient of determination (R2), root mean square error (RMSE), Percent Bias (PBIAS), and Nash Sutcliffe Efficiency (NSE). The descriptions and mathematical equations for each statistical indicator were given in Table 2 and Equations 1-5) respectively. In addition, the ability of CHIRPS product was evaluated by comparing with observed rainfall for all selected stations using graphs for different time scales.
| Parameter | Description |
|---|---|
| R | It is the measure of degree of linear relationship between observed and CHIRPS data. It ranges from −1 to 1. Zero represents no linear relationship |
| R2 | It compares the explained variance of modeled (CHIRPS) data with the total variance of the observed data and the value ranges from 0 to 1. |
| RMSE | It is one of the error indices and use to measure of the difference between observed and CHIRPS values. The value of 0 represents the perfect fit. |
| PBIAS | It has also been calculated between the observed and CHIRPS. It indicates the systematic error (larger or smaller than observed) in rainfall amount. |
| NSE | It determines the relative magnitude of variance of residues and measured data. It ranges from –∞ to 1 with 1 being the optimal value. |
Where: n refers to the number of samples; Obsi means observed precipitation from rain gauge stations, CHIRPSi means the precipitation estimates from the CHIRPS product; means the average observed precipitation from rain gauge stations, means the average precipitation estimates from the CHIRPS product.
3 RESULTS AND DISCUSSION
In order to validate the application CHIRPS satellite-based rainfall product in Finchaa and Neshe sub-basin of Blue Nile Basin, comparison with ground-based rainfall data was performed on the basis of annual, seasonal, and monthly time scales using graphical and statistical metrics as presented in the forthcoming sections.
3.1 Statistical performance analysis
The performance of the CHIRPS satellite-based rainfall estimates was evaluated based on five (5) statistical performance evaluation criteria including Pearson correlation coefficient (R), coefficient of determination (R2), RMSE, PBIAS, and NSE at monthly time scale (Table 2). The results obtained from these evaluation criteria indicated that the CHIRPS satellite rainfall estimates performed well as compared with ground-based rainfall observation. In Table 3, the higher R, R2, and NSE and the lower RMSE and PBIAS values showed the good performance of satellite-based rainfall estimates at monthly time scale for the respective station.
| Statistical parameter | Shambu | Alibo | Finchaa | Bereha | Average |
|---|---|---|---|---|---|
| R | 0.94 | 0.91 | 0.94 | 0.92 | 0.93 |
| R2 | 0.89 | 0.83 | 0.88 | 0.85 | 0.86 |
| PBIAS | −8.17 | −12.34 | 9.02 | 7.56 | −0.98 |
| RMSE | 43.14 | 50.11 | 44.13 | 50.56 | 46.99 |
| NSE | 0.87 | 0.78 | 0.87 | 0.84 | 0.84 |
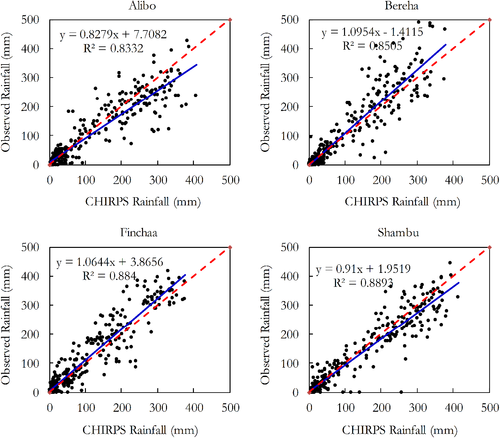
The Pearson correlation coefficient (R) value ranged from 0.91 (at Alibo station) to 0.94 (at both Shambu and Finchaa stations) across all stations with the average value of 0.925 showing the good efficiency of CHIRPS satellite-based product in capturing the observed measurement of rainfall of the study area. The obtained R values indicate that there is a strong positive linear relationship between monthly mean ground-based rainfall and CHIRPS satellite-based rainfall estimates in Finchaa and Neshe watersheds of Blue Nile River Basin. Figure 4 shows the scatter plot of 1200 months (12 months/year × 25 year × 4 station) of observed and CHIRPS satellite-based rainfall estimates with linear line and equation. These results match with those observed in earlier study of Dinku et al37 who found the R value of 0.93, 0.86, and 0.83 in Ethiopia, Tanzania, and Kenya respectively for the monthly rainfall of CHIRPS satellite derived product. The result also supports the previous studies of Ayehu et al,24 Paredes et al,3 Bayissa et al,38 Nogueiro et al,27 and Hessels6 who found the R value of 0.88 (in Blue Nile), 0.83 (in Venezuela), 0.82–0.95 (in Blue Nile), 0.96 (in Brazil), and 0.81–0.90 (in Blue Nile) respectively for CHIRPS remote sensing rainfall data on monthly time step.
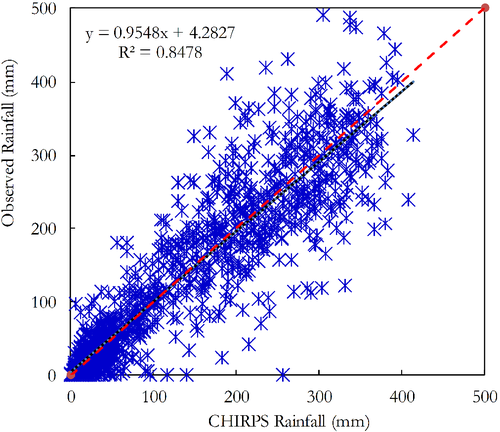
The results of this study indicate that the coefficient of determination (R2) values were 0.89, 0.83, 0.88, and 0.85 for Shambu, Alibo, Finchaa, and Bereha stations respectively, with the average value of 0.86 at watershed level. A scatter diagram and a Pearson's product moment correlation were used to determine the relationship between CHIRPS and observed rainfall. It shows a good collinearity between mean ground-based rainfall and CHIRPS satellite-based rainfall estimates in Finchaa and Neshe watersheds. The intercept value was close to zero and the gradient/slope was also close to one (close to 1:1 line) for all stations indicating the good agreement between the variance of ground-based rainfall and CHIRPS satellite-based rainfall estimate products. The scatter plot of CHIRPS and observed monthly rainfall for all stations are presented in Figure 5. The findings of the current study are consistent with those of Bayissa et al38 and Duan et al29 who found R2 of 0.86 and 0.84 (at watershed scale) respectively. Shrestha et al18 found that the R2 value ranging 0.69–0.73 for different physiographic regions of Nepal through comparing CHIRPS and observed monthly rainfall. Accordingly, the current study obtained the better collinearity between CHIRPS satellite-based and ground-based rainfall observation across Finchaa and Neshe watersheds.
The most interesting finding was that the obtained NSE value varied from 0.78 (at Alibo station) to 0.87 (both at Shambu and Finchaa stations). At watershed level the value of NSE was 0.84 (Table 3) which indicates that less noise (residual variance) of CHIRPS satellite-based rainfall product in Finchaa and Neshe watersheds. It indicates the better fit of satellite- and ground-based data to 1:1 line. According to Moriasi et al51 performance rating recommendation for a monthly time step, the obtained NSE values ware rated as very good (NSE ≥ 0.75) for all stations. This finding is highly in agreement with Dinku et al37 findings which obtained the NSE of 0.87 (in Ethiopia). Nogueira et al27 found a higher value of NSE (0.96) for precipitation during the period from July 2009 to June 2015, which shows the better performance of CHIRPS estimates in the South-Southeast Region of Minas Gerais State—Brazil. The reason behind this is probably arise from the difference in the length time span considered and the quality of ground-based rainfall data used for the studies.
The current study found that the mean bias percentage (PBIAS) of −0.98% (Table 3). The highest bias was obtained in Alibo station (−12.34%) followed by Finchaa station (9.02%) whereas, the minimum bias percent was seen in Bereha station (7.56%) followed by Shambu station (−8.17%). It shows small bias or systematic error between satellite-based and ground-based rainfall products. Based on the recommended performance evaluation criteria rating ranges (originally for sediment) given by Moriasi et al,51 the CHIRPS satellite-based product was rated as very good in preserving the mean monthly rainfall of the study area. Because the obtained PBIAS values were fall in the range of ±15%. This finding is in agreement with Dinku et al,37 Ayehu et al,24 Nogueira et al,27 Bayissa et al,38 and Gebremicael et al40 findings which found that PBIAS of 0.96, 0.9%, 5.42, 0.8%–1.2%, and −8% respectively.
Further statistical tests revealed that the RMSE values between mean monthly ground-based rainfall and CHIRPS satellite-based rainfall estimates were less than 50.56 mm/month (Table 3). The maximum (minimum) difference between ground-based rainfall and CHIRPS satellite-based rainfall estimates at monthly time step was 50.56 mm/month (43.14 mm/month) in Bereha station (Shambu station). At watershed level 46.99 mm/month error was obtained (Table 3). The present findings seem to be consistent with other research outputs which found RMSE value ranged from 16 to 100 mm from the comparison of monthly rainfall of CHIRPS satellite-based and ground-based rainfall estimates.24, 27, 29, 38, 40 Taken together, the statistical performance indicators show that CHIRPS satellite rainfall estimate well reproduce ground-based rainfall dataset in Finchaa and Neshe watersheds. Therefore, the comparison of stations' average to area grid cell average suggests that CHIRPS dataset as an alternative source of rainfall data in the study area where observation stations are irregularly positioned and often clustered around population centers.52
3.2 Evaluation at monthly scale
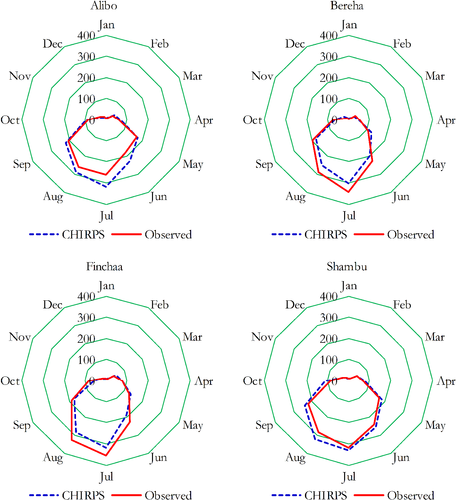
The mean monthly rainfall graphical comparison of ground-based and satellite-based products are also performed as illustrated in Figure 6. The twenty five (25) years mean monthly rainfall depth of CHIRPS and observed measurement show similar pattern. At all stations the highest mean monthly rainfall was observed in July month for both products (Figure 6). Whereas the minimum mean monthly rainfall of CHIRPS product and observed measurement were obtained in January. The analysis result indicates that CHIRPS overestimate mean monthly observed rainfall at Shambu and Alibo stations, in contrast it underestimates for Finchaa and Bereha stations.
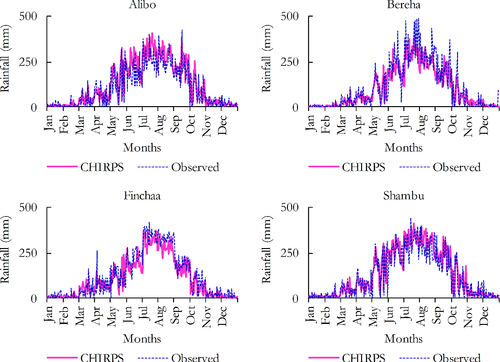
As indicated by statistical analysis, the graphical performance measures comparison between satellite-based and ground-based monthly rainfall also showed the good consistency between the products. Figure 7 compares both products using 300 monthly rainfall values (12 month/year × 25 year) in four stations across the study area. Comparing the two products, it can be seen that CHIRPS satellite product well preserved the monthly rainfall depth for all stations under consideration. Mussie et al36 compared the performance of CHIRPS and other three (CFSR, PERSIANN-CDR, and TRMM) satellite rainfall estimates with gauge observations in Meki and Ketar watersheds. The study reported that the highest value correlation coefficient (0.81) and coefficient of determination (0.83) values for CHIRPS gridded datasets at monthly temporal scale. Duan et al39 obtained pattern and magnitude of monthly rainfall in much better consistent with ground-based rainfall for CHIRPS product as compared with TRMM and CFSR products in the upper Gilgel Abay Basin.
3.3 Evaluation at seasonal scale
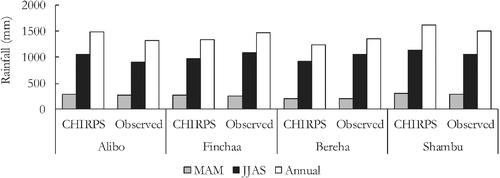
Seasonal evaluation of ground-based and satellite-based (CHIRPS) rainfall was carried out for the two rainy seasons. These are MAM season (Belg or Short rainy season) consisting March, April, and May months and JJAS season (Kiremt or main rainy season) consisting of June, July, August, and September months. From total annual observed rainfall 73.55% (23.95%) rains fall in JJAS (MAM). Duan et al39 obtained similar seasonal pattern with rainy months centered in June–September. CHIRPS slightly overestimates MAM season rainfall at all stations. However, it overestimates at Shambu and Alibo stations and underestimates at Finchaa and Bereha stations the JJAS season rainfall depths (Figure 8). Gebremicael et al41 found a best correlation between observed and CHIRPS JJAS season rainfall with correlation coefficient values ranging from 0.56 to 0.95 across Tekeze-Atbara River basin from the comparison at pixel-to-point spatial scale. It also revealed the average value of 0.88 correlation coefficient at basin level for the same basin and season. Other study also obtained 0.79, −27.93 mm/season and 93.27 mm/season of correlation coefficient, mean square and RMSE respectively for the main rainy season (JJAS) across Upper Blue Nile basin from the comparison at grid points (CHIRPS) corresponding to the stations.38
The comparison was also done in term of total annual rainfall proportion. It can be seen from the data in Table 4 that show the proportion of JJAS season ranges from 68.93 to 77.98% (70.62%–74.81%) of the observed (CHIRPS) total annual rainfall. Similarly, the percentage MAM season varies from 18.35 to 28.75% and 21.83 to 27.18% of total annual ground-based and satellite-based rainfall respectively. The interesting thing in this data is that it shows of ground-based and satellite-based seasonal rainfall proportion at Shambu station. It also shows better match of seasonal rainfall of the two products at Alibo and Bereha stations. Slight MAM season mismatch was obtained for Finchaa station. This finding is in agreement with Reference 53 findings which showed the dominancy of JJAS rainfall (74%) in annual rainfall with low variation and skewness. JJAS season rainfall is about 70% (60%–78%) of annual rainfall in the upper Blue Nile river basin increasing with latitude.54 Tabari et al55 and Jacob et al56 obtained 91% of annual rainfall from short (MAM) and main (JJAS) seasons rainfall. More than 90% also obtained as the contribution JJAS (kiremt) rainfall to the total annual rainfall.57
| Data source | Alibo | Finchaa | Bereha | Shambu | ||||
|---|---|---|---|---|---|---|---|---|
| MAM | JJAS | MAM | JJAS | MAM | JJAS | MAM | JJAS | |
| CHIRPS (%) | 26.83 | 70.82 | 27.18 | 72.52 | 21.93 | 74.81 | 26.25 | 70.62 |
| Observed (%) | 28.75 | 68.93 | 22.25 | 74.46 | 18.35 | 77.98 | 26.46 | 70.89 |
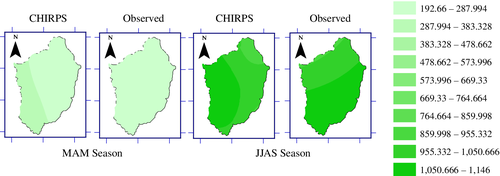
Furthermore, the analysis of spatial patterns of rainy seasons' rainfall for the study area were performed using the most common geostatistical method called ordinary kriging interpolation technique. Figure 9 shows the comparison of spatial distribution map of mean seasonal rainfall of the short rainy season (MAM) and main rainy season (JJAS) for the observed and satellite products over Finchaa and Neshe watersheds. Each product shows that, the north-east (downstream) parts of the study watershed receive less seasonal (MAM and JJAS) rainfall compared to the south-west (upstream) parts and vice versa. This is probably due to topographic effects of the area. In general, CHIRPS dataset remarkably capture and display the spatial distribution of rainfall in both MAM and JJAS season over the study area. Figure 9 presents the spatial distribution patterns of short rainy season (MAM) and main rainy season (JJAS) rainfall depths for ground-based and satellite-based (CHIRPS) estimates across Finchaa and Neshe watersheds in the period of 1991 to 2015.
3.4 Evaluation at annual scale
Annual accumulated total rainfall depth for the overlapping period of 1981–2015 was used for the comparison of ground-based and satellite-based rainfall products in Finchaa and Neshe watersheds. As illustrated in Figure 10 CHIRPS product shows a good agreement with the ground-based observed annual rainfall at all stations under investigation. The obtained results were mixed. It indicates year to year overestimations and underestimations amount of total annual rainfall depth for the analysis years across the watersheds. Similarly, for two stations (Shambu and Alibo) it overestimates average annual rainfall amount, whereas for the remaining stations (Finchaa and Bereha) it underestimates annual mean rainfall depth.
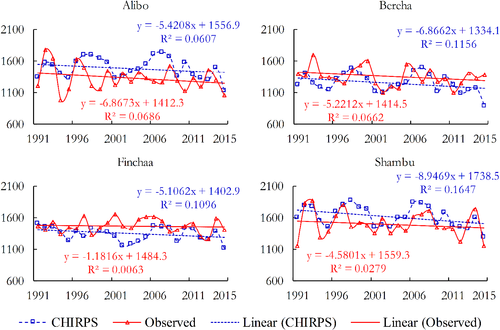
CHIRPS satellite rainfall estimates highly overestimate annual total rainfall up to 493.2 mm/year for Alibo station in the water year of 1999, followed by Shambu station with 459.8 mm/year higher value in 1991. Further analysis shows the highest underestimation of annual total rainfall depth with 495.5 mm/year at Bereha station in 2015. The average over and underestimation of CHIRPS product were +122.52, +163, −132.46, and −101.86 mm/annual for Shambu, Alibo, Finchaa, and Bereha stations respectively. At watershed level, CHIRPS satellite rainfall product slightly overestimates observed total annual rainfall with average value of 12.88 mm/year over Finchaa and Neshe watersheds (Figure 10).
It can be seen from the data in Figure 10 that the longest consecutive years of overestimation by CHIRPS product was 10 years (2003–2012), 10 years (2003–2012), 2 years (1991–1992), and 3 years (1996–1998) for Shambu, Alibo, Finchaa, and Bereha stations respectively. Likewise, the longest consecutive years of underestimation at Shambu, Alibo, Finchaa, and Bereha stations were 2 years (1992–1993 and 2013–2014), 2 years (1992–1993), 9 years (1999–2007), and 5 years (1999–2003) respectively. At Shambu (19 years) and Alibo (20 years) (Finchaa [20 years] and Bereha [17 years]) stations years of overestimation (underestimation) were dominant. CHIRPS slightly overestimate annual total rainfall in most parts of Neshe watershed (South-west) and underestimate it in most parts of Finchaa watershed (North-east). Overall, these results indicate the good consistency of the two datasets at watershed level rather than at point or station level. This indicates the good spatial coverage ability of CHIRPS satellite-based rainfall estimates in the watersheds.
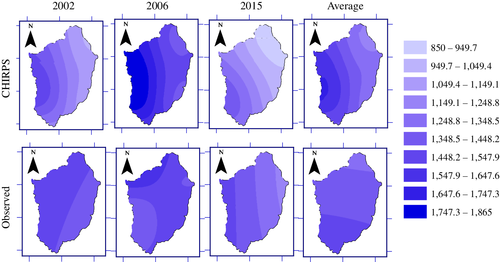
The total annual rainfall spatial distribution patterns over Finchaa and Neshe watersheds during study period were illustrated in Figure 11 for two dry years (2002 and 2015); one wet year (2006); and average annual rainfall (mean of 25 years). The selected dry (minimum annual rainfall) and wet (maximum annual rainfall) years were based on CHIRPS rainfall estimate and used for comparison with ground-based rainfall product. It is also reported in the others study38 that 2006 and 2015 as non-drought and drought years respectively in the Blue Nile basin. Likewise, the seasonal rainfall, the spatial distribution of total annual rainfall (for dry, wet, and average years) shows more rainfall in the south-west parts of the study watershed during the study years. The result indicates that the better performance of CHIRPS product in reproducing total annual rainfall across the watershed during dry, wet, and average years. However, CHIRPS slightly overestimate total annual rainfall in areas of higher altitude (South-west), on the other hand, it slightly underestimates annual rainfall amounts at lower altitude parts (North-east).
This study has found that generally CHIRPS satellite rainfall products better performed in Finchaa and Neshe watersheds at different temporal and spatial resolutions. The performance of CHIRPS product consistently improved with ground-based measurements at larger time scales. This is mainly due to counterbalancing of variabilities and reduced errors when aggregated from shorter to longer timescales.38, 41 However, the spatial comparison of both products, unlike the temporal scale showed non-uniform pattern with increasing resolution. This is in good agreement with the study of Gebremicael et al41 who reported that spatial performance of satellite rainfall estimates is increased from point to the areal comparison in the lowlands, in contrast decreased in the highland areas of Tekeze-Atbara basin likely due to the uneven distribution of rain gauge stations. The bias of satellite rainfall varies with the topography and may not accurately capture the spatial distribution patterns of rainfall in complex terrain setting.20 Further, the comparison of stations' average to area grid cell average indicated the better skills of CHIRPS rainfall product in maintaining the pattern and magnitude rainfall in Finchaa and Neshe watersheds. This study has found that generally better performance of CHIRPS satellite estimate across the study area which probably arises due to its high spatial resolution; it takes into account the topographic effects and it incorporates long-term climatic CHG rainfall climatology (CPHClim) map.41
4 CONCLUSION
Missing data, short-length data archives, unavailability of reliable data, and uneven spatial coverage characterize rainfall gauge stations in most developing nations. Recent advancements in the field of remote sensing have led to the development of high resolution satellite-based rainfall products to improve the quality of observed rainfall data in such countries through proper evaluation and validation process of the products. This study set out to evaluate the performance CHIRPS satellite-based rainfall product in reference ground-based rainfall across Finchaa and Neshe watersheds of Upper Blue Nile River basin using quantitative statistical performance metrics and graphical comparison methods. A positive strong linear correlation—R = 0.93 and R2 = 0.86—and less noise, bias and error—NSE = 0.84, PBIAS = 0.98%, and RMSE = 46.99 mm—were found between CHIRPS satellite-based and ground-based measurement rainfall products comparison in the Finchaa and (Amerti) Neshe sub-basins of Upper Blue Nile River Basin. Likewise, the ground-based product, the CHIRPS product indicated that more rainfall at the upstream of the watershed compared with the downstream parts. However, it slightly overestimates and underestimates the rainfall amounts at higher and lower altitude areas, respectively. The skill of CHIRPS product was improved with time resolution, whereas the spatial performance was inconsistent spatial scales. The findings of this study suggest that CHIRPS satellite-based rainfall product can serve as a robust alternative source of good quality and continuous and even spatial coverage rainfall data in the study watersheds for hydrological and water resource planning and management applications. Further study on the ability of CHIRPS to characterize frequency of extreme rainfall, trends and variability, number of wet days or/and dry spells in the study watersheds is suggested.
CONFLICT OF INTEREST
The authors declare that there is no conflict of interest regarding the publication of this article.
Open Research
Engineering Reports thanks the anonymous reviewers for their contribution to the peer review of this work.
DATA AVAILABILITY STATEMENT
The data that support the finding of this study are available from the corresponding author upon reasonable request.


