Using publicly available flight data to analyze health disparities in aeromedical retrieval
Funding and support: ByJACEP Open policy, all authors are required to disclose any and all commercial, financial, and other relationships in any way related to the subject of this article as per ICMJE conflict of interest guidelines (see www.icmje.org). The authors have stated that no such relationships exist.
Supervising Editor: Karl A. Sporer, MD
Abstract
Objectives
Specialist healthcare cannot be provided in all locations. Helicopters can help to reduce the inherent geographical inequity caused by long distances or difficult terrain. However, the selective use of aeromedical retrieval could lead to other forms of health disparities. The aim of this project was to evaluate such inequities in access to helicopter transport.
Methods
This was a geospatial analysis of publicly available flight tracking data for 18 emergency medical helicopters in the state of Alabama for a 90-day period between March 2019 and June 2019. Data are presented as the number of incidents attended per population, by population (total, insured, and uninsured), as funnel plots, by county. This method allows the identification of positive and negative outliers.
Results
We identified 672 likely scene retrieval flights. Twelve counties were probable (outside of 99% confidence interval [CI]) high outliers (more helicopter retrievals than expected), and 4 were possible (outside of 95% CI) high outliers. There were 5 possible low outliers (fewer helicopter retrievals than expected) and 6 probable low outliers. Analysis by insurance status revealed similar results. However, there was no easily discernible geographic pattern to this variability.
Conclusion
There is considerable geographical variability in the number of helicopter retrievals, with no easily discernable pattern. Some of this variability may be due to differences in injury epidemiology, but others may be due to case selection. However, the present data are insufficient to come to firm conclusions, and additional study is warranted.
1 INTRODUCTION
Healthcare, and specialist care in particular, cannot be provided in all locations. Geographic access to such services may be limited by distance or terrain and is therefore inherently inequitable. Helicopters can reduce this inequity, by providing a means of quickly transferring patients with critical medical or surgical conditions, or injuries, to a specialist facility, faster than can be achieved by ground ambulances.1, 2 In the United States, 1 in every 1000 people are taken to hospital by a helicopter, making helicopter emergency medical services (HEMS) an integral part of the United States healthcare system.3
However, there are also concerns in the way in which helicopters are utilized, particularly given the very high costs of these services. A consumer alert issued by the National Association of Insurance Commissioners stated that HEMS costs on average between $12,000 and $25,000 per flight.4 In particular, there is concern whether the decision to offer aeromedical retrieval is based entirely on medical and geographical consideration, or whether other factors—such as the patients socioeconomic or insurance status, whether known or inferred—may lead to a different form of disparity and variability in access to care.
A recent cross-sectional study has shown that, although the majority of the United States has access to trauma care within an hour, almost 30 million United States residents do not.1 In particular, significant disparities in access were evident for vulnerable populations defined by insurance status, income, and rurality.5 Low-income adults without insurance reported significantly difficulty in accessing specialist care when compared to low-income adults with public or private insurance, although previous studies did not specifically focus on aeromedical retrieval.5 Given the benefits associated with rapid transfer to specialist care,6-8 there is a clear need to ensure that these services are accessible. We hypothesized that emergency medical helicopters may be less likely to be dispatched to incidents in certain areas. The aim of this project was to analyze publicly available flight data, to evaluate inequities in healthcare access, using the state of Alabama as a case study.
2 METHODS
2.1 Design, data source, and setting
This is a retrospective, geospatial analysis of helicopter flight data, obtained from FlightAware, a digital aviation services company, which provides global flight tracking services. Insurance data were obtained from the 2017 Small Area Health Insurance Estimates study conducted by the United States. Census Bureau that gave insurance status for individuals aged 64 and under. Individuals aged 65 were assumed to have insurance through Medicare. Population data were obtained from the 2010 census United States. Census Bureau TIGER/Line files.
The Bottom Line
Medical helicopter flights in Alabama over 90 days were analyzed by location. These 672 calls identified outlier counties (12 with high traffic and 6 with low traffic). They analyzed all counties by geography, rural versus urban, or insurance rate and were unable to find any discernible geographical pattern to this variability.
2.2 Data extraction and geocoding
We manually extracted the flight records of 18 emergency medical helicopters that operate in Alabama. Each record was reviewed to determine where each flight originated, ended, and any landings in between these 2 points, over a period of 3 months, between March 28, 2019 and June 25, 2019. Landing locations within a 3-mile radius of an Alabama hospital or an emergency helicopter base were assumed to represent interfacility transfers—rather than scene flights—and were thus excluded. Out-of-state landing locations were also excluded. Landing locations were determined from flight paths and altitude records, geocoded, and assigned a level of coding confidence. Flights with complex flight patterns containing multiple possible landing locations, and flights where the landing location was unable to be determined were also excluded (Figure 1).
2.3 Geographical analysis
Incident location data were analyzed by county. “Shapefiles” (containing geographical information for use with geographical information systems [GIS]) of the county boundaries were obtained from the United States. Census Bureau (www.census.gov). The incident count per county was calculated using ArcGIS Pro (Esri, Redlands, CA), a GIS software package. The results are displayed as choropleth maps, of the number of incidents per population, per county. We analyzed the results with reference to the population as a whole, the insured population, and the uninsured population.
2.4 Funnel plots
We used “funnel plots” to relate the number of incidents to each county's population size. Funnel plots are a recommended graphical aid for comparisons in which an estimate of an underlying quantity is plotted against an interpretable measure of its precision.9 “Control limits” form a funnel around the target outcome, in close analogy to Shewhart control charts.9 Funnel plots are attractively simple and avoid spurious rankings.9 The plots used in this study show how counties’ incident numbers compare with the expected rate for a county of that particular population size, calculated from the mean and SD. Funnel plots quantify the degree of confidence to which provision has been calculated to lie within or outside the expected level, hence permitting sensible comparisons.
There are 5 key lines in the funnel plots used in this report. The first is the mean number of incidents per population, which is shown as a solid line. On either side, 95% and 99% confidence intervals (CIs) are shown, as dashed lines, calculated using the SEM. Individual values plotted represent the number of incidents per population in each county. Counties that lie between the 95% and 99% CI lines should be regarded as possible outliers (more or fewer than expected numbers, depending on value lying above or below the mean). Counties that lie above or below the 99% CI line should be regarded as probable outliers. The funnel plots were created using Microsoft Excel (Microsoft Corp, Redmond, CA).
These methods were approved by the UAB Institutional Review Board.
3 RESULTS
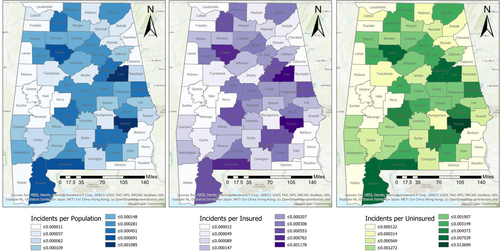
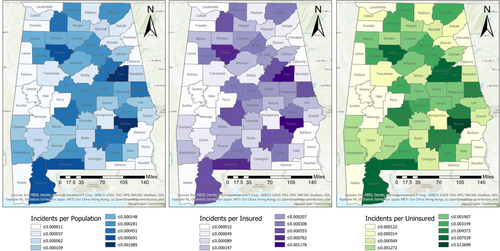
A total of 1248 flight records were identified. A total of 576 records were excluded (Figure 1), leaving 672 likely scene retrieval flights for analysis. A total of 426 (63.4%) of the incident locations were identified with a high degree of confidence, 232 (34.5%) with a moderate degree of confidence, and 14 (2.1%) with a low degree of confidence. Figure 2 shows the number of incidents per county, with reference to the general population (Figure 2A), the insured population (Figure 2B), and the uninsured population (Figure 2C). The incidence rates appear to be broadly similar for all 3 categories, with lower rates in the Western, South-Eastern, and North-Eastern counties. The state average was 0.000127 incidents attended, per population; 0.000139 incidents attended per insured population, and 0.001415 incidents attended per uninsured population.
Of the 67 Alabama counties, 30 counties were found to be outliers when comparing incident data against the general population (Figure 3), uninsured population (Figure 4), and/or the insured population (Figure 5). Funnel plots revealed 10 counties that were consistently probable high outliers above the mean (more helicopter retrievals than expected) when comparing incident data against all 3 populations (Baldwin, Bullock, Chambers, Clay, Dallas, Escambia, Limestone, Pike, Talladega, and Walker). Two counties, Lawrence and Crenshaw, were probable outliers above the mean when looking at the general and insured population but only possible outliers above the mean for the uninsured population. When analyzing results for Blount, Jackson, and Coffee County, the number of incidents compared with the uninsured population were within normal limits; however, these counties were found to be possible outliers above the mean for the general population and the insured population. Macon County was a possible outlier above the mean when comparing incident data with the uninsured population but was otherwise within normal limits. Shelby County was also a possible outlier but only when comparing incident data to the general population.
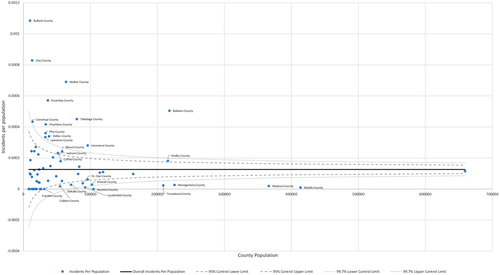
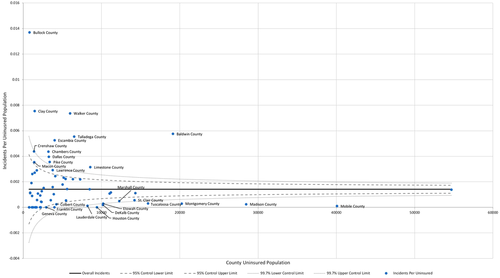
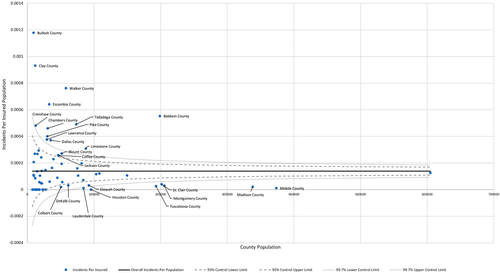
There were 6 counties that were consistently probable outliers below the mean (lower than expected number of helicopter retrievals) for the 3 target populations (Houston, Lauderdale, Madison, Mobile, Montgomery, and Tuscaloosa). Four of these probable outliers below the mean are counties containing trauma centers (Madison, Mobile, Montgomery, and Tuscaloosa). Two counties, DeKalb and Etowah, were found to be possible outlier below the mean for the general population and the insured population, but considered to be probable outliers below the mean for the uninsured population. Geneva County was within normal limits for the general population and the insured population but was found to be a possible outlier below the mean for the uninsured population. Franklin and Colbert County are possible outliers below the mean for the general and uninsured populations; however, Franklin County is within normal limits for the insured population where Colbert County is a possible outlier below the mean. Marshall County is a possible outlier below the mean for the uninsured population but is otherwise within normal limits. St. Clair County is a possible outlier below the mean for the general and uninsured populations but a probable outlier for the insured population.
3.1 Limitations
This study has demonstrated the feasibility of analyzing publicly available flight data. The use of such data are appealing, because of their volume, and because they are generated automatically. However, the extraction of these data proved to be difficult. Although FlightAware offer custom data extraction (for a fee), the company were not able to provide all the data required for this project, necessitating a laborious manual data extraction, and limiting the number of incidents that could be analyzed. This, in turn, could lead to unstable incidence rates when analyzed by county. There were other limitations: automated altitude recording is not possible below 2000 feet, making the pinpointing of landing locations difficult if preceded by a prolonged period of low-level flying. Furthermore, a proportion of the flight patterns were too complex to identify where the aircraft landed. Further validation of the quality of the FlightAware data, perhaps against some of the companies’ own records, would therefore be valuable. The exclusion of incident locations in relative proximity to hospital may not always be appropriate, because these facilities could have been used as rendezvous point for ground units needing access to HEMS. However, without additional information, this is impossible to discern.
4 DISCUSSION
This study analyzed the number of helicopter retrievals, per population, by county, in the State of Alabama. The results demonstrate that there was considerable variability in the number of incidents that resulted in aeromedical retrieval, which is concerning. However, there was no easily discernible pattern to this variability, neither in geographic terms, or in terms of those who have insurance.
The decision to request a helicopter to take a patient to hospital is based on a large number of factors, some of which are quantifiable, whereas others are not. Severity of illness or injury is perhaps the most important, but there are many others.10 Areas located in proximity to a large hospital would be expected to have fewer helicopter retrievals, because transport by ground ambulance is probably as quick. Our results demonstrate that Tuscaloosa County, Montgomery County, Madison County, Houston County, and Mobile County, all of which have large hospitals, are such “low outliers.” Interestingly, however, Jefferson County, which includes the Birmingham metro area, with several very large hospitals, is not an outlier. The “high outliers” include many rural counties, such as Clay County, Escambia County, and Baldwin County. This does, at first sight, make sense—more remote locations, located a long distance away from hospitals, probably benefit the most from aeromedical retrieval. However, this does not always hold true, because the location of helicopter bases is usually determined on the basis of population density, rather than remoteness. Furthermore, income is also often related to population density. Reassuringly, our data show that patients from remote locations are retrieved by helicopter, more so than in other counties, although it should be noted that outbound flight times in such areas can be lengthy, making ground transport quicker.
Similarly, there was no clear association with insurance status. The 3 counties in Alabama with the greatest uninsurance rates are DeKalb County, Franklin County, and Marshall County. All of these counties were considered outliers below the mean for the uninsured population. Franklin and Marshall County are both next to counties containing a large hospital; however, DeKalb County, which has the greatest uninsured rate in the State of Alabama is not near one of these facilities.
Despite limitations, our study adds to the existing literature. Publicly available flight data are a potentially rich resource. Our analysis shows that there is considerable variability in the number of helicopter retrievals, and that the geographical patterns of aeromedical retrieval are complex, without easily discernible explanations for the variability observed. Some of these differences may be due to variations in injury epidemiology, but others may be due to case selection. However, the present data are insufficient to come to firm conclusions, and additional study is warranted.
CONFLICT OF INTEREST
The authors declare no conflicts of interest.
AUTHOR CONTRIBUTIONS
DJM performed data collection, statistical analysis in ArcGIS, and authored the manuscript. BMC, SM, and WAS aided in data collection and manuscript review. RLG guided statistical analysis and design. SWS contributed to the design of the project in regard to aeromedical transport within the region. JDK was integral in reviewing and editing the abstract and manuscript for submission. JOJ was the senior faculty advisor for this project and was involved in design, data collection, statistical analysis and review, and manuscript revisions. JOJ takes responsibility of the paper as a whole. JOJ takes responsibility of the paper as a whole.


