Differential requirements for IRF4 in the clonal expansion and homeostatic proliferation of naive and memory murine CD8+ T cells
See accompanying commentary by Enrico Lugli et al. https://doi.org/10.1002/eji.201847727
Abstract
Interferon regulatory factor 4 (IRF4) has critical roles in immune cell differentiation and function and is indispensable for clonal expansion and effector function in T cells. Here, we demonstrate that the AKT pathway is impaired in murine CD8+ T cells lacking IRF4. The expression of phosphatase and tensin homolog (PTEN), a negative regulator of the AKT pathway, was elevated in Irf4−/− CD8+ T cells. Inhibition of PTEN partially rescued downstream events, suggesting that PTEN constitutes a checkpoint in the IRF4-mediated regulation of cell signaling. Despite the clonal expansion defect, in the absence of IRF4, memory-like CD8+ T cells could be generated and maintained, although unable to expand in recall responses. The homeostatic proliferation of naïve Irf4−/− CD8+ T cells was impaired, whereas their number eventually reached a level similar to that of wild-type CD8+ T cells. Conversely, memory-like Irf4−/− CD8+ T cells underwent homeostatic proliferation in a manner similar to that of wild-type memory CD8+ T cells. These results suggest that IRF4 regulates the clonal expansion of CD8+ T cells at least in part via the AKT signaling pathway. Moreover, IRF4 regulates the homeostatic proliferation of naïve CD8+ T cells, whereas the maintenance of memory CD8+ T cells is IRF4-independent.
Introduction
CD8+ T cells are pivotal for protective immune responses against intracellular microbial infection and cancer. Specific T cells respond to antigens in the following phases: clonal expansion and effector differentiation; contraction, during which the majority of effector cells die in the absence of antigenic stimulation; and memory phase, during which a small fraction of specific T cells survive long-term 1. The decision on the fate of effector T-cells is affected by multiple factors, including the strength and duration of T-cell receptor (TCR) signals, nature of co-stimulation, and environmental cues, such as inflammatory cytokines. These cues are translated into the differential expression of transcription factors, including T-bet and Eomes, which affect the balance of effector versus memory cell differentiation 1, 2. After signaling through the TCR as well as co-stimulatory and cytokine receptors, phosphatidylinositol-3,4,5-triphosphate (PIP3) generated by phosphatidylinositol 3-kinase (PI3K) leads to the phosphatidylinositide-dependent kinase-1 (PDK1)-mediated phosphorylation of AKT/protein kinase B (PKB), a serine-threonine kinase with critical roles in the decision to adopt an effector or memory cell fate 3-5. The activation of AKT stimulates mammalian target of rapamycin (mTORC)1, which inactivates the nuclear transcription factor Foxo1 by prompting its translocation to the cytoplasm. This results in the induction of T-bet and repression of Eomes expression, culminating in increased effector differentiation 6, 7. The PI3K-AKT pathway is also activated in cytokine receptor-mediated signaling and, combined with TCR mediated pathways, regulates cell cycle progression, survival, and effector/memory decisions in activated CD8+ T cells 8. In addition to antigen-driven activation, T cells can undergo homeostatic proliferation, which regulates pools of peripheral mature T-cells in the absence of antigens. The homeostatic proliferation of naïve T cells requires the recognition of the self-major histocompatibility complex (MHC)/peptide complex by the TCR, as well as that of IL-7 and the activation of the PI3K-AKT-mTOR pathway, which induces T-cell maturation and the transient acquisition of a memory-like phenotype 9-11. In contrast, the homeostasis and turnover of memory T cells are maintained in an MHC-independent manner and supported by IL-7 and IL-15 9, 12.
Interferon regulatory factor 4 (IRF4) is a transcription factor of the IRF family expressed in immune cells, including lymphocytes, dendritic cells, and macrophages 13. IRF4 is upregulated in T cells following their activation via TCR signaling and is critical for their differentiation into effector cells, such as Th2, Th17, and Tfh cells, and for Treg function 13. In CD8+ T cells, IRF4 is induced after TCR stimulation in an IL-2 inducible Tec-kinase and mTOR signaling-dependent manner 14. IRF4 regulates the expression of >400 genes, many of which are critical regulators of T-cell activation and function 15, 16. The induction of IRF4 is dependent on TCR affinity; IRF promotes the expression of T-bet and Blimp-1, which coordinate the CD8+ T-cell effector program and suppress Eomes expression 15-17. These studies revealed the critical roles of IRF4 in regulating the transcription of key molecules that determine the extent of clonal expansion and functional differentiation of CD8+ T cells. However, the relationship between IRF4 and the PI3K-AKT pathway, which are both critical for the activation and metabolism of T cells, has not been clearly addressed. Furthermore, the role of IRF4 in the homeostasis and recall response of memory CD8+ T cells remains unclear.
In this study, we examined the role of IRF4 in the regulation of TCR- and cytokine-mediated signaling pathways during the activation of naïve CD8+ T cells. Our results indicate that IRF4 plays a pivotal role in the regulation of the AKT pathway in TCR- or cytokine-mediated signaling. We also examined whether IRF4 is required for the homeostatic proliferation of naïve and memory CD8+ T cells as well as their recall responses. Although the homeostatic proliferation of naïve CD8+ T cells was affected by the lack of IRF4, that of memory CD8+ T cells was not, suggesting a differential requirement for IRF4 in the homeostatic proliferation of naïve versus that of memory CD8+ T cells.
Results
The AKT pathway is perturbed in Irf4−/− CD8+ T cells
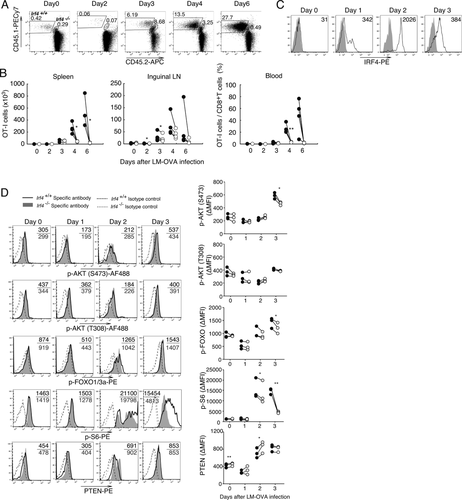
To evaluate the response of Irf4−/− CD8+ T cells to TCR stimulation, Irf4−/− and Irf4+/+ OT-I cells were mixed in a 1:1 ratio and cultured with OVA257–264-pulsed dendritic cells. The expression of IRF4 was upregulated in Irf4+/+ OT-I cells 1 day after stimulation (Fig. 1A, Supporting Information Fig. 1). The ratio of Irf4−/− to Irf4+/+ OT-I cells declined after 2 days in culture (Fig. 1B). Next, we examined the phosphorylation of proteins in the AKT signaling pathway. After stimulation with OVA257–264, the levels of phosphorylated AKT and FOXO1/3a proteins in Irf4−/− OT-I cells were lower than those in Irf4+/+ OT-I cells (Fig. 1C). A reduced phosphorylation of FOXO1/3a was also observed in polyclonal Irf4−/− CD8+ T cells 2 and 3 days after stimulation with anti-TCR and anti-CD28 monoclonal antibodies (mAbs) (Fig. 1D). Consistent with the reduction in AKT activation, the levels of phosphorylated S6 ribosomal protein (a target of S6 kinase downstream of AKT/mTORC1) were lower in Irf4−/− cells than those in Irf4+/+ OT-I cells after 2–3 days in culture (Fig. 1C). The AKT signaling pathway is reciprocally regulated by PI3K, which produces PIP3, and PTEN, which dephosphorylates PIP3 8. PTEN levels were higher in Irf4−/− OT-I than those in Irf4+/+ cells 2–3 days after TCR stimulation, whereas those in Irf4+/+ OT-I cells remained similar (Fig. 1C). PTEN protein levels were also higher in polyclonal Irf4−/− CD8+ T cells, and Pten mRNA levels increased after stimulation with anti-TCR and anti-CD28 mAbs, suggesting that IRF4 negatively regulates the expression of PTEN (Fig. 1D and E).

We next examined the role of IRF4 in CD8+ T cells in vivo. C57BL/6 (B6) mice were adoptively transferred with a 1:1 mixture of Irf4+/+ and Irf4−/− OT-I cells, and infected with Listeria monocytogenes expressing ovalbumin (LM-OVA) (Fig. 2A and B). Both Irf4+/+ and Irf4−/− OT-I cells expanded on a similar scale during the initial 3 days of infection. Thereafter, the proportion of Irf4+/+ OT-I cells continued to increase, whereas that of Irf4−/− OT-I cells declined. OT-I cells expressed IRF4 1 day after LM-OVA infection (Fig. 2C). The levels of phosphorylated AKT, FOXO1/3a, and S6 were lower in Irf4−/− than those in Irf4+/+ OT-I cells 3 days after infection (Fig. 2D), consistent with our in vitro results (Fig. 1). PTEN protein levels were higher in Irf4−/− than those in Irf4+/+ OT-I cells on day 2 after infection, although this effect was transient (Fig. 2D).
We also evaluated CD8+ T-cell responses to cytokines using mixed OT-I transfer to induce cytokine receptors (Supporting Information Fig. 2A). Irf4−/− OT-I cells displayed a limited expansion in the presence of IL-15 or IL-12, although they expressed IL-15Rα and IL-12Rβ2 at levels similar to those in Irf4+/+ OT-I cells (Supporting Information Fig. 2B and C). The levels of phosphorylated STAT4 or STAT5 after stimulation with these cytokines was similar between Irf4+/+ and Irf4−/− OT-I cells, suggesting that the engagement of these cytokines with their receptors is not perturbed (Supporting Information Fig. 3) 17. However, the levels of phosphorylated FOXO1/3a were lower in Irf4−/− OT-I cells cultured in the presence of these cytokines (Supporting Information Fig. 4), suggesting that the AKT signaling pathway downstream of cytokine receptors such as IL-12 and IL-15 was impaired in CD8+ T cells lacking IRF4.
PTEN inhibition partially rescues the function of Irf4−/− CD8+ T cells
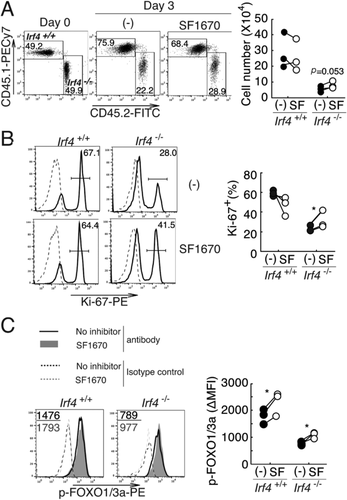
To determine the effect of PTEN expression on its downstream events, CD8+ T cells from Irf4+/+ and Irf4−/− mice were stimulated with anti-TCR and CD28 mAbs in the presence and absence of the PTEN inhibitor SF1670 18, 19. The number of Irf4−/− CD8+ T cells tended to be higher in the presence of SF1670 (Fig. 3A). Moreover, the proportion of Ki67+ proliferating cells significantly increased in Irf4−/− CD8+ T cells, but not in Irf4+/+ CD8+ T cells, in the presence of SF1670 (Fig. 3B). The levels of phosphorylated FOXO1/3a increased in both Irf4+/+ and Irf4−/− CD8+ T cells in the presence of SF1670 (Fig. 3C). These results support our hypothesis that an increased expression of PTEN inhibits the AKT signaling pathway and culminates in the inhibition of the proliferative potential of Irf4−/− CD8+ T cells.
Generation of memory-phenotype Irf4−/− CD8+ T cells
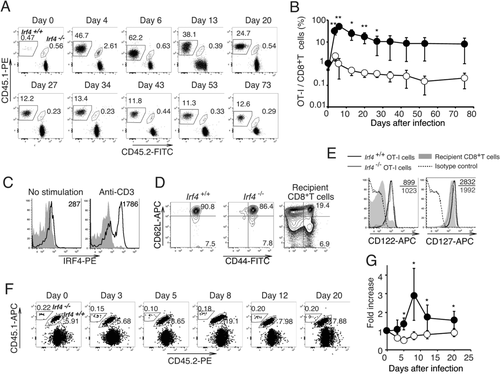
Irf4−/− CD8+ T cells show defects in their development to effector cells and are prone to differentiate into cells with a central memory-phenotype 17. Thus, we examined the survival of these Irf4−/− OT-I cells during the memory phase (Fig. 4). B6 mice were adoptively transferred with Irf4+/+ and Irf4−/− OT-I cells and infected with LM-OVA. The proportion of Irf4+/+ OT-I cells peaked on day 6, gradually decreased, and was then maintained for more than 73 days after infection (Fig. 4A and B). IRF4 expression levels were low in these memory Irf4+/+ OT-I cells and became upregulated after stimulation with an anti-CD3 mAb in vitro (Fig. 4C). Irf4−/− OT-I cells proliferated until day 4, then stopped expanding, and gradually decreased in number maintaining their presence for more than 73 days, although their numbers were reduced compared with those in Irf4+/+ OT-I cells. Similar to Irf4+/+ OT-I cells, the Irf4−/− OT-I cells exhibited a CD44hiCD62hi central memory-phenotype and expressed the IL-2 receptor β-chain (CD122), whereas the expression of IL7-Rα (CD127) was slightly lower (Fig. 4D and E). We next immunized mice with bone marrow-derived dendritic cells (BMDCs) pulsed with OVA257–264 and monitored the expansion of OT-I cells in the blood. The proportion of Irf4+/+ OT-I cells increased, reaching a peak on day 8 after immunization. However, no increase in the proportion of Irf4−/− OT-I cells was detected (Fig. 4F and G). These results imply that IRF4 is not required for the maintenance of memory-type CD8+ T cells, but is indispensable for their recall proliferative responses.
The role of IRF4 in homeostatic proliferation of naïve and memory-phenotype CD8+ T cells
To investigate the role of IRF4 in the homeostatic proliferation of CD8+ T cells in lymphopenic environments, we inoculated Rag2−/− mice with Irf4+/+ and Irf4−/− OT-I cells at a 1:1 ratio and examined their fate (Fig. 5A–D). The proportion of Irf4+/+ OT-I cells in the blood increased over 3 weeks, reaching approximately 6% and similar proportion was maintained thereafter. In contrast, Irf4−/− OT-I cells did not an exhibit acute expansion during the initial 3 weeks, but steadily increased reaching a similar proportion after approximately 2 months (Fig. 5A and B). The proportion of Irf4+/+ OT-I cells, but not that of Irf4−/− OT-I cells, increased in the spleen during the 4 weeks after the transfer (Fig. 5C). Next, we used Ki67 expression as well as BrdU incorporation to evaluate the proliferation of OT-I cells 14 days after transfer (Fig. 5D). The proportions of Ki67+ and BrdU+ cells in Irf4−/− OT-I cells were lower than those in Irf4+/+ OT-I cells. In contrast, the proportion of annexin V+ cells in Irf4−/− OT-I cells was higher than those in Irf4+/+ OT-I cells. These results suggested that IRF4 promotes homeostatic proliferation of CD8+ T cells while inhibiting their apoptosis in lymphopenic hosts.
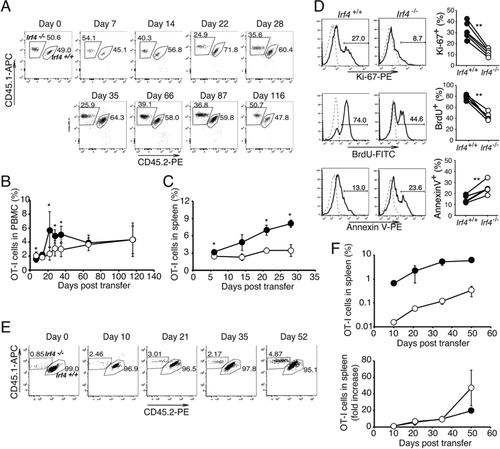
Next, we examined the homeostatic proliferation of memory-phenotype OT-I cells. We transferred a 1:1 mixture of Irf4+/+ and Irf4−/− OT-I cells into B6 mice and infected the animals with LM-OVA to generate memory-type OT-I cells. Sixty-two days later, total CD8+ cells, including memory-type Irf4+/+ and Irf4−/− OT-I cells, as well as host CD8+ T cells, were transferred into Rag2−/− mice; after 10–52 days, the relative proportions of memory-type Irf4+/+ and Irf4−/− OT-I cells in the spleen were monitored using flow cytometry (Fig. 5E and F). The proportions of memory-type Irf4+/+ and Irf4−/− OT-I cells increased in parallel until day 52 in the Rag2−/− environment, suggesting that IRF4 is dispensable for the homeostatic proliferation of memory-type CD8+ T cells.
Discussion
Accumulating evidence, including this study, suggests that the antigen-driven activation of naïve CD8+ T cells occurs in two phases: the initial activation independent of IRF4, and the subsequent clonal expansion and effector differentiation dependent on the induction of IRF4 expression 14-17. To investigate the mechanisms underlying the requirement for IRF4, we examined the AKT pathway in TCR- and cytokine-mediated signaling of CD8+ T cells by using Irf4+/+ and Irf4−/− mice. The activation of the AKT pathway was reduced downstream of PI3K in the absence of IRF4, whereas the ERK pathway was not affected. Additionally, the level of PTEN, a negative regulator of PI3K/AKT signaling, was elevated in activated Irf4−/− CD8+ T cells relative to that in Irf4+/+ CD8+ T cells, suggesting that PTEN expression is negatively regulated by IRF4. The transcriptional regulation of Pten is mediated by the early growth response-1 (Egr-1) and p53 transcription factors, which bind to specific elements regulating the Pten gene 20, 21. In addition to these regulators, it is likely that IRF4 directly affects Pten transcription in CD8+ T cells, because several IRF4-binding sites are present upstream, within, and downstream of the gene, as shown in the CHIP-seq database of activated CD4+ T cells 22. IRF4 binds to regulatory sequences and controls the expression of various genes required for the effector differentiation of CD8+ T cells by promoting the expression of genes such as Tbx21, Prdm1, Hif1a, and Foxo1, as well as by repressing the expression of proapoptotic genes and that of genes encoding CDK inhibitors 15, 16. Thus, IRF4 regulates effector differentiation in CD8+ T cells at multiple critical transcriptional check-points. However, our study showed that the pharmacological inhibition of PTEN activity rescued, at least in part, the level of FOXO1/3a phosphorylation and proliferation of Irf4−/− CD8+ T cells. This suggests that the regulation of Pten expression by IRF4 represents one of the key check-points in promoting CD8+ T-cell activation. IRF4, which is induced by TCR- and cytokine signaling, inhibits the expression of Pten, which likely enhances the PI3K-AKT-mediated activation of FOXO1/3 and mTORC1 signaling, promoting the survival, trafficking, clonal expansion, and terminal effector differentiation of CD8+ T cells. Further studies are required to elucidate the regulatory networks and key check-point molecules controlled by the key transcription factor IRF4 during the effector differentiation of CD8+ T cells.
Although clonal expansion was impaired, our study indicated that memory-type CD8+ T cells were generated in the absence of IRF4 and maintained for more than 70 days. These cells exhibited a CD62L+CD44+ central memory phenotype and expressed the IL-7 receptor; however, they lacked the ability to proliferate in recall responses in vivo. The persistence and homeostatic proliferation of memory CD8+ T cells does not require interactions with self-peptide/MHC as those processes rely on cytokine signaling (either IL-7 or IL-15) 9, 12. IL-7 or IL-15 can activate both the JAK/STAT5 and PI3K/AKT pathways, promoting the survival and proliferation of memory CD8+ T cells 23. Because the expression of IRF4 is induced via the engagement of antigen receptors, it is likely that memory CD8+ T cells do not express IRF4 during homeostatic proliferation. Upon encountering the antigen, these memory CD8+ T cells exhibit recall responses in an IRF4-dependent manner (Fig. 4G). These cells did not exhibit an IRF4-independent phase of proliferation, which is observed with naïve CD8+ T cells (Fig. 2A and B). The clonal expansion of naïve CD8+ T cells has 2 steps: the initial IRF4-independent phase followed by the IRF4-dependent robust proliferation. Memory CD8+ T cells may be able to trigger a massive IRF4-dependent proliferation without an IRF4-independent phase. We speculate that this ability might allow memory CD8+ T cells to undergo massive proliferation in a short period of time after antigen engagement.
In contrast to memory CD8+ T cells, the homeostatic proliferation of naïve OT-I cells was severely impaired in Irf4−/− OT-I cells. Although we were unable to detect IRF4 expression in OT-I cells during homeostatic proliferation (data not shown), the difference in proliferation between Irf4+/+ and Irf4−/− OT-I cells suggests that IRF4 expression is critical during the homeostatic proliferation of naïve CD8+ T cells. IRF4 may be expressed during the homeostatic proliferation of CD8+ T cells at levels that are too low for detection. Alternatively, it may be expressed too transiently to be detected. Finally, despite the differences in the initial homeostatic proliferation, the number of Irf4+/+ and Irf4−/− OT-I cells reached equivalent levels 2 months after the transfer. We speculate that the homeostatic proliferation of naïve CD8+ T cells may proceed in two steps: (i) a massive IRF4-dependent proliferation for several weeks that is followed by (ii) an IRF4-independent homeostatic proliferation. Further studies are required to test this possibility.
Although the regulation of T-cell responses by IRF4 likely involves complex gene expression and signaling interactions through multiple pathways, our study suggests that one of its targets is the TCR- or cytokine-activated AKT/mTOR signaling pathway regulated by PTEN expression. Similarly, the homeostatic proliferation of naïve CD8+ T cells is dependent on IRF4; however, the maintenance of the homeostatic proliferation of memory CD8+ T cells is likely IRF4-independent. Further studies will reveal the detailed mechanisms underlying the IRF4-mediated regulation of T-cell clonal expansion and maintenance. Such information will be important for the therapeutic application of CD8+ T cell-mediated immune responses and vaccine design.
Materials and methods
Mice and infection
OT-I 24, Rag-2−/− 25, and B6.SJL-Ptprc congenic (B6.SJL) mice were obtained and used as previously described 26. B6 mice were purchased from SLC (Hamamatsu, Japan). Irf4−/− mice 27, B6 mice, and CD45.1+ OT-I mice were intercrossed to obtain CD45.1+Irf4−/− OT-I, CD45.1+CD45.2+Irf4−/− OT-I, CD45.1+Irf4+/+ OT-I, and CD45.1+CD45.2+Irf4+/+ OT-I mice. Mice were maintained in the Laboratory Animal Center for Animal Research at Nagasaki University and were used at 8–14 weeks of age. The animal experiments reported herein were approved by the Institutional Animal Care and Use Committee of Nagasaki University and conducted according to the guidelines for Animal Experimentation, Nagasaki University.
Listeria monocytogenes expressing OVA (LM-OVA) 28 was kindly provided by Dr. Y. Yoshikai (Kyushu University) and Dr. H. Shen (University of Pennsylvania). Mice were infected intraperitoneally with 3 × 10⁶ LM-OVA (1/10 LD50), as previously described 26.
Cell culture
CD8+ T-cells (>95%) were purified from the spleen of mice using anti-CD8 IMag (BD Biosciences, San Diego, CA, USA). OT-I cells (1 × 10⁶/mL) were cultured in the presence of dendritic cells (3 × 10⁴/mL) pulsed with the OVA257–264 peptide (1 μg/mL) as described previously 26. CD8+ T cells (1 × 10⁶/mL) were cultured on plates coated with an anti-TCR mAb (10 μg/mL) and a soluble anti-CD28 mAb (1 μg/mL). To inhibit PTEN activity, SF1670 (Sigma-Aldrich, St. Louis, MO, USA) was used at a final concentration of 500 nM. To induce IRF4 in memory OT-I cells, CD8+ T cells were stimulated with plate-bound anti-CD3 mAb (1 μg/mL) (Fig. 4C).
Flow cytometry
Cells were stained with PECy7-anti-CD45.1, PE- or APC-anti-CD8, APCCy7- or APC-anti-CD45.2, PE-anti-CD62L, FITC-anti-CD44, biotin-anti-CD127, biotin-anti-CD122 mAbs for 30 min at 4°C. Staining with biotinylated mAbs was followed by incubation with APC-streptavidin. Antibodies were purchased from eBioscience (San Diego, CA, USA), BD Biosciences (San Diego, NJ, USA), and TONBO Bioscience (San Diego, CA, USA). After cell surface staining, 7-amino-actinomycin D (7-AAD) was added to exclude dead cells. Staining with annexin V was performed in annexin V binding buffer (100 mM HEPES, 25 mM CaCl2, 1.4 M NaCl, pH 7.5) in accordance with the manufacturer's instruction (Sigma-Aldrich).
To detect phosphorylated proteins and the expression of the corresponding total proteins, cells were fixed using a Phosflow kit (BD Biosciences), incubated with Fc block, and stained with antibodies against intracellular and surface proteins according to the manufacturer's instructions (BD Biosciences). The antibodies used were: AF488-anti-phospho-AKT (Ser473), AF488-anti-phospho-AKT (Thr308), PE-anti-phospho S6 ribosomal protein (Thr235/Thr236), anti-phospho-FoxO1 (Thr24)/FoxO3a (Thr32), anti-FoxO1, anti-AKT (CST, Danvers, MA, USA), PE-anti-PTEN, PE-anti-phospho ERK and PE-anti-IRF4 mAbs (BD Biosciences). PE-anti-rabbit IgG Ab was used for the staining with unlabeled rabbit Abs.
To label proliferating cells, BrdU (0.8 mg/mL) was added to the drinking water for 6 days prior to the analysis. After cell surface staining, splenocytes were intracellularly stained with FITC-anti-BrdU mAb (BioLegend, san Diego, CA, USA) according to manufacturer's instructions (BD Biosciences). For Ki67 staining, spleen cells were fixed and permeabilized using the Foxp3/transcriptional factor staining buffer set (eBiosciences), and stained with the PE-anti-Ki67 mAb (BioLegend) according to the manufacturer's instructions. Full gating strategy in Supporting Information Fig. 1.
Real-time PCR
RNA was isolated from CD8+ T cells using an RNeasy Plus Mini kit (Qiagen, Hilden, Germany) and converted to complementary DNA (cDNA) using the M-MLV reverse transcriptase (Promega, WI, USA). cDNA was mixed with SYBR Green mix and the following primers: Pten, 5′-TGTGGTCTGCCAGCTAAAGGT-3′ and 5′-ACATGAACTTGTCCTCCCGC-3′; 18S rRNA, 5′-CTTCGCCATCACTGCCATTA-3′ and 5′-CACTCGCTCCACCTCATCCT-3′. The expression levels of mRNAs were determined using an ABI PRISM 7900HT real-time PCR system (Applied Biosystems, Foster City, CA, USA) and expressed as the ratio of each cDNA to that of 18S rRNA.
Adoptive transfer and immunization
CD8+ T-cells (>95%) were purified from the spleen of OT-I mice using anti-CD8 IMag (BD Biosciences). B6 mice were injected with 1:1 mixtures of Irf4+/+ and Irf4−/− OT-I cells via the tail vein (1–2 × 10⁶/mouse) and infected with LM-OVA. To examine recall responses, mice were immunized by i.v. inoculation with BMDCs (2.5 × 10⁵), and pulsed with OVA257–264 (1 μg/mL) for 2 h. BMDCs were generated by culturing bone marrow cells in the presence of GM-CFS (200 U/mL) for 6 days, and stimulating with lipopolysaccharide (500 ng/mL) during the last 16 h.
To compare the homeostatic proliferation of naïve CD8+ T cells, Rag2−/− mice were adoptively transferred with 1:1 mixtures of CD8+ T cells form Irf4+/+ and Irf4−/− mice (1 × 10⁶ cells each). To study the homeostatic proliferation of memory-phenotype CD8+ T cells, B6 mice were inoculated with a 1:1 mixture of Irf4+/+ and Irf4−/− OT-I cells and infected with LM-OVA. After more than 60 days, CD8+ T cells were prepared from the spleen and transferred into Rag2−/− mice.
Peripheral blood mononuclear cells, inguinal lymph node cells, and splenocytes were prepared, treated with Gey's solution, stained with mAbs, and analyzed using flow cytometry.
Statistical analysis
Statistical analyses were performed using GraphPad Prism version 5 (GraphPad, San Diego, CA, USA). The Student's paired t-test was used to compare the proportion or number of Irf4+/+ and Irf4−/− OT-I cells transferred into each mouse. Comparisons of two independent groups were performed using the Mann–Whitney test. **p < 0.01; *p < 0.05; ns, not significant. Data are presented as the mean ± standard error of the mean (SEM).
Acknowledgements
We thank Drs. H. Kosaka, Y. Takahama, and Y. Yoshikai for providing mice, Drs. Y. Yoshikai and H. Shen for providing LM-OVA, and Mrs. N. Kawamoto and Mrs. M. Kobayashi for technical assistance. This work was supported by the President's Discretionary Fund of Nagasaki University to M.M.; by Grants-in-Aid for Scientific Research from Japan Society for the Promotion of Science to M.M and K.Y.; and by the Global COE Program, Nagasaki University supported by Japan Society for the Promotion of Science. M.M. and K.Y. conceived and designed the study. M.M. performed the experiments. M.M. and K.Y. analyzed data and wrote the manuscript. K.H., D.K., and A.M. discussed and helped to interpret the results. T.M. provided Irf4−/− mice.
Conflict of interest
The authors declare no commercial or financial conflict of interest.
References
Abbreviations
-
- BMDC
-
- bone marrow-derived dendritic cells
-
- CFSE
-
- 5,6-carboxyfluorescein diacetate succinimidyl ester
-
- IRF4
-
- interferon regulatory factor 4
-
- LM-OVA
-
- Listeria monocytogenes expressing OVA
-
- mAb
-
- monoclonal antibody
-
- MHC
-
- major histocompatibility complex
-
- OVA
-
- ovalbumin
-
- PI3K
-
- phosphatidylinositol 3-kinase
-
- PTEN
-
- phosphatase and tensin homolog
-
- TCR
-
- T-cell receptor
-
- ΔMFIs
-
- differences in mean fluorescence intensities


