The additive burden of iron deficiency in the cardiorenal–anaemia axis: scope of a problem and its consequences
Abstract
Aims
Iron deficiency (ID), anaemia, and chronic kidney disease (CKD) are common co-morbidities in chronic heart failure (CHF) and all independent predictors of unfavourable outcome. The combination of anaemia and CKD in CHF has been described as the cardiorenal–anaemia syndrome. However, the role of ID within this complex interplay of co-existing pathologies is unclear.
Methods and results
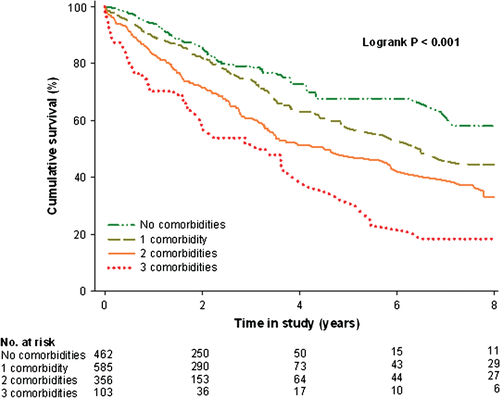
We studied the clinical correlates of ID (defined as ferritin <100 µg/L or 100–299 µg/L in combination with a transferrin saturation <20%, anaemia) and renal dysfunction (defined as estimated glomerular filtration rate <60 mL/min/1.73 m2) and their prognostic implications in an international pooled cohort, comprising 1506 patients with CHF. Mean age was 64 ± 13 years, 74.2% were male, and 47.3% were in NYHA functional class III. The presence of ID, anaemia, CKD, or a combination of these co-morbidities was observed in 69.3% of the patients. During a median (Q1–Q3) follow-up of 1.92 years (1.18–3.26 years), 440 patients (29.2%) died. Eight-year survival rates decreased significantly from 58.0% for no co-morbidities to 44.6, 33.0, and 18.4%, for one, two, or three co-morbidities, respectively (P < 0.001). Multivariate hazard models revealed ID to be the key determinant of prognosis, either individually (P = 0.04) or in combination with either anaemia (P = 0.006), CKD (P = 0.03), or both (P = 0.02).
Conclusions
Iron deficiency frequently overlaps with anaemia and/or CKD in CHF. The presence of ID amplifies mortality risk, either alone or in combination with anaemia, CKD, or both, making it a potential viable therapeutic target.
Introduction
Chronic heart failure (CHF) is best described as a systemic disease that also involves organs and tissues other than the heart. Anaemia and chronic kidney disease (CKD) are two frequently observed co-morbidities in CHF and both significantly influence morbidity and mortality.1, 2 In a large meta-analysis, anaemia was present in 37% of all the CHF patients,1 although incidence rates up to 60% have also been described.3, 4 Additionally, up to half of all patients with CHF have some form of renal dysfunction.5 Progression of renal dysfunction and anaemia can exacerbate CHF which, in turn, can cause more renal impairment and worsen anaemia.6 This vicious circle has been described by Silverberg et al. as the cardiorenal–anaemia syndrome (CRAS).7
Many factors may contribute to the development of CRAS, and often more than one aetiology is involved. Iron deficiency (ID) is part of the pathophysiology of anaemia in both CHF and CKD,8 which makes it an interesting treatment target in CRAS. Indeed, multiple studies have highlighted the potential clinical benefits of treating ID in anaemic and non-anaemic patients with CHF.9-12 Furthermore, ID with or without anaemia is common in CHF, relates to disease severity, and is itself an independent predictor of impaired exercise capacity, lower health-related quality of life, and poorer prognosis.13-15
The pathophysiological importance of ID within this constellation of adverse phenomena is less well described and its role in CHF patients with or without anaemia and/or renal dysfunction merits further investigation and greater clinical awareness. To date, the presence and potential harmful effects of these partly overlapping pathologies have only been discussed in theory.16 Does CRAS require additional terminology, such as the cardiorenal–iron deficiency syndrome (CRIDS) or even the cardiorenal–anaemia–iron deficiency syndrome (CRAIDS), to better characterize a patients' individual pathological condition and possible interventional requirements? The current study was initiated by a European iron consortium to provide evidence for and insight into these individual or combinations of co-morbidities and their underlying prognostic consequences in a diverse CHF population.
Methods
Component studies
The population of the present study consists of five cohorts from Poland, Spain, and the Netherlands, comprising 1506 CHF patients with reduced or preserved LVEF, as previously described.15 Preserved LV systolic function was defined as LVEF >45%, as proposed in previous guidelines.17 Inclusion and exclusion criteria per participating study cohort are presented in the Supplementary material online, Table S1. All study protocols were approved by local ethics committees and all patients gave separate written informed consent for this study. The study was conducted in accordance with the Declaration of Helsinki.
Pooled methodology
The pooled data in the current study were assessed at a patient level. All five cohorts selected for analysis had comparable clinical information available, including demographics, NYHA classification, current medical therapy, physical examination, plasma and serum biochemistry results, and LVEF (assessed via echocardiography or radionuclide ventriculography). None of the patients had received blood transfusions, erythropoietin therapy, or i.v. iron therapy at the time of study entry. Vital status was determined via direct contact with patients or relatives or review of CHF clinical databases or hospital records. No patient was lost to follow-up and none received LV assist device therapy during follow-up. The endpoint for the present study was all-cause mortality. Follow-up for survivors with events was censored when <5% of the cohort was at risk (after 8 years).
Iron status and other laboratory measurements
Peripheral venous blood samples were collected from all patients. Haematological indices were assessed in fresh venous blood using EDTA. After centrifugation, the remainder was frozen and stored prior to analysis. Anaemia was defined as a haemoglobin level <12 g/dL in women and <13 g/dL in men.18 The following blood biomarkers reflecting iron status were measured: ferritin (µg/L), serum iron (µg/L), total iron binding capacity (µg/L), and transferrin (mg/dL). Transferrin measurements were available for most patients (n = 1202), so transferrin saturation (TSAT) was reported as a ratio of 0.7217 × serum iron and transferrin, multiplied by 100.19 When transferrin was not available (n = 304), TSAT was reported as a ratio of serum iron (µg/L) and TIBC (µg/L) multiplied by 100. There was a strong correlation between both TSAT measurements (R2 = 0.89, P < 0.001). Iron deficiency was defined as a ferritin level <100 μ g/L or serum ferritin 100–299 µg/L in combination with a TSAT <20%. Similar definitions of ID have been used in recent observational and intervention trials in chronic HF.12-14, 20 Concentrations of NT-proBNP (pg/mL) were measured using an immunoassay based on electrochemiluminescence on the Elecsys System (Roche Diagnostics). Renal function was assessed by estimating the glomerular filtration rate (eGFR, mL/min/1.73 m2) using the simplified Modification of Diet in Renal Disease (MDRD) equation. Chronic kidney disease was defined as an eGFR <60 mL/min/1.73 m2.21 Serum concentrations of high sensitivity C-reactive protein (hs-CRP, mg/L) were assessed at each institution using standard methods.
Statistical analyses
Data are expressed as means ± SD when normally distributed, as medians with lower and upper quartiles when non-normally distributed, or as numbers and percentages for categorical variables. Baseline characteristics were stratified by NYHA functional class. Intergroup differences were tested using the analysis of variance (ANOVA) test, Kruskal–Wallis test, or Pearson's χ2 test, when appropriate. For further analyses, skewed variables (NT-proBNP and hs-CRP) were transformed to a 2-log scale to achieve a normal distribution. This means that risk estimates should be interpreted as the relative risk if values were doubled (e.g. 2–4 mg/L).
Multiple logistic regression models were constructed to establish clinical determinants of iron deficiency anaemia (IDA), CRIDS, CRAS, and CRAIDS. All baseline variables with a significant univariate association with each individual syndrome (P < 0.10) were entered in a stepwise backward multivariable model based on the strength of their univariate association. Additional bootstrap resampling (1000 cycles) of the multivariable model was performed to validate the estimated model. Variables selected >700 times were assumed to be accurate.
Kaplan–Meier curves were constructed to demonstrate the impact of an increasing number of co-morbidities on cumulative survival. Differences in event-free survival rates were tested using the logrank test. Cox proportional hazard regression models were used to calculate the predictive value of an increasing number of overlapping pathologies or individual (e.g. ID without anaemia and CKD) and combinations of co-morbidities (e.g. IDA or CRIDS) for mortality. The proportionality assumption for the Cox regression analysis was evaluated using Schoenfeld residuals and was proven to hold for both analyses (χ2 17.91; P = 0.27 and χ2 19.88; P = 0.40, respectively). In two consecutive models, adjustment was made for age, sex, and a multivariable model including all variables with a significant univariate association. Reported probability values are two sided, and a P-value <0.05 was considered statistically significant. All statistical models and analyses were performed using STATA version 11.0 (StataCorp LP, College Station, TX, USA).
Results
Baseline characteristics for all 1506 patients, stratified by NYHA functional class, are presented in Table 1. Overall, mean age was 64 ± 13 years and 74.2% were male. The mean haemoglobin level was 13.6 ± 1.8 g/dL and the mean eGFR was 79.9 ± 34.0 mL/min/1.73 m2. Levels of the iron status markers ferritin and TSAT were 154 µg/L (82–280) and 22.3% (14.5–32.7), respectively. Characteristics and individual or combined syndromes per participating cohort were also described (Supplementary material online, Table S2).
| Variables | All patients, n = 1506 | NYHA class I, n = 121 | NYHA class II, n = 577 | NYHA class III, n = 712 | NYHA class IV, n = 96 | P-value |
|---|---|---|---|---|---|---|
| Age (years) | 64 ± 13 | 58 ± 14 | 62 ± 13 | 66 ± 13 | 67 ± 15 | <0.001 |
| Male, n (%) | 1117 (74.2) | 107 (88.4) | 446 (77.3) | 501 (70.4) | 63 (65.6) | <0.001 |
| BMI (kg/m2) | 27.1 ± 5.9 | 27.7 ± 5.6 | 27.5 ± 4.9 | 26.7 ± 5.9 | 25.0 ± 7.3 | <0.001 |
| Ischaemic aetiology, n (%) | 907 (60.2) | 76 (62.8) | 348 (60.3) | 425 (59.7) | 58 (60.4) | 0.94 |
| LVEF (%) | 33 ± 14 | 35 ± 12 | 34 ± 13 | 32 ± 14 | 28 ± 13 | <0.001 |
| HFrEF, n (%) | 1314 (87.3) | 106 (87.6) | 504 (87.4) | 619 (86.9) | 85 (88.5) | 0.97 |
| Co-morbidities, n (%) | ||||||
| ID alonea | 354 (23.5) | 32 (26.5) | 152 (26.3) | 153 (21.5) | 17 (17.7) | 0.04 |
| Anaemia aloneb | 105 (7.0) | 6 (5.0) | 40 (6.9) | 52 (7.3) | 7 (7.3) | 0.83 |
| CKD alonec | 126 (8.4) | 6 (5.0) | 35 (6.1) | 75 (10.5) | 10 (10.5) | 0.01 |
| IDA | 158 (10.5) | 10 (7.9) | 46 (8.0) | 87 (12.2) | 15 (15.6) | 0.02 |
| CRAS | 60 (4.0) | 5 (4.1) | 16 (2.8) | 33 (4.6) | 6 (6.3) | 0.23 |
| CRIDS | 138 (9.2) | 3 (2.5) | 26 (4.5) | 67 (9.4) | 13 (14.0) | <0.001 |
| CRAIDS | 103 (6.8) | 3 (2.5) | 24 (4.2) | 59 (8.3) | 17 (17.7) | <0.001 |
| Diabetes mellitus | 526 (34.9) | 39 (32.2) | 127 (27.2) | 278 (39.0) | 52 (54.2) | <0.001 |
| AF | 296 (19.7) | 19 (15.7) | 103 (17.9) | 158 (22.2) | 16 (16.7) | 0.12 |
| Hypertension | 306 (20.3) | 38 (31.4) | 120 (20.8) | 138 (19.4) | 10 (10.4) | 0.001 |
| Laboratory values | ||||||
| Haemoglobin (g/dL) | 13.6 ± 1.8 | 14.0 ± 1.5 | 13.8 ± 1.7 | 13.4 ± 1.9 | 13.0 ± 2.2 | 0.001 |
| MCV (fL)d | 90.9 ± 5.9 | 90.1 ± 5.7 | 91.1 ± 5.5 | 90.8 ± 6.0 | 91.0 ± 6.9 | 0.44 |
| Serum iron (µg/L) | 73 (49–105) | 93 (66–121) | 86 (58–118) | 64 (42–94) | 60 (42–94) | <0.001 |
| Ferritin (µg/L) | 154 (82–280) | 173 (87–278) | 164 (91–296) | 149 (79–267) | 136 (74–242) | 0.06 |
| TSAT (%) | 22.3 (14.5–32.7) | 27.3 (19.3–40.2) | 25.8 (17.6–36.6) | 19.1 (17.6 –28.9) | 18.0 (12.0–27.5) | <0.001 |
| hs-CRP (mg/L)e | 2.9 (1.3–6.9) | 1.6 (1.1–4.7) | 2.0 (1.2–4.9) | 3.8 (1.6–9.0) | 5.1 (1.9–11.0) | <0.001 |
| NT-proBNP (pg/mL) | 1395 (550–3572) | 606 (233–1622) | 963 (431–2184) | 1869 (853–4402) | 4094 (1426–9684) | <0.001 |
| Sodium (mmol/L) | 139.1 ± 5.4 | 140.7 ± 3.0 | 140.0 ± 3.4 | 138.4 ± 6.7 | 137.1 ± 5.4 | 0.01 |
| eGFR (mL/min/1.73 m2) | 79.9 ± 34.2 | 92.5 ± 35.0 | 86.4 ± 31.9 | 74.0 ± 33.9 | 70.1 ± 34.2 | <0.001 |
| Treatment, n (%) | ||||||
| ACE inhibitor and/or ARB | 1369 (90.9) | 115 (95.0) | 534 (92.6) | 646 (90.7) | 74 (77.1) | <0.001 |
| Beta-blocker | 1354 (89.9) | 118 (97.5) | 550 (95.3) | 600 (89.6) | 86 (84.3) | <0.001 |
| Loop diuretic | 1193 (79.2) | 58 (47.9) | 404 (70.0) | 644 (90.5) | 87 (90.6) | <0.001 |
| MRA | 768 (50.1) | 42 (34.9) | 270 (46.9) | 396 (55.6) | 55 (56.8) | <0.001 |
| Statin | 964 (64.0) | 87 (71.9) | 409 (70.9) | 410 (57.6) | 58 (60.4) | <0.001 |
| Antiplatelet and/or anticoagulant | 1265 (84.0) | 96 (79.3) | 486 (84.2) | 607 (85.3) | 76 (79.2) | 0.21 |
- Values are means (standard deviation), medians (interquartile range), or proportions (%).
- BMI, body mass index; CKD, chronic kidney disease; CRAS, cardiorenal–anaemia syndrome; CRAIDS, cardiorenal–anaemia–iron deficiency syndrome; CRIDS, cardiorenal–iron deficiency syndrome; eGFR, estimated glomerular filtration rate; HF, heart failure; HFrE, heart failure with reduced ejection fraction; hs-CRP, high sensitivity C-reactive protein; ID, iron deficiency; IDA, iron deficiency anaemia; MCV, mean corpuscular volume; MRA, mineralocorticoid receptor antagonist; TSAT, transferrin saturation.
- a ID was defined as ferritin <100 µg/L or 100–299 µg/L with a TSAT <20%.
- b Anaemia was defined as haemoglobin <12 g/dL in women and <13 g/dL in men.
- c CKD was defined as an eGFR <60 mL/min/1.73 m2.
- d MCV was measured in 1123 patients.
- e hs-CRP was measured in 1000 patients.
Prevalence of individual and combined co-morbidities
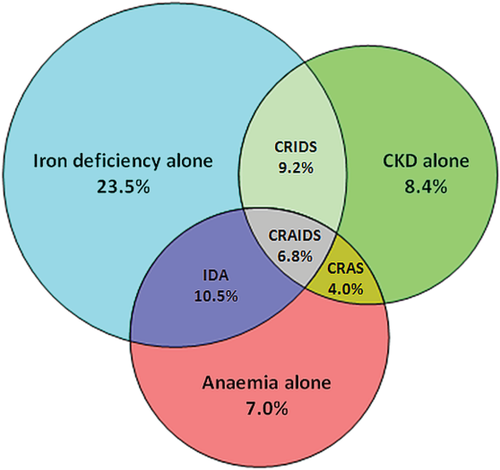
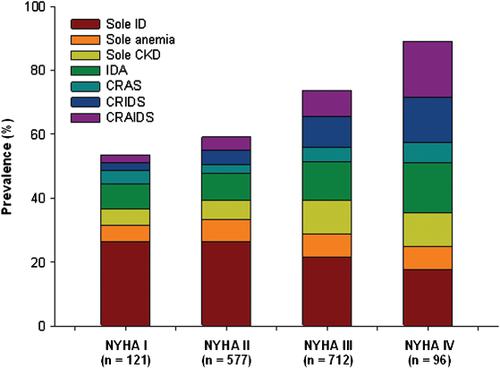
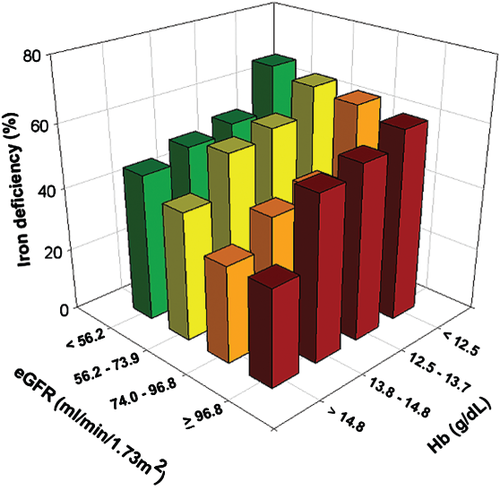
The prevalence of individual co-morbidities and overlap in co-morbidities is displayed in Figure 1. Overall, ID, anaemia, or CKD was present in 50.0, 28.3, and 28.4%, respectively, with a global prevalence of 69.3% for at least one of these co-morbidities. The prevalence of combined co-morbidities rose with increasing NYHA class (Figure 2). Iron deficiency was more common in patients with vs. without CKD (56.4% vs. 47.4%, P = 0.002), and in patients with vs. without anaemia (61.2% vs. 45.6%, P < 0.001). Stratification by quartiles of haemoglobin and renal function (expressed as eGFR) showed an increase in ID with decreasing haemoglobin levels and worse renal function (Figure 3). Even in the highest quartile of both haemoglobin and eGFR, the prevalence of ID was still >30%. The presence of diabetes was more common in patients with IDA, CRAS, or CRAIDS (with vs. without; all P < 0.01), but not for CRIDS or lone co-morbidities (with vs. without; all P > 0.05).
Clinical determinants of combined syndromes in chronic heart failure
Multivariable logistic regression analyses are described in Table 2. Both age and hs-CRP had a strong positive association with all combinations of syndromes. In addition, hs-CRP was not associated with lone co-morbidities (all P > 0.05), suggesting an inflammatory background when a combination of co-morbidities is present. Haemoglobin was a powerful predictor for CRIDS, whereas renal function was strongly predictive for IDA, and TSAT—but not ferritin levels—for CRAS. Furthermore, levels of NT-proBNP were only associated with a combined syndrome when renal dysfunction was involved, whereas mean corpuscular volume was only associated with a combined syndrome if patients were iron deficient. In bootstrap analyses, these variables remained highly selected for each syndrome. Interestingly, diabetes was only associated with the presence of IDA, CRAS, or CRAIDS—and not CRIDS—in univariate regression analyses (Supplementary material online, Table S3). However, this significance was lost in multivariable analyses.
| Variables | IDA, OR (95% CI) | P-value | CRIDS, OR (95% CI) | P-value | CRAS, OR (95% CI) | P-value | CRAIDS, OR (95% CI) | P-value |
|---|---|---|---|---|---|---|---|---|
| Age (per 5 years) | 1.30 (1.10–1.53) | 0.002 | 1.25 (1.07–1.46) | 0.005 | 1.64 (1.41–2.83) | <0.001 | 1.44 (1.13–1.86) | 0.003 |
| Haemoglobin (per 1 g/dL) | NA | NA | 0.73 (0.48–0.92) | 0.001 | NA | NA | NA | NA |
| MCV (per 1 fL)a | 0.91 (0.86–0.97) | 0.002 | 0.93 (0.87–0.98) | 0.010 | – | – | 0.88 (0.80–0.96) | 0.005 |
| TSAT (per 5%) | NA | NA | NA | NA | 0.63 (0.49–0.82) | <0.001 | NA | NA |
| eGFR (per 5 mL/min/1.73 m2) | 0.85 (0.76–0.91) | <0.001 | NA | NA | NA | NA | NA | NA |
| hs-CRP (per doubling)b | 1.28 (1.07–1.55) | 0.010 | 1.24 (1.04–1.46) | 0.01 | 1.17 (1.04–1.32) | 0.008 | 1.43 (1.10–1.87) | 0.008 |
| NT-proBNP (per doubling) | – | – | 1.65 (1.33–2.05) | <0.001 | 1.45 (1.07–1.98) | 0.02 | 1.51 (1.11–1.76) | <0.001 |
- Values are odds ratios ± 95% confidence intervals. a Mean corpuscular volume was measured in 1123 patients. b High-sensitive C-reactive protein was measured in 1000 patients.
- CI, confidence interval; CRAS, cardiorenal–anaemia syndrome; CRAIDS, cardiorenal–anaemia–iron deficiency syndrome; CRIDS, cardiorenal–iron deficiency syndrome; eGFR, estimated glomerular filtration rate; hs-CRP, high sensitivity C-reactive protein; IDA, iron deficiency anaemia; MCV, mean corpuscular volume; NA, not applicable; OR< odds ratio; TSAT, transferrin saturation.
Association of co-morbidities with prognosis in chronic heart failure
During a median follow-up of 1.92 years (1.18–3.26 years), 440 patients (29.2%) died. No significant association was observed between study cohort and outcome (P = 0.78). Similarly, interaction analyses revealed no significant association between study cohort and ID (P = 0.62), anaemia (P = 0.18), or CKD (P = 0.51). Eight-year event-free survival rates significantly decreased from 58.0% [95% confidence interval (CI) 42.6–70.6%], to 44.6% (95% CI 35.8–53.2%), 33.0% (95% CI 25.2–41.1%), and 18.4% (95% CI 9.0–30.3%) when the number of co-morbidities present increased from no co-morbidity to all three co-morbidities together (log rank P < 0.001) (Figure 4). In consecutive hazard regression models, the risk for mortality was significantly enhanced with an increasing number of co-morbidities (Table 3). Each individual or combination of co-morbidities also predicted poor survival (Table 3). Subsequent multivariable analyses revealed ID to remain independently associated with an increased mortality risk, either alone or in combination with either CKD, anaemia, or both (Table 3).
| Variable | Age- and sex-adjusted HR (95% CI) | Z | P-value | Multivariablea HR (95% CI) | Z | P-value |
|---|---|---|---|---|---|---|
| One co-morbidity | 1.34 (1.03–1.76) | 2.14 | 0.03 | 1.31 (0.98–1.77) | 1.82 | 0.07 |
| Two co-morbidities | 2.04 (1.54–2.73) | 4.90 | <0.001 | 1.62 (1.16–2.26) | 2.66 | 0.008 |
| Three co-morbidities | 3.12 (2.18–4.44) | 6.27 | <0.001 | 1.83 (1.17–2.85) | 2.83 | 0.005 |
| ID alone | 1.49 (1.03–1.83) | 1.65 | 0.04 | 1.42 (1.02–1.98) | 2.04 | 0.04 |
| Anaemia alone | 1.95 (1.27–2.98) | 3.07 | 0.002 | 1.42 (0.83–2.42) | 1.27 | 0.20 |
| CKD alone | 1.58 (1.05–1.95) | 1.99 | 0.02 | 1.09 (0.73–1.64) | 0.44 | 0.66 |
| IDA | 1.86 (1.28–2.70) | 3.26 | 0.001 | 1.88 (1.20–2.94) | 2.75 | 0.006 |
| CRAS | 2.45 (1.60–3.77) | 4.10 | <0.001 | 1.21 (0.70–2.09) | 0.67 | 0.50 |
| CRIDS | 2.07 (1.47–2.92) | 4.16 | <0.001 | 1.55 (1.04–2.30) | 2.18 | 0.03 |
| CRAIDS | 3.15 (2.20–4.49) | 6.31 | <0.001 | 1.73 (1.11–2.72) | 2.40 | 0.02 |
- Values are hazard ratios ± 95% confidence intervals.
- CI, confidence interval; CKD, chronic kideny disease; CRAS, cardiorenal–anaemia syndrome; CRAIDS, cardiorenal–anaemia–iron deficiency syndrome; CRIDS, cardiorenal–iron deficiency syndrome; HR, hazard ratio; ID, iron deficiency; IDA, iron deficiency anaemia.
- a Multivariate model is adjusted for all univariate significant variables (age, sex, body mass index, LVEF, NYHA functional class, presence of diabetes, levels of sodium, NT-proBNP, and high sensitivity C-reactive protein, treatment with ACE inhibitors and/orARBs, statins, loop diuretics, and study centre.)
Discussion
In this large pooled cohort of diverse CHF patients, ID is common and frequently overlaps with anaemia, CKD, or both. The prevalence of ID increases with worse renal function and/or haemoglobin levels. Finally, the presence of ID alone or in combination with anaemia, CKD, or both was independently associated with an increased risk of death.
Prevalence of individual or combined co-morbidities
Both CKD and anaemia in HF have received a great deal of attention in recent decades. Renal dysfunction is often involved in CHF since both organs have an interdependent role in blood pressure control and blood volume homeostasis. Another common co-morbidity in CHF is anaemia, its prevalence increasing with the severity of concomitant renal impairment.22 In turn, anaemia can worsen CHF and CKD, leading to the vicious circle called CRAS.7 Scrutinio et al. found that CRAS was present in 21.1% of 951 patients with systolic HF,22 whereas a prevalence of 29.9% in 748 HF patients was reported by Lu et al.23 In the present study, we found a prevalence of 4.0% for CRAS. This lower prevalence could be partially explained by the fact that we did not include the presence of ID in the definition of CRAS.
In recent years, more research has been focusing on the prevalence and prognostic role of ID in patients with CHF. However, since there is no clear-cut definition for ID in patients with HF, a wide variation in prevalence has been reported.15, 20, 24 One study, which used the gold standard of bone marrow iron staining, found that 73% of patients with advanced HF and anaemia had depleted iron stores.25 Nonetheless, the criteria most commonly used and implemented in the most recent HF guidelines of the European Society of Cardiology are a ferritin level <100 µg/L or ferritin 100–299 µg/L in combination with a TSAT <20%.17 Using this definition, we demonstrated that the prevalence of ID alone, IDA, CRIDS, or CRAIDS was 23.5, 10.5, 9.2, and 6.8%, respectively.
Predictors of combined co-morbidities
Both increasing age and higher hs-CRP levels were independently correlated with all combined syndromes. Older age is a well-known risk factor for ID, anaemia, or CKD in CHF. Additionally, the positive association of hs-CRP levels with all combined syndromes suggests that the underlying pathophysiological interplay between ID, anaemia, and CKD may have an inflammatory origin. Furthermore, hs-CRP was not associated with any lone co-morbidity in this study, supporting this inflammatory hypothesis when only a combination of co-morbidities is present. Indeed, CHF patients often present with a low-grade generalized inflammatory status which is characterized by trapping of iron within the cells of the reticuloendothelial system leading to functional ID, a major component of anaemia of chronic disease.26 In addition, we observed a significant univariate relationship between diabetes and all combined syndromes (except for CRIDS), though this significance was lost in multivariable analyses. It has been suggested that diabetics are more prone to develop both anaemia and renal dysfunction compared to non-diabetics. However, only iron overload has been associated with diabetes,27 which does not explain the observed association with IDA. The role of diabetes in the presence of ID, anaemia, or CKD remains to be elucidated.
Prognosis and clinical implications
Both CKD and anaemia have been extensively described as prognostic risk factors in CHF.1, 2 However, only a few studies have reported on ID as an independent outcome predictor.15, 20, 24 In this study, we demonstrate for the first time that ID, either alone or in combination with anaemia, CKD, or both, is associated with increased mortality. Our findings and recent literature suggest that the currently used term CRAS may neglect the clinical and prognostic importance of ID in CHF, both within and mostly beyond the process of erythropoiesis. Besides its clinical consequences directly related to erythropoiesis, iron plays an important role in oxygen storage (in myoglobin) and oxygen metabolism in skeletal and heart muscle (in oxidative enzymes and respiratory chains proteins). Even in non-anaemic patients, ID has been associated with decreased aerobic performance and exercise intolerance.28 Moreover, structural abnormalities in cardiac myocytes have also been reported.29 Therefore, maintaining normal iron metabolism is crucial, especially for cells of high mitogenic potential (e.g. haematopoietic cells) or high energy demand (e.g. skeletal myocytes and cardiomyocytes).
The role of ID in CHF patients, with or without anaemia and/or CKD, therefore merits clinical awareness and more insight into the pathophysiology and interplay between ID, anaemia, and CKD is warranted. If patients with HF, renal dysfunction, and ID were to show clinical improvements, even in the absence of anaemia, the acronym CRIDS might possibly be introduced into the clinical field. Indeed, a recent substudy of the FAIR-HF trial showed similar results in both anaemic and non-anaemic patients treated with ferric carboxymaltose on both primary and secondary study endpoints.30 However, confirmation of these findings from ongoing and future clinical trials is warranted to determine whether more accurate terminology, such as CRIDS, is needed to describe specific combinations of these adverse phenomena and their possible treatment requirements. In addition, despite the association of ID with prognosis, observed in this and previous studies, to date there is no evidence about the effects of iron replacement therapy on patients' survival in CHF.
Limitations
First, the present cohort study was retrospective. However, all data were assessed at a patient level, no patient was lost to follow-up, and the duration of follow-up makes it relevant to clinicians. Our study also complies with the guidelines for observational studies.31 Secondly, the present study only collected data from a single time point, so cannot comment on the effects of changes in iron status, haemoglobin, or renal function over time. More studies with serial measurements over time are warranted. Thirdly, no follow-up information was available regarding treatment of deficiencies or device therapy (except for LV assist device therapy). In addition, despite the fact that none of the patients received blood transfusions, erythropoietin therapy, or i.v. iron therapy at the time of study entry, we do not have an exact time scale of all patients, regarding these treatments, that precluded them taking part in the current analysis. Fourthly, red cell distribution width (RDW) was not measured in this study. It has been suggested that RDW reflects ID, anaemia, and renal dysfunction and is an independent predictor of mortality.32 Furthermore, no information on hospitalizations (cardiovascular or HF), heart transplantation, or cause of death was available for the present analysis. More studies on ID, anaemia, CKD, and combinations of these co-morbidities and their association with cardiovascular and HF hospitalizations or mortality are needed. Finally, accurate diagnosis of ID in chronic HF is mandatory. Although current definitions of ID, based on blood markers, may be unreliable, using the gold standard (bone marrow iron staining) in every CHF patient suspected of ID, is unrealistic. Patients with CHF, CKD, or both present with a generalized inflammatory status and activation and production of inflammatory cytokines and acute phase proteins, such as ferritin. Therefore, it might be better to use a higher cut-off for ferritin to define ID in patients with CHF or CKD.33, 34 Nevertheless, more studies are needed to identify potential new or additional serum markers reflecting iron status and to compare them with the gold standard of bone marrow iron staining.
Conclusions
Iron deficiency, either alone or overlapping with anaemia, CKD, or both, is common in CHF and its prevalence increases with worse renal function and lower haemoglobin levels. The presence of overlapping co-morbidities increases with disease severity. In this study, ID is a key determinant of prognosis, either alone or in combination with anaemia, CKD, or both, making it a potential therapeutic target in these high risk patients.
Conflict of interest: E.A.J. received speaker and advisory board fees from Vifor Pharma and related travel expenses from Vifor Pharma; A.A.V. received speaker fees and an unrestricted educational grant from Vifor Pharma; D.J.v.V. received board membership fees from Vifor Pharma and Amgen Inc.; P.P. received speaker and consulting fees from Vifor Pharma and Amgen Inc. and related travel expenses from Vifor Pharma and Amgen Inc.; J.C.C. has received speaker fees from Vifor Pharma; P.v.d.M. has received speaker fees, related travel expenses, and an unrestricted educational grant from Vifor Pharma; Wroclaw Medical University received an unrestricted grant from Vifor Pharma. All other authors have no conflicts to declare.


