Mediterranean diet and risk of heart failure: results from the PREDIMED randomized controlled trial. Eur J Heart Fail 2017;19:1179–1185. doi: 10.1002/ejhf.750
Some departures from the individual randomization protocol affecting a small subset of participants in the PREvención con DIeta MEDiterránea (PREDIMED) trial (at most 14%) have recently been reported in the re-publication of the main PREDIMED paper.1 For this reason, the authors wish to make the following clarifications and corrections to their original PREDIMED sub-study examining the effect of the Mediterranean diets (MedDiets), supplemented with extra-virgin olive oil (EVOO) or nuts, on the risk of heart failure.2
In the original sub-study, as reported in detail elsewhere,1 some participants (n = 425, or 5.7% of the total sample) were directly allocated, since they were recruited, to the same arm of the trial as their relatives because a previous member of the same household (usually the spouse) was already randomized in the trial. Also, centre D, one of the 11 recruiting centres (n = 646, or 8.7% of the total sample), had allocated a subset of its participants by clusters (clinics), instead of using individual randomization (35 participants from centre D were also second household members).
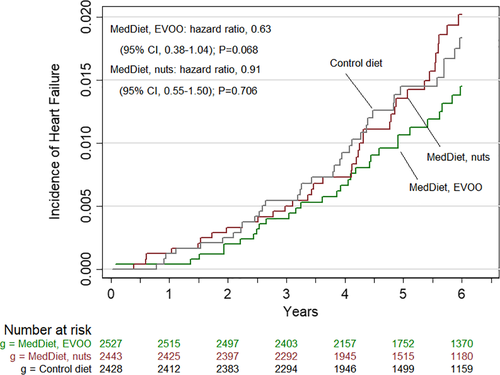
The authors have re-analysed the effect of the intervention on the incidence of heart failure after adjusting for propensity scores (built with 30 predictors of allocation to each intervention group) and using a robust estimate of the variance to correct for intra-cluster correlation, considering the members of the same household and the participants in the same clinics of centre D as clusters. The corrected Table 2 and Figure 1 (see below; all corrections are marked in bold characters) show the corrected estimates for the outcome, as compared with those reported in the original paper. In consistency with the published paper,2 the unadjusted hazard ratios (HR) did not indicate significant associations for the MedDiet + EVOO [HR 0.63; 95% confidence interval (CI) 0.38–1.04] and MedDiet + nuts (HR 0.91; 95% CI 0.55–1.50), compared with the control group. Results from the multivariate analyses (Table 2) also remained unchanged.
| Mediterranean diet + EVOO (n = 2527) | Mediterranean diet + nuts (n = 2444) | Control diet (n = 2432) | P-value | ||
|---|---|---|---|---|---|
| Mediterraneandiet + EVOO vs. control | Mediterranean diet + nuts vs. control | ||||
| Cases (n = 94) | 29 | 33 | 32 | ||
| Person-years of follow-up | 11 737 | 10 279 | 9664 | ||
| Crude rate/1000 person-years (95% CI) | 2.5 (1.7–3.5) | 3.2 (2.2–4.5) | 3.3 (2.3–4.7) | ||
| Original hazard ratios (95% CI) | |||||
| New hazard ratios (95% CI) | |||||
| Crude model* | 0.68 (0.41–1.13) | 0.92 (0.56–1.49) | 1 (ref.) | 0.139 | 0.725 |
| Crude model†,a | 0.63 (0.38–1.04) | 0.91 (0.55–1.50) | 1 (ref) | 0.068 | 0.706 |
| Age- and sex-adjusted model* | 0.71 (0.43–1.19) | 0.98 (0.60–1.61) | 1 (ref.) | 0.193 | 0.943 |
| Age- and sex-adjusted model†,a | 0.66 (0.40–1.09) | 0.99 (0.60–1.63) | 1 (ref) | 0.104 | 0.961 |
| Multivariate adjusted model 1*,b | 0.77 (0.46–1.28) | 1.04 (0.64–1.71) | 1 (ref.) | 0.312 | 0.864 |
| Multivariate adjusted model 1‡,c | 0.76 (0.46–1.28) | 1.16 (0.70–1.93) | 1 (ref) | 0.303 | 0.559 |
| Multivariate adjusted model 2*,d | 0.78 (0.46–1.30) | 1.07 (0.65–1.76) | 1(ref.) | 0.336 | 0.792 |
| Multivariate adjusted model 2‡,e | 0.77 (0.46–1.28) | 1.18 (0.71–1.95) | 1 (ref) | 0.310 | 0.527 |
| Multivariate adjusted model 3*,f | 0.74 (0.44–1.24) | 1.01 (0.61–1.66) | 1(ref.) | 0.248 | 0.981 |
| Multivariate adjusted model 3‡,g | 0.73 (0.43–1.24) | 1.12 (0.67–1.87) | 1 (ref) | 0.244 | 0.659 |
| Excluding centre D and second members of the same household | |||||
| Cases (n = 74) | 18 | 29 | 27 | ||
| Person-years of follow-up | 9819 | 8921 | 8536 | ||
| Crude rate/1000 person-years (95% CI) | 1.8 (1.2–2.9) | 3.3 (2.3–4.7) | 3.2 (2.2–4.6) | ||
| Multivariate adjusted model 3‡,g | 0.66 (0.35-1.25) | 1.18 (0.68-2.04) | 1 (ref) | 0.205 | 0.558 |
- CI, confidence interval; EVOO, extra-virgin olive oil.
- * Models were stratified according to centre and history of diabetes and used robust variance estimators.
- † Models were stratified according to centre and history of diabetes.
- ‡ Models were stratified according to centre, sex and education (four categories).
- a Models used robust estimate of the variance adjusted for intra-cluster correlation, considering the members of the same household and the participants in the same clinics of centre D as clusters.
- b Adjusted for age, sex, education (four categories), smoking (three categories), waist-to-height ratio (continuous), physical activity (METS-min/d), dyspnea symptoms at baseline (three categories) and non-AF arrhythmias at baseline.
- c Adjusted for age, smoking (three categories), waist-to-height ratio (continuous), physical activity (METS-min/day), dyspnoea symptoms at baseline (three categories), non-atrial fibrillation arrhythmias at baseline and history of diabetes. Models used robust estimates of the variance adjusted for propensity scores and intra-cluster correlation, considering the members of the same household and the participants in the same clinics of centre D as clusters.
- d Adjusted for (b), history of hypertension, history of dyslipidaemia, family history of premature coronary heart disease and baseline prevalence of atrial fibrillation.
- e Adjusted for (c) and history of hypertension, history of dyslipidaemia, family history of premature coronary heart disease and baseline prevalence of atrial fibrillation. Models used robust estimates of the variance adjusted for propensity scores and intra-cluster correlation, considering the members of the same household and the participants in the same clinics of centre D as clusters.
- f Adjusted for (d) and baseline energy intake (kcal/day).
- g Adjusted for (e) and baseline energy intake (kcal/day). Models used robust estimates of the variance adjusted for propensity scores and intra-cluster correlation, considering the members of the same household and the participants in the same clinics of centre D as clusters.

As a sensitivity analysis, we also re-analysed the data after excluding participants from centre D and those who were members of the same household (Table 2). The new multivariate adjusted HRs for heart failure were 0.66 (95% CI 0.35–1.25) and 1.18 (95% CI 0.68–2.04) for the MedDiet + EVOO and the MedDiet + nuts groups, respectively, compared with the control group.
Importantly, the key message from the original article does not change and the final conclusions remain the same.


