Long-term cumulative high-sensitivity cardiac troponin T and mortality among patients with acute heart failure
Lihua Zhang and Guangda He contributed equally.
Abstract
Aims
This study aimed to evaluate the cumulative high-sensitivity cardiac troponin T (hs-cTNT) from admission to 12 months after discharge and its association with mortality after 12 months among patients with acute heart failure (HF).
Methods
We used data from the China Patient-Centered Evaluative Assessment of Cardiac Events Prospective Heart Failure Study (China PEACE 5p-HF Study), which enrolled patients hospitalized primarily for HF from 52 hospitals between 2016 and 2018. We included patients who survived within 12 months and had hs-cTNT data at admission (within 48 h of admission) and 1 and 12 months after discharge. To evaluate the long-term cumulative hs-cTNT, we calculated cumulative hs-cTNT levels and cumulative times of high hs-cTNT level. Patients were divided into groups according to the quartiles of cumulative hs-cTNT levels (Quartiles 1–4) and cumulative times of high hs-cTNT levels (0–3 times). Multivariable Cox models were constructed to examine the association of cumulative hs-cTNT with mortality during the follow-up period.
Results
We included 1137 patients with a median age of 64 [interquartile range (IQR), 54–73] years; 406 (35.7%) were female. The median cumulative hs-cTNT level was 150 (IQR, 91–241) ng/L*month. Based on the cumulative times of high hs-cTNT levels, 404 (35.5%) patients were with zero time, 203 (17.9%) with one time, 174 (15.3%) with two times, and 356 (31.3%) with three times. During a median follow-up of 4.76 (IQR, 4.25–5.07) years, 303 (26.6%) all-cause deaths occurred. The increasing cumulative hs-cTNT level and cumulative times of high hs-cTNT level were independently associated with excess all-cause mortality. Compared with Quartile 1 group, Quartile 4 had the highest hazard ratio (HR) of all-cause mortality [4.14; 95% confidence interval (CI): 2.51–6.85], followed by Quartile 3 (HR: 3.35; 95% CI: 2.05–5.48) and Quartile 2 (HR: 2.47; 95% CI: 1.49–4.08) groups. Similarly, taking the patients with zero time of high hs-cTNT level as the reference, the HRs were 1.60 (95% CI: 1.05–2.45), 2.61 (95% CI: 1.76–3.87), and 2.86 (95% CI: 1.98–4.14) in patients who had one, two, and three times of high hs-cTNT level, respectively.
Conclusions
Elevated cumulative hs-cTNT from admission to 12 months after discharge was independently associated with mortality after 12 months among patients with acute HF. Repeated measurements of hs-cTNT after discharge may help monitor the cardiac damage and identify patients with high risk of death.
Introduction
Cardiac troponin T is a classic biomarker in the diagnosis and prognosis of myocardial infarction.1, 2 In recent years, data have demonstrated that elevated high-sensitivity cardiac troponin T (hs-cTNT) levels are prevalent in patients with acute heart failure (HF) and usually associated with excess risk of adverse clinical outcomes.3, 4 It was reported that approximately 90% of patients with acute HF had elevated hs-cTNT levels, suggesting a degree of cardiac damage even in the absence of clinically apparent myocardial ischaemia.5, 6 A better understanding of long-term hs-cTNT and its effects on the outcomes among patients with acute HF could help guide physicians to monitor the cardiac damage and identify high-risk patients.1, 7
However, limited data are available regarding assessing the effects of long-term cumulative hs-cTNT on outcome events. Most previous studies evaluated the association of hs-cTNT with outcomes via a single measurement.4, 8 However, the hs-cTNT levels might fluctuate with treatment and HF progression, and a single time-point measurement might be insufficient to reflect the cardiac damage for a long-term period.6 Recent studies have proposed the concept of cumulative levels, a method that captures both the duration and intensity of a given parameter and has been used for analysing lipids, blood pressure, and triglyceride-glucose index.9-12 This method could facilitate combining the data of multiple hs-cTNT measurements to examine the cumulative hs-cTNT.
Accordingly, using the data from a nationally prospective cohort of patients hospitalized for HF, we aimed to assess the association of long-term cumulative hs-cTNT with mortality among patients with acute HF.
Methods
Study design and participants
The China Patient-Centered Evaluative Assessment of Cardiac Events Prospective Heart Failure Study (China PEACE 5p-HF Study) is a nationwide, prospective, multicentre observational cohort study. The protocol of the China PEACE 5p-HF Study has been published.13 In brief, we conducted a large national prospective study that recruited acute HF patients from 52 hospitals throughout 20 provinces from all economic–geographic regions in China between August 2016 and May 2018. Patients were eligible if they were ≥18 years, hospitalized with a primary diagnosis of new-onset HF or decompensated chronic HF defined by local physicians. The diagnosis criteria of HF were based on the Chinese guidelines of HF,14 which are consistent with those of the American College of Cardiology/American Heart Association and the European Society of Cardiology.1, 15 We consecutively screened eligible patients and registered all eligible patients and obtained their consent within 48 h after admission. Patients were followed up at 1, 6, and 12 months after discharge and annually thereafter. In the analyses, patients were excluded if they were hospitalized with acute myocardial infarction, had an estimated glomerular filtration rate (eGFR) < 30 mL/min/1.73 m2, or had a hs-cTNT > 5 × upper reference limit (70 ng/L) at admission.16 Only patients with hs-cTNT data at admission (48 h of admission) and 1 and 12 months after discharge were included in this analyses (Figure 1). The detailed process of patient selection is shown in the Supporting Information, Figure S1.
The ethics committee at Fuwai Hospital and local ethics committees at study hospitals approved the China PEACE 5p-HF Study, and the investigation conforms with the principles outlined in the Declaration of Helsinki. The study is registered at www.clinicaltrials.gov (NCT 02878811).
Data collection and definition
Demographics (age and sex) were collected by physicians using a standardized questionnaire through in-person interviews during the index hospitalization. Co-morbidities, clinical characteristics at admission (systolic blood pressure, diastolic blood pressure, and heart rate), New York Heart Association (NYHA) class, and medication at discharge were obtained from the medical charts. Left ventricular ejection fraction (LVEF) was measured according to the standard echocardiogram protocol by trained local physicians. Blood samples were taken within 48 h of admission, and biomarkers [hs-cTNT, N-terminal pro-B type natriuretic peptide (NT-proBNP), creatinine, glycosylated haemoglobin A1c (HbA1c), and high-sensitivity C-reactive protein (hsCRP)] were analysed in the central laboratory. Haemoglobin and albumin at admission were analysed in the local laboratories.
HF presentations were categorized as new-onset HF and decompensated chronic HF: New-onset HF was defined as patients without a medical history of previous HF, and decompensated chronic HF as patients with previous HF at baseline.17 LVEF subtypes were categorized as HF with reduced ejection fraction (HFrEF, LVEF ≤ 40%), HF with mildly reduced ejection fraction (HFmrEF, LVEF 41–49%), and HF with preserved ejection fraction (HFpEF, LVEF ≥ 50%).1 Co-morbidities, including hypertension, coronary heart disease, myocardial infarction, atrial fibrillation, valvular heart disease, anaemia, diabetes, reduced renal function, chronic obstructive pulmonary disease, and stroke, were defined according to medical history, discharge diagnosis, and laboratory results. Anaemia was defined as haemoglobin < 120 g/L in men or haemoglobin < 110 g/L in women18 and diabetes as a history of diabetes or HbA1c ≥ 6.5%. Patients' eGFR levels were calculated using an equation developed by adaptation of the Modification of Diet in Renal Disease equation based on data from Chinese patients with chronic kidney disease, and reduced renal function was defined as an eGFR < 60 mL/min/1.73 m2.19, 20 Self-report use of medications was recorded at each follow-up.
High-sensitivity cardiac troponin T assay
Serum hs-cTNT levels were centrally analysed by a clinical chemistry analyser (Roche E601); the limit of detection was 3 ng/L. The intra-assay coefficient of variation was ≤8.15%, and the inter-assay coefficient of variation was ≤9.78%.
The time-points of hs-cTNT assays were decided based on literature review. It was reported that approximately 50% of deaths within 5 years occurred in the first year and approximately 30% of deaths within 1 year occurred in the first month after discharge.21-23 Moreover, the first month of discharge is also considered as a vulnerable phase, which has a particularly excess risk of death or rehospitalization.24, 25 Therefore, we measured hs-cTNT levels at three key time-points: admission, 1 month, and 12 months after discharge.
Outcomes
Among the survived patients at 1 year of discharge, we reported their all-cause death and cardiovascular death after 12 months of discharge. Cardiovascular death included sudden cardiac death and death due to HF, cerebrovascular events, acute coronary syndrome, aortic vascular disease, peripheral arterial disease, and pulmonary hypertension.
Deaths were collected, adjudicated, and recorded by internationally recognized practice in multicentre clinical trials.26 Deaths were collected from death certificates, interviews of patients' relatives, or the national database of death causes. The clinical outcome data were confirmed by the clinic staff at the national coordinating centre.27
Statistical analysis
For descriptive statistics, the median [interquartile range (IQR)] was used for continuous variables and numbers and frequency (per cent) for categorical variables. Differences in characteristics between groups were tested by the Kruskal–Wallis tests or Mantel–Haenszel tests.
Two approaches were used to evaluate the long-term cumulative hs-cTNT from admission (within 48 h of admission) to 12 months after discharge, that is, the cumulative hs-cTNT level and the cumulative times of high hs-cTNT level. Firstly, we used the area under the curve to calculate the cumulative hs-cTNT level, based on the same approach adopted in previous studies.9, 11, 28 Details of the calculation of the area under the curve are shown in Supporting Information, Figure S2. Participants were categorized into four groups by their cumulative hs-cTNT level quartile ranking: Quartile 1, <92 ng/L*month (as the reference group); Quartile 2, 92–150 ng/L*month; Quartile 3, 150–242 ng/L*month; and Quartile 4, ≥242 ng/L*month. Secondly, in the present analyses, an elevated level of hs-cTNT was defined as a hs-cTNT level higher than the appropriate cut-off value, which was determined with a receiver operating characteristic curve (Supporting Information, Table S1).12, 29 And patients were categorized based on the cumulative times of high hs-cTNT level at admission, 1 month, and 12 months: zero time (hs-cTNT level less than the cut-off value at all three time-points, as the reference group), one time (hs-cTNT level higher than the cut-off value at one of the three time-points), two times (hs-cTNT level higher than the cut-off value at two of the three time-points), and three times (hs-cTNT level higher than the cut-off value at all three time-points).
We compared all-cause and cardiovascular mortality across the patient groups using the Kaplan–Meier analysis and log-rank tests. Cox regression analyses were used to assess the adjusted association of cumulative hs-cTNT level with all-cause and cardiovascular mortality. Candidate covariates were selected based on literature review and clinical experience, including age, sex, history of hypertension, atrial fibrillation, coronary heart disease, valvular heart disease, anaemia, diabetes, reduced renal function, HF presentation (new-onset HF or decompensated chronic HF), LVEF subtype (HFrEF, HFmrEF, or HFpEF), 12-month NT-proBNP, hsCRP, creatinine levels, and self-reported 12-month medication of angiotensin-converting enzyme inhibitors (ACE-Is)/angiotensin receptor blockers (ARBs)/angiotensin receptor neprilysin inhibitors (ARNIs), beta-blockers, and aldosterone antagonists. When cardiovascular death was analysed, non-cardiovascular death was considered as a competing risk.30 Furthermore, we used a restricted cubic spline to explore the potential dose–response pattern of the association of cumulative hs-cTNT level with the outcomes.9
The interactions between the cumulative hs-cTNT level quartiles and subgroup parameters were also included in the Cox models. Subgroup parameters included age, sex, medical history of coronary heart disease, anaemia, hsCRP and NT-proBNP levels at 12 months after discharge, HF presentations, and LVEF subtypes. In addition, we evaluated the improvement in the predictive ability of adding cumulative hs-cTNT level to an established risk score [Get with the Guidelines-Heart Failure (GWTG-HF) score] by C-statistics, categorical net reclassification improvement, and integrated discrimination improvement, respectively.31
To examine the robustness of the results, sensitivity analyses were performed. We further evaluated the association between cumulative hs-cTNT with the outcome risks, excluding the patients rehospitalized for HF, myocardial infarction, or angina pectoris within 1 year after discharge who might have an increase of hs-cTNT level.
The rates of missing value ranged from 0% to 4.7% (HbA1c). Because the missing values were few, multiple imputation by the Markov chain Monte Carlo method was used to impute baseline missing data based on various clinical variables. All statistical analyses were conducted using SAS version 9.4 (SAS Institute) and R version 4.1.3 (R Foundation for Statistical Computing), with a two-tailed alpha value of 0.05 considered statistically significant.
Results
Characteristics of patients
A total of 1137 patients hospitalized for HF with a median follow-up of 4.76 (IQR: 4.25–5.07) years were included in the analyses.
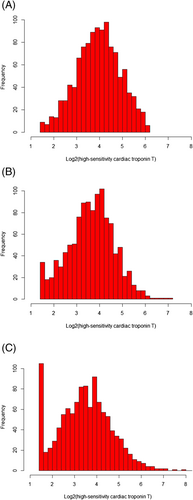
The median age of the included patients was 64 (IQR: 54–73) years, and women accounted for 35.7% (n = 406). The median hs-cTNT levels were 15.5 (IQR: 9.9–24.5), 12.8 (IQR: 8.0–19.6), and 11.1 (IQR: 6.2–18.9) ng/L at admission, 1 month, and 12 months after discharge, respectively (Figure 1). And the median cumulative hs-cTNT level was 150 (IQR: 91–241) ng/L*month.
The characteristics based on the cumulative hs-cTNT level quartiles are presented in Table 1. Patients with higher cumulative hs-cTNT levels tended to be older and male; have lower heart rate; have higher NYHA class; have reduced renal function; have decompensated chronic HF; have higher levels of NT-proBNP, creatinine, and hsCRP; and be less likely to be prescribed with beta-blockers. Moreover, based on the cumulative times of high hs-cTNT level, 404 (35.5%) patients were with zero time, 203 (17.9%) one time, 174 (15.3%) two times, and 356 (31.3%) three times. The characteristics based on the cumulative times of high hs-cTNT level are shown in the Supporting Information, Table S2. Similarly, patients with more cumulative times of high hs-cTNT tended to be older, be male, and have higher NYHA class, reduced renal function, decompensated chronic HF, and higher levels of NT-proBNP, creatinine, and hsCRP.
| Overall (n = 1137) | Quartile 1 (n = 284) | Quartile 2 (n = 285) | Quartile 3 (n = 284) | Quartile 4 (n = 284) | P value for trend | |
|---|---|---|---|---|---|---|
| Demographic | ||||||
| Age, year, median (IQR) | 64 (54–73) | 57 (47–66) | 66 (57–72) | 66 (58–74) | 68 (58–76) | <0.001 |
| Female, n (%) | 406 (35.7) | 143 (50.4) | 106 (37.2) | 84 (29.6) | 73 (25.7) | <0.001 |
| Clinical characteristics | ||||||
| SBP, mmHg, median (IQR) | 130 (120–147) | 130 (120–147) | 132 (120–147) | 131 (119–150) | 130 (120–146) | 0.808 |
| DBP, mmHg, median (IQR) | 80 (70–92) | 80 (73–94) | 80 (70–90) | 80 (70–93) | 80 (70–90) | 0.144 |
| Heart rate, b.p.m., median (IQR) | 86 (72–103) | 90 (72–110) | 88 (73–103) | 87 (72–103) | 82 (72–99) | 0.012 |
| NYHA class, n (%) | <0.001 | |||||
| II | 179 (15.7) | 66 (23.2) | 50 (17.5) | 35 (12.3) | 28 (9.9) | <0.001 |
| III | 515 (45.3) | 126 (44.4) | 141 (49.8) | 131 (46.1) | 117 (41.2) | 0.250 |
| IV | 443 (39.0) | 92 (32.4) | 94 (33.0) | 118 (41.6) | 139 (48.9) | <0.001 |
| Medical history, n (%) | ||||||
| Hypertension | 671 (59.0) | 159 (56.0) | 162 (56.8) | 167 (58.8) | 183 (64.4) | 0.036 |
| Atrial fibrillation | 451 (39.7) | 105 (37.0) | 114 (40.0) | 112 (39.4) | 120 (42.3) | 0.239 |
| Coronary heart disease | 661 (58.1) | 133 (46.8) | 180 (63.2) | 176 (62.0) | 172 (60.6) | 0.002 |
| Myocardial infarction | 216 (19.0) | 30 (10.6) | 61 (21.4) | 65 (22.9) | 60 (21.1) | 0.002 |
| Valvular heart disease | 175 (15.4) | 39 (13.7) | 48 (16.8) | 38 (13.4) | 50 (17.6) | 0.395 |
| Stroke | 217 (19.1) | 40 (14.1) | 59 (20.7) | 58 (20.4) | 60 (21.1) | 0.046 |
| COPD | 219 (19.3) | 40 (14.1) | 55 (19.3) | 66 (23.2) | 58 (20.4) | 0.045 |
| Reduced renal function | 241 (21.2) | 20 (7.0) | 45 (15.8) | 75 (26.4) | 101 (35.6) | <0.001 |
| Anaemia | 110 (9.7) | 19 (6.7) | 29 (10.2) | 25 (8.8) | 37 (13.0) | 0.025 |
| Diabetes | 333 (29.3) | 63 (22.2) | 67 (23.5) | 103 (36.3) | 100 (35.2) | <0.001 |
| Current smoking | 334 (29.4) | 79 (27.8) | 92 (32.3) | 80 (28.2) | 83 (29.2) | 0.993 |
| HF presentation, n (%) | <0.001 | |||||
| New-onset HF | 313 (27.5) | 118 (41.5) | 86 (30.2) | 66 (23.2) | 43 (15.1) | |
| Decompensated chronic HF | 824 (72.5) | 166 (58.5) | 199 (69.8) | 218 (76.8) | 241 (84.9) | |
| LVEF, %, median (IQR) | 44 (34–55) | 45 (35–57) | 47 (35–56) | 43 (34–54) | 42 (34–54) | 0.016 |
| LVEF subtypes, n (%) | 0.026 | |||||
| HFrEF | 467 (41.1) | 106 (37.3) | 111 (38.9) | 127 (44.7) | 123 (43.3) | 0.069 |
| HFmrEF | 266 (23.4) | 72 (25.4) | 54 (18.9) | 69 (24.3) | 71 (25.0) | 0.702 |
| HFpEF | 404 (35.5) | 106 (37.3) | 120 (42.1) | 88 (31.0) | 90 (31.7) | 0.027 |
| Biomarkers at baseline, median (IQR) | ||||||
| Haemoglobin, g/L | 139 (127–151) | 139 (128–151) | 139 (129–150) | 139 (128–150) | 138 (124–152) | 0.885 |
| Albumin, g/L | 40 (37–43) | 40 (38–43) | 40 (37–43) | 40 (37–43) | 39 (37–42) | 0.003 |
| Hs-cTNT, mg/L, median (IQR) | ||||||
| Hs-cTNT at admission | 15.5 (9.9–24.5) | 7.9 (5.4–10.7) | 12.7 (10.0–16.6) | 18.3 (14.5–24.1) | 29.5 (21.0–39.1) | <0.001 |
| Hs-cTNT at 1 month | 12.8 (8.0–19.6) | 5.4 (4.0–6.8) | 10.5 (9.0–11.9) | 16.2 (13.9–18.3) | 26.4 (21.3–34.9) | <0.001 |
| Hs-cTNT at 12 months | 11.1 (6.2–18.9) | 4.0 (3.0–5.7) | 9.0 (7.2–10.6) | 14.9 (12.4–17.6) | 28.0 (21.4–39.7) | <0.001 |
| NT-proBNP, ng/L, median (IQR) | ||||||
| NT-proBNP at admission | 979 (396–2065) | 504 (143–1198) | 852 (396–1648) | 1059 (542–2311) | 1577 (778–3141) | <0.001 |
| NT-proBNP at 1 month | 683 (276–1434) | 276 (102–609) | 581 (247–1131) | 893 (395–1605) | 1296 (646–2206) | <0.001 |
| NT-proBNP at 12 months | 574 (193–1275) | 152 (56–441) | 507 (153–1033) | 668 (329–1423) | 1260 (641–2379) | <0.001 |
| Creatinine, μmol/L, median (IQR) | ||||||
| Creatinine at admission | 90 (77–105) | 79 (69–90) | 90 (77–102) | 94 (81–110) | 100 (85–118) | <0.001 |
| Creatinine at 1 month | 84 (71–99) | 76 (64–85) | 82 (70–96) | 89 (76–105) | 93 (78–113) | <0.001 |
| Creatinine at 12 months | 88 (75–103) | 76 (65–88) | 84 (75–97) | 92 (80–107) | 100 (86–123) | <0.001 |
| hsCRP, ng/L, median (IQR) | ||||||
| hsCRP at admission | 3.3 (1.4–8.3) | 2.6 (1.1–7.2) | 2.5 (1.2–6.6) | 3.9 (1.6–7.9) | 4.3 (1.9–13.1) | <0.001 |
| hsCRP at 1 month | 1.4 (0.7–3.1) | 1.1 (0.5–2.4) | 1.4 (0.6–2.7) | 1.5 (0.7–3.0) | 2.0 (0.9–4.8) | <0.001 |
| hsCRP at 12 months | 1.7 (0.7–3.6) | 1.2 (0.6–2.8) | 1.5 (0.7–3.0) | 1.9 (0.8–4.2) | 2.6 (1.0–5.4) | <0.001 |
| Medication at 12 months, n (%) | ||||||
| ACE-I/ARB/ANRIs | 535 (47.1) | 147 (51.8) | 121 (42.5) | 138 (48.6) | 129 (45.4) | 0.332 |
| Beta-blockers | 730 (64.2) | 203 (71.5) | 186 (65.3) | 183 (64.4) | 158 (55.6) | <0.001 |
| Aldosterone antagonists | 512 (45.0) | 117 (41.2) | 123 (43.2) | 134 (47.2) | 138 (48.6) | 0.047 |
| Cumulative hs-cTNT level, ng/L*month, median (IQR) | 150 (92–242) | 64 (48–78) | 120 (106–138) | 192 (166–214) | 317 (270–445) | <0.001 |
- Abbreviations: ACE-I, angiotensin-converting enzyme inhibitor; ARB, angiotensin receptor blocker; ARNI, angiotensin receptor neprilysin inhibitor; COPD, chronic obstructive pulmonary disease; DBP, diastolic blood pressure; HF, heart failure; HFmrEF, heart failure with mildly reduced ejection fraction; HFpEF, heart failure with preserved ejection fraction; HFrEF, heart failure with reduced ejection fraction; hsCRP, high-sensitivity C-reactive protein; hs-cTNT, high-sensitivity cardiac troponin T; IQR, interquartile range; LVEF, left ventricular ejection fraction; NT-proBNP, N-terminal pro-B type natriuretic peptide; NYHA class, New York Heart Association class; Reduced renal function, estimated glomerular filtration rate < 60 mL/min/1.73 m2; SBP, systolic blood pressure.
Association between long-term cumulative high-sensitivity cardiac troponin T level and outcomes
A total of 303 (26.6%) all-cause deaths were reported. As shown in Figure 2, the Kaplan–Meier curves indicated a stepwise increase in the incidence of 4-year all-cause death across the quartiles of cumulative hs-cTNT level (Quartile 1: 7.4%; Quartile 2: 21.8%; Quartile 3: 32.0%; Quartile 4: 45.4%; log-rank P < 0.001) and cumulative times of high hs-cTNT level (zero time: 11.4%; one time: 20.2%; two times: 35.6%; four times: 43.3%; log-rank P < 0.001). In the multivariable analyses, compared with the hazard ratio (HR) in Quartile 1, the HR was 2.47 [95% confidence interval (CI): 1.49–4.08] in Quartile 2, 3.35 (95% CI: 2.05–5.48) in Quartile 3, and 4.14 (95% CI: 2.51–6.85) in Quartile 4 (P for trend < 0.001). For each standard deviation (SD) increment, the corresponding HR for the cumulative hs-cTNT level was 1.14 (95% CI: 1.05–1.23) (Figure 3). As shown in Figure 4, a non-linear association was observed between cumulative hs-cTNT level and all-cause mortality (P for non-linearity < 0.001). Moreover, compared with the patients with zero time of high hs-cTNT level, patients in the remaining groups all had increased all-cause mortality: one time (HR: 1.60; 95% CI: 1.05–2.45), two times (HR: 2.61; 95% CI: 1.76–3.87), and three times (HR: 2.86; 95% CI: 1.98–4.14), respectively (Figure 3, P for trend < 0.001).
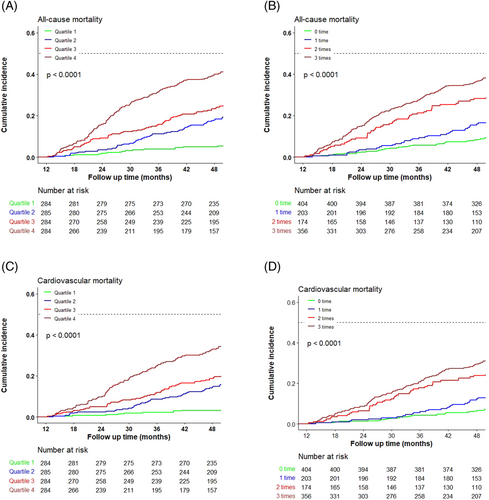
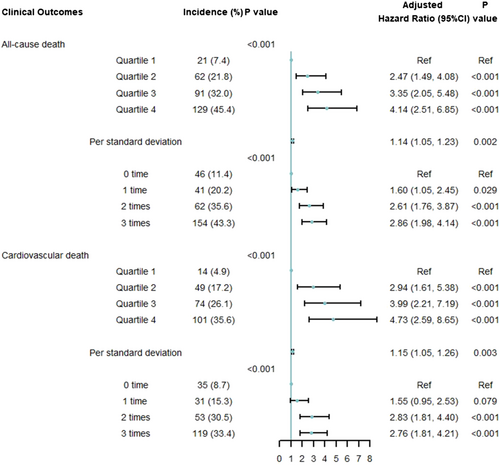
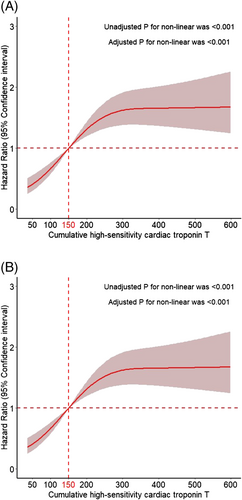
Cardiovascular death occurred in 238 (20.9%) patients. A higher cumulative hs-cTNT level (Quartile 1: 4.9%; Quartile 2: 17.2%; Quartile 3: 26.1%; Quartile 4: 35.6%; log-rank P < 0.001) and cumulative times of high hs-cTNT level (zero time: 8.7%; one time: 15.3%; two times: 30.5%; three times: 33.4%; log-rank P < 0.001) were associated with an elevated risk of cardiovascular death (Figure 2). After adjustment, compared with the HR for Quartile 1, the HR was 2.94 (95% CI: 1.61–5.38) for Quartile 2, 3.99 (95% CI: 2.21–7.19) for Quartile 3, and 4.73 (95% CI: 2.59–8.65) for Quartile 4 (P for trend < 0.001). For each SD increment, the corresponding HR for the cumulative hs-cTNT level was 1.15 (95% CI: 1.05–1.26) (Figure 3). As shown in Figure 4, a significant non-linear association was observed in the association between cardiovascular mortality and cumulative hs-cTNT level (P for non-linearity < 0.001). In addition, compared with the adjusted HR for patients with zero time of high hs-cTNT level, the adjusted HR was 1.55 (95% CI: 0.95–2.53) for patients with one time, 2.83 (95% CI: 1.81–4.40) for patients with two times, and 2.76 (95% CI: 1.81–4.21) for patients with three times of high hs-cTNT level (Figure 3, P for trend < 0.001).
There were no significant interactions between the cumulative hs-cTNT level and cumulative times of high hs-cTNT level in the subgroups: age, sex, medical history of coronary heart disease, anaemia, levels of hsCRP and NT-proBNP at 12 months, HF presentation, and LVEF subtypes (Supporting Information, Table S3).
Incremental prognostic value of cumulative high-sensitivity cardiac troponin T level
The prognostic capabilities of cumulative hs-cTNT level significantly improved as measured by net reclassification improvement and integrated discrimination improvement when adding the cumulative hs-cTNT level to the GWTG-HF score (Supporting Information, Table S4).
Sensitivity analyses
In the sensitivity analyses, the cut-off values of high levels of hs-cTNT are shown in the Supporting Information, Table S5. Similar patterns of associations of long-term cumulative hs-cTNT with all-cause and cardiovascular mortality were observed (Supporting Information, Figures S3 and S4).
Discussion
To our knowledge, this is the first study to report the association between long-term cumulative hs-cTNT and mortality. Compared with the patients in the lowest quartile of cumulative hs-cTNT level, those in the highest quartile had a four-fold risk of all-cause death. Similarly, patients with three times of high hs-cTNT level had three-fold risks of all-cause mortality than those with zero time of high hs-cTNT level. The association was independent of other conventional risk factors and consistent across subgroups. These findings suggest that repeated measurements of hs-cTNT level after discharge could assist physicians in identifying the high-risk patients.
This study expanded on the literature by providing an insight into the cumulative hs-cTNT from admission to 12 months after discharge and explored its association with the outcomes. Prior studies reported that elevated cardiac troponin levels at single time-points and increased or persistently high levels of hs-cTNT within the short-term were associated with adverse events.2, 6, 32 For instance, Felker et al. found that hs-cTNT elevation at a single time-point and hs-cTNT increase were associated with worse outcomes within a 180-day follow-up.6 Greene et al. reported that cardiac troponin elevation at 1 month after discharge was independently predictive of increased risk of death or HF rehospitalization within 12 months.2 And Takashio et al. found that persistently elevated hs-cTNT levels during hospitalization were a predictor of outcomes.32 However, the association of long-term cumulative hs-cTNT with outcomes remained to be elucidated. In the current analyses, we included the duration of hs-cTNT level and evaluated the cumulative hs-cTNT from admission to 12 months after discharge using cumulative hs-cTNT levels and cumulative times of high hs-cTNT level. We found that the elevated cumulative hs-cTNT was associated with increased all-cause and cardiovascular mortality. Nevertheless, the exact mechanism between cumulative hs-cTNT and the outcomes in patients with HF is unclear and could be multifactorial. The elevated cardiac troponin level could be associated with the progression to the end-stage diseases, including the loss of cardiomyocytes with deterioration in cardiac function, recurrent episodes of ischaemia, increased wall stress, renal dysfunction, etc., and thereby increase mortality.33, 34 Therefore, the long-term cumulative hs-cTNT level could be a signal in identifying the patients at high risk for death.
The major implications of our findings are that serial hs-cTNT measurements and long-term cumulative hs-cTNT could be useful in post-discharge assessment and provide guidance for the treatment among patients with acute HF. The hs-cTNT assay is simple and convenient, requiring no high-tech equipment or highly educated physicians, which makes it feasible in medical resource-limited settings. Considering the association between hs-cTNT and cardiac injury, post-discharge hs-cTNT assays could help monitor patients' cardiac damage. Moreover, using two novel approaches, we firstly described the long-term cumulative hs-cTNT among the patients with acute HF. And we found that the long-term elevated hs-cTNT level indicated higher mortality and could also provide additional predictive information beyond the GWTG-HF risk score. Therefore, repeated hs-cTNT measurements and cumulative hs-cTNT could be utilized in the daily clinical practice of post-discharge management in patients hospitalized for HF.
The main strength of our study is that it is a nationally prospective cohort study with detailed information collected at the baseline and well-maintained longitudinal follow-up data. This allowed us to evaluate the cumulative hs-cTNT from admission (within 48 h of admission) to 12 months after discharge and analyse its association with mortality after adjustment. Nevertheless, our study is also subject to several limitations. The first limitation is the observational nature of the study. The residual unmeasured confounding in evaluating the associations of cumulative hs-cTNT and mortality may persist, despite the adjustment for a variety of known clinical and laboratory variables. Secondly, we only included the patients with hs-cTNT data at admission and 1 and 12 months after discharge, which accounted for around 30% of the patients who survived within 12 months. Accordingly, our conclusions may be subject to selection bias. However, we analysed the P for interaction of important characteristics and found that the interactions were not significant. Finally, only Chinese patients were included in the study; thus, the generalizability to other ethnicities still needs confirmation.
Conclusions
In conclusion, we found that the elevated levels of cumulative hs-cTNT from admission to 12 months after discharge were associated with higher mortality after 12 months of discharge. The findings indicated that repeated measurements for hs-cTNT levels may help monitor cardiac damage and identify the patients with high risk for death.
Acknowledgements
We appreciate the multiple contributions made by project teams at National Clinical Research Center for Cardiovascular Diseases in the realms of study operation and data collection. We also thank Prof Harlan M. Krumholz from Yale University, Prof Frederick A. Masoudi from the University of Colorado, Prof John A. Spertus from the University of Missouri, Prof Xuyu Jin from the University of Oxford, and Prof Christiane E. Angermann from Universitätsklinikum Würzburg for their advice on study design. We are grateful for the support provided by the Chinese government.
Conflict of interest
There were no conflicts of interest.
Funding
This work was supported by the China Academy of Chinese Medical Sciences Innovation Fund for Medical Science (2021-I2M-1-009), the National Key Research and Development Program (2018YFC1312400) from the Ministry of Science and Technology of China, and the National Key Technology R&D Program (2015BAI12B02) from the Ministry of Science and Technology of China.


